Proceedings of the NAACL HLT 2010 Workshop on Computational Approaches to Analysis and Generation of Emotion in Text, pages 62–70,
Evaluation of Unsupervised Emotion Models
to Textual Affect Recognition
Sunghwan Mac Kim
School of Electrical
and Information Engineering
University of Sydney
Sydney, Australia
[email protected]
Alessandro Valitutti
Department of Cognitive Science
and Education
University of Trento
Trento, Italy
[email protected]
Rafael A. Calvo
School of Electrical
and Information Engineering
University of Sydney
Sydney, Australia
[email protected]
Abstract
In this paper we present an evaluation of new techniques for automatically detecting emo-tions in text. The study estimates categorical model and dimensional model for the recogni-tion of four affective states: Anger, Fear, Joy, and Sadness that are common emotions in three datasets: SemEval-2007 “Affective Text”, ISEAR (International Survey on Emo-tion Antecedents and ReacEmo-tions), and child-ren’s fairy tales. In the first model, WordNet-Affect is used as a linguistic lexical resource and three dimensionality reduction techniques are evaluated: Latent Semantic Analysis (LSA), Probabilistic Latent Semantic Analysis (PLSA), and Non-negative Matrix Factoriza-tion (NMF). In the second model, ANEW (Af-fective Norm for English Words), a normative database with affective terms, is employed. Experiments show that a categorical model us-ing NMF results in better performances for SemEval and fairy tales, whereas a dimension-al model performs better with ISEAR.
1
Introduction
Supervised and unsupervised approaches have been used to automatically recognize expressions of emotion in text such as happiness, sadness,
anger, etc… Supervised learning techniques have the disadvantage that large annotated data-sets are required for training. Since the emotional interpretations of a text can be highly subjective, more than one annotator is needed, and this makes the process of the annotation very time consuming and expensive. For this reason, unsu-pervised methods are normally preferred in the
realm of Natural Language Processing (NLP) and emotions.
Supervised and unsupervised techniques have been compared before. (Strapparava and Mihal-cea 2008) describe the comparison between a supervised (Naïve Bayes) and an unsupervised (Latent Semantic Analysis - LSA) method for recognizing six basic emotions.
These techniques have been applied to many areas, particularly in improving Intelligent Tutor-ing Systems. For example, (D’Mello, Craig et al. 2008) used LSA but for detecting utterance types and affect in students’ dialogue within Autotutor. (D'Mello, Graesser et al. 2007) proposed five categories for describing the affect states in stu-dent-system dialogue.
Significant differences arise not only between these two types of techniques but also between different emotion models, and these differences have significant implications in all these areas. While considering emotions and learning, (Kort, Reilly et al. 2001) proposed (but provided no empirical evidence) a model that combines two emotion models, placing categories in a valence-arousal plane. This mixed approach has also been used in other domains such as blog posts where (Aman and Szpakowicz 2007) studied how to identify emotion categories as well as emotion intensity. To date, many researchers have, how-ever, utilized and evaluated supervised methods, mainly based on the categorical emotion model.
In this study, the goal is to evaluate the merits of two conceptualizations of emotions (a cate-gorical model and a dimensional model) in which an unsupervised approach is used. The evaluation incorporates three dimensionality
duction methods and two linguistic lexical re-sources.
The rest of the paper is organized as follows: In Section 2 we present representative research of the emotion models used to capture the affec-tive states of a text. Section 3 describes the tech-niques of affect classification utilizing lexical resources. More specifically, it describes the role of emotion models and lexical resources in the affect classification. In addition, we give an overview of the dimension reduction methods used in the study. In Section 4 we go over the affective datasets used. Section 5 provides the results of the evaluation, before coming to our discussion in Section 6.
2
Emotion Models
There are two significantly different models for representing emotions: the categorical modeland
dimensional model(Russell 2003).
The categorical model assumes that there are discrete emotional categories such as Ekman’s six basic emotions - anger, disgust, fear, joy,
sadness, and surprise- (Ekman 1992). There are a number of primary and unrelated emotions in the model. Each emotion is characterized by a specific set of features, expressing eliciting con-ditions or responses. Some researchers have ar-gued that a different set of emotions is required for different domains. For instance, the following emotion classes are used in the field of teaching and education: boredom,delight,flow,confusion,
frustration, and surprise. The advantage of such a representation is that it represents human emo-tions intuitively with easy to understand emotion labels.
A second approach is the dimensional model, which represents affects in a dimensional form (Russell 2003). Emotional states are related each other by a common set of dimensions (e.g. va-lence or arousal) and are generally defined in a two or three dimensional space. Each emotion occupies some location in this space. A valence dimension indicates positive and negative emo-tions on different ends of the scale. The arousal dimension differentiates excited vs. calm states. Sometimes a third, dominance dimension is used to differentiate if the subject feels in control of the situation or not.
The categorical model and the dimensional model have two different methods for estimating the actual emotional states of a person. In the former, a person is usually required to choose one emotion out of an emotion set that represents
the best feeling. On the other hand, the latter ex-ploits rating scales for each dimension like the Self Assessment Manikin (SAM) (Lang 1980), which consists of pictures of manikins, to esti-mate the degree of valence, arousal, and domi-nance.
3
Automatic Affect Classification
3.1 Categorical classification with features derived from WordNet-Affect
WordNet-Affect (Strapparava and Valitutti 2004) is an affective lexical repository of words refer-ring to emotional states. WordNet-Affect extends WordNet by assigning a variety of affect labels to a subset of synsets representing affective con-cepts in WordNet (emotional synsets). In addi-tion, WordNet-Affect has an additional hierarchy of affective domain labels. There are publicly available lists relevant to the six basic emotion categories extracted from WordNet-Affect and we used four of the six lists of emotional words among them for our experiment.
In addition to WordNet-Affect, we exploited a Vector Space Model (VSM) in which terms and textual documents can be represented through a term-by-document matrix. More specifically, terms are encoded as vectors, whose components are co-occurrence frequencies of words in corpo-ra documents. Frequencies are weighted accord-ing to the log-entropy with respect to a tf-idf
weighting schema (Yates and Neto 1999). Final-ly, the number of dimensions is reduced through the dimension reduction methods.
The vector-based representation enables words, sentences, and sets of synonyms (i.e. WordNet synsets) to be represented in a unifying way with vectors. VSM provides a variety of definitions of distance between vectors, corresponding to dif-ferent measures of semantic similarity. In par-ticular, we take advantage of cosine angle be-tween an input vector (input sentence) and an emotional vector (i.e. the vector representing an emotional synset) as similarity measures to iden-tify which emotion the sentence connotes.
3.2 Dimension Reduction Methods
The VSM representation can be reduced with techniques well known in Information Retrieval: LSA, Probabilistic LSA (PLSA), or the Non-negative Matrix Factorization (NMF) representa-tions.
does not exceed a threshold, the input sentence is labeled as “neutral”, the absence of emotion. Otherwise, it is labeled with one emotion asso-ciated with the closest emotional vector having the highest similarity value. We use a predeter-mined threshold (t = 0.65) for the purpose of va-lidating a strong emotional analogy between two vectors (Penumatsa, Ventura et al. 2006).
If we define the similarity between a given in-put text, I, and an emotional class, ! , as sim(I, !), the categorical classification result, CCR, is more formally represented as follows:
CCR(")
=#arg max! $sim%", !&' if sim(", !)( ) "neutral" if sim(", !) <)
*
One class with the maximum score is selected as the final emotion class.
Dimensionality reduction in VSM reduces the computation time and reduces the noise in the data. This enables the unimportant data to dissi-pate and underlying semantic text to become more patent. We will review three statistical di-mensionality reduction methods (LSA, PLSA, and NMF) that are utilized in a category-based emotion model.
Latent Semantic Analysis (LSA) is the earliest approach successfully applied to various text manipulation areas (Landauer, Foltz et al. 1998). The main idea of LSA is to map terms or docu-ments into a vector space of reduced dimensio-nality that is the latent semantic space. The map-ping of the given terms/document vectors to this space is based on singular vector decomposition (SVD). It is known that SVD is a reliable tech-nique for matrix decomposition. It can decom-pose a matrix as the product of three matrices.
+=,-./ 0 ,1-1.1/ =+1 (1)
where Ak is the closest matrix of rank k to the
original matrix. The columns of Vkrepresent the
coordinates for documents in the latent space. Probabilistic Latent Semantic Anlaysis (PLSA) (Hofmann 2001) has two characteristics distin-guishing it from LSA. PLSA defines proper probability distributions and the reduced matrix does not contain negative values. Based on the combination of LSA and some probabilistic theo-ries such as Bayes rules, the PLSA allows us to find the latent topics, the association of docu-ments and topics, and the association of terms and topics. In the equation (2), zis a latent class variable(i.e. discrete emotion category), while w
and d denote the elements of term vectors and document vectors, respectively.
2(3,4) = 5 2(6)2(4|6)2(3|6)
6 (2)
where P(w|z) and P(d|z) are topic-specific word distribution and document distribution, indivi-dually. The decomposition of PLSA, unlike that of LSA, is performed by means of the likelihood function. In other words, P(z), P(w|z),and P(d|z)
are determined by the maximum likelihood esti-mation (MLE) and this maximization is per-formed through adopting the Expectation Max-imization (EM) algorithm. For document similar-ities, each row of the P(d|z)matrix is considered with the low-dimensional representation in the semantic topic space.
Non-negative Matrix Factorization (NMF) (Lee and Seung 1999) has been successfully ap-plied to semantic analysis. Given a non-negative matrixA, NMF finds non-negative factors Wand
H that are reduced-dimensional matrices. The product WH can be regarded as a compressed form of the data in A.
+ 0 78= 5 78 (3)
W is a basis vector matrix and H is an encoded matrix of the basis vectors in the equation (3). NMF solves the following minimization problem (4) in order to obtain an approximation A by computing Wand H in terms of minimizing the Frobenius norm of the error.
9:;7,8<+ = 78<>2, ?.). 7,8 (0 (4) where W,H 0 means that all elements of Wand
Hare non-negative. This non-negative peculiari-ty is desirable for handling text data that always require non-negativity constraints. The classifi-cation of documents is performed based on the columns of matrix H that represent the docu-ments.
3.3 Three-dimensional estimation with fea-tures derived from ANEW
4@= (ABCD;ED,BFGH?BC,3G9:;B;ED)
=+I 7(4) (5)
The occurrences of these words in a text can be used, in a naïve way, to weight the sentence in this emotional plane. This is a naïve approach since words often change their meaning or emo-tional value when they are used in different con-texts.
As a counterpart to the categorical classifica-tion above, this approach assumes that an input sentence pertains to an emotion based on the least distance between each other on the Va-lence-Arousal-Dominance (VAD) space. The input sentence consists of a number of words and the VAD value of this sentence is computed by averaging the VAD values of the words:
?D;)D;ED
JJJJJJJJJJJJ= - 4@
; :=1
; (6)
where nis the total number of words in the input sentence.
Since not many words are available in this normative database, a series of synonyms from WordNet-Affect are used in order to calculate the position of each emotion. These emotional synsets are converted to the 3-dimensional VAD space and averaged for the purpose of producing a single point for the target emotion as follows:
D9G):G;
JJJJJJJJJJJ= - 4@
1 :=1
1 (7)
where kdenotes the total number of synonyms in an emotion. Anger, fear, joy, and sadness emo-tions are mapped on the VAD space. Let Ac,Fc,
Jc, and Scbe the centroids of four emotions. Then
the centroids, which are calculated by the equa-tion (7), are as follows: Ac= (2.55, 6.60, 5.05), Fc
= (3.20, 5.92, 3.60), Jc = (7.40, 5.73, 6.20), and
Sc= (3.15, 4.56, 4.00). Apart from the four
emo-tions, we manually define neutralto be (5, 5, 5). If the centroid of an input sentence is the most approximate to that of an emotion, the sentence is tagged as the emotion (with the nearest neigh-bor algorithm). The centroid?D;)D;EDJJJJJJJJJJJJmight be close to anD9G):G;JJJJJJJJJJJon the VAD space, even if they do not share any terms in common. We de-fine the distance threshold (empirically set to 4) to validate the appropriate proximity like the ca-tegorical classification.
4
Emotion-Labeled Data
Three emotional datasets, with sentence-level emotion annotations, were employed for the evaluation described in the next section. The first dataset is “Affective Text” from the SemEval
2007 task (Strapparava and Mihalcea 2007).1
We also use the ISEAR (International Survey on Emotion Antecedents and Reactions) dataset, which consists of 7,666 sentences (Scherer and Wallbott 1994), with regard to our experiments. This dataset consists of news headlines excerpted from newspapers and news web sites. Headlines are suitable for our experiments because head-lines are typically intended to express emotions in order to draw the readers’ attention. This data-set has six emotion classes: anger,disgust,fear,
joy, sadness and surprise, and is composed of 1,250 annotated headlines. The notable characte-ristics are that SemEval dataset does not only allow one sentence to be tagged with multiple emotions, but the dataset also contains a neutral
category in contrast to other datasets.
2
The annotated sentences of the third dataset are culled from fairy tales (Alm 2009). Emotions are particularly significant elements in the lite-rary genre of fairy tales. The label set with five emotion classes is as follows: angry-disgusted,
fearful,happy,sadand surprised. There are 176 stories by three authors: B. Potter, H.C. Ander-sen, and Grimm’s. The dataset is composed of only sentences with affective high agreements, which means that annotators highly agreed upon the sentences (four identical emotion labels). For building the ISEAR, 1,096 participants who have different cultural backgrounds completed questionnaires about experiences and reactions for seven emotions including anger,disgust,fear,
joy,sadness,shameand guilt.
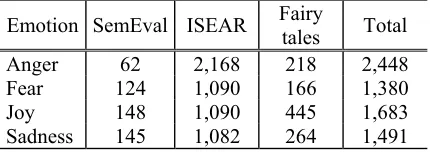
Emotion SemEval ISEAR Fairy
tales Total
Anger 62 2,168 218 2,448
Fear 124 1,090 166 1,380
Joy 148 1,090 445 1,683
[image:4.612.311.526.461.537.2]Sadness 145 1,082 264 1,491
Table 1: Number of sentences for each emotion
In our study, we have taken into account four emotion classes (Anger,Fear,Joy and Sadness) which are in the intersection among three data-sets (SemEval, ISEAR and Fairy tales). The number of sentences for each emotion and each
1
The dataset is publicly available at
http://www.cse.unt.edu/~rada/affecti vetext.
2
Available at
dataset used in our experiment is shown in Table 1. In addition, sample sentences from the anno-tated corpus appear in Table 2.
Dataset Sentences tagged with Sadness/Sad
SemEval Bangladesh ferry sink, 15 dead. ISEAR When I left a man in whom I really
believed. Fairy
tales
[image:5.612.89.523.52.339.2]The flower could not, as on the pre-vious evening, fold up its petals and sleep; it dropped sorrowfully.
Table 2: Sample sentences labeled with sadness/sad from the datasets
5
Experiments and Results
The goal of the affect classification is to predict a single emotional label given an input sentence. Four different approaches were implemented in Matlab. A categorical model based on a VSM with dimensionality reduction variants, (LSA, PLSA, and NMF), and a dimensional model, each with evaluated with two similarity measures (cosine angle and nearest neighbor). Stopwords were removed in all approaches. A Matlab tool-kit (Zeimpekis and Gallopoulos 2005), was used to generate the term-by-sentence matrix from the text.
The evaluation in Table 3 shows Majority Class Baseline (MCB) as the baseline algorithm. The MCB is the performance of a classifier that always predicts the majority class. In SemEval and Fairy tales the majority class is joy, while
angeris the majority emotion in case of ISEAR. The five approaches were evaluated on the data-set of 479 news headlines (SemEval), 5,430 res-ponses to questions (ISEAR), and 1,093 fairy tales’ sentences. We define the following acro-nyms to identify the approaches:
CLSA: LSA-based categorical classification CPLSA: PLSA-based categorical classifica-tion
CNMF: NMF-based categorical classification DIM: Dimension-based estimation
The measure of accuracies used here were: Cohen’s Kappa (Cohen 1960), average precision, recall, and F-measure. While the kappa scores are useful in obtaining an overview of the relia-bility of the various classification approaches, they do not provide any insight on the accuracy at the category level for which precision, recall, and F-measure are necessary.
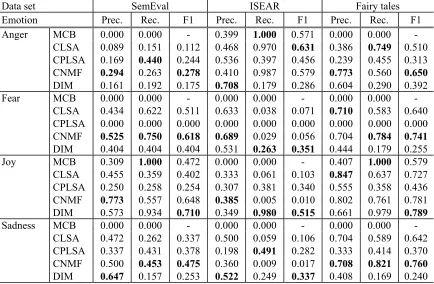
Data set SemEval ISEAR Fairy tales
Emotion Prec. Rec. F1 Prec. Rec. F1 Prec. Rec. F1
Anger MCB 0.000 0.000 - 0.399 1.000 0.571 0.000 0.000 -CLSA 0.089 0.151 0.112 0.468 0.970 0.631 0.386 0.749 0.510 CPLSA 0.169 0.440 0.244 0.536 0.397 0.456 0.239 0.455 0.313 CNMF 0.294 0.263 0.278 0.410 0.987 0.579 0.773 0.560 0.650
DIM 0.161 0.192 0.175 0.708 0.179 0.286 0.604 0.290 0.392
Fear MCB 0.000 0.000 - 0.000 0.000 - 0.000 0.000
-CLSA 0.434 0.622 0.511 0.633 0.038 0.071 0.710 0.583 0.640 CPLSA 0.000 0.000 0.000 0.000 0.000 0.000 0.000 0.000 0.000 CNMF 0.525 0.750 0.618 0.689 0.029 0.056 0.704 0.784 0.741
DIM 0.404 0.404 0.404 0.531 0.263 0.351 0.444 0.179 0.255 Joy MCB 0.309 1.000 0.472 0.000 0.000 - 0.407 1.000 0.579 CLSA 0.455 0.359 0.402 0.333 0.061 0.103 0.847 0.637 0.727 CPLSA 0.250 0.258 0.254 0.307 0.381 0.340 0.555 0.358 0.436 CNMF 0.773 0.557 0.648 0.385 0.005 0.010 0.802 0.761 0.781 DIM 0.573 0.934 0.710 0.349 0.980 0.515 0.661 0.979 0.789
Sadness MCB 0.000 0.000 - 0.000 0.000 - 0.000 0.000 -CLSA 0.472 0.262 0.337 0.500 0.059 0.106 0.704 0.589 0.642 CPLSA 0.337 0.431 0.378 0.198 0.491 0.282 0.333 0.414 0.370 CNMF 0.500 0.453 0.475 0.360 0.009 0.017 0.708 0.821 0.760
[image:5.612.89.523.53.337.2]DIM 0.647 0.157 0.253 0.522 0.249 0.337 0.408 0.169 0.240
5.1 Precision, Recall, and F-measure
Classification accuracy is usually measured in terms of precision, recall, and F-measure. Table 3 shows these values obtained by five approach-es for the automatic classification of four emo-tions. The highest results for a given type of scoring and datasets are marked in bold for each individual class. We do not include the accuracy values in our results due to the imbalanced pro-portions of categories (see Table 1). The accura-cy metric does not provide adequate information, whereas precision, recall, and F-measure can ef-fectively evaluate the classification performance with respect to imbalanced datasets (He and Gar-cia 2009).
As can be seen from the table, the perfor-mances of each approach hinge on each dataset and emotion category, respectively. In the case of the SemEval dataset, precision, recall and F-measure for CNMF and DIM are comparable. DIM approach gives the best result for joy, which has a relatively large number of sentences. In ISEAR, DIM generally outperforms other ap-proaches except for some cases, whereas CNMF has the best recall score after the baseline for the
angercategory. Figure 1 indicates the results of 3-dimensional and 2-dimensional attribute evalu-ations for ISEAR. When it comes to fairy tales, CNMF generally performs better than the other techniques. Joy also has the largest number of data instances in fairy tales and the best recall ignoring the baseline and F-measure are obtained with the approach based on DIM for this affect category. CNMF gets the best emotion detection performance for anger, fear, and sadness in terms of the F-measure.
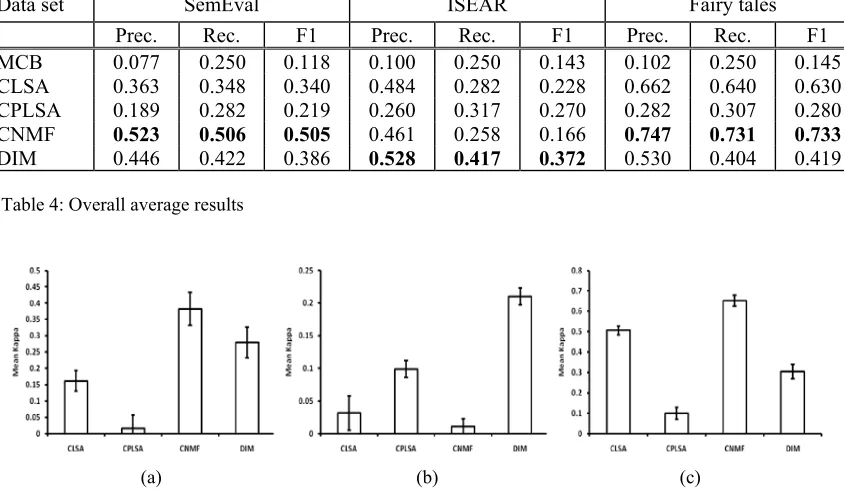
Figure 2 and Table 4 display results among different approaches obtained on the three differ-ent datasets. We compute the classification per-formance by macro-average, which gives equal weight to every category regardless of how many sentences are assigned to it.3
3
Macro-averaging scores are defined as:
This measurement prevents the results from being biased given the imbalanced data distribution. From this summa-rized information, we can see that CPLSA per-forms less effectively with several low perfor-mance results across all datasets. CNMF is supe-rior to other methods in SemEval and Fairy tales
2m = 1
K- LK:=1 :,Mm = 1
K- FK:=1 :,>m = 1 K- NK:=1 :
where Cis total number of categories, and pi, ri, and fi stand for precision, recall, and F-measure, respective-ly, for each category i.
datasets, while DIM surpasses the others in ISEAR. In particular, CPLSA outperforms CLSA and CNMF in ISEAR because their per-formances are relatively poor. The result implies that statistical models which consider a proba-bility distribution over the latent space do not always achieve sound performances. In addition, we can infer that models (CNMF and DIM) with non-negative factors are appropriate for dealing with these text collections.
Another notable result is that the precision, re-call, and F-measure are generally higher in fairy tales than in the other datasets. These sentences in the fairy tales tend to have more emotional terms and the length of sentences is longer. The nature of fairy tales makes unsupervised models yield better performance (see Table 2). In addi-tion, affective high agreement sentence is anoth-er plausible contributing reason for the encourag-ing experimental results.
In summary, categorical NMF model and di-mensional model show the better emotion identi-fication performance as a whole.
5.2 Cohen’s Kappa
The kappa statistic measures the proportion of agreement between two raters with correction for chance. The kappa score is used as the metric to compare the performance of each approach. Fig-ure 3 graphically depicts the mean kappa scores and its standard errors obtained from the emotion classification. Comparisons between four ap-proaches are shown across all three datasets. MCB is excluded in the comparison because the mean kappa score of MCB is 0.
Let MKCLSA,MKCPLSA,MKCNMF, and MKDIMbe
the mean kappa scores of four methods. The highest score (MKCNMF = 0.382) is achieved by
the CNMF when the dataset is SemEval. In fairy tales, the CNMF method (MKCNMF= 0.652) also
displays better result than the others (MKCLSA =
0.506, MKDIM = 0.304). On the contrary, the
achieved results are significantly different in the case of the ISEAR dataset in comparison with the aforementioned datasets. The DIM (MKDIM=
0.210) clearly outperforms all methods. The kap-pa score of the CPLSA approach (MKCPLSA =
0.099) is quantitatively and significantly higher than the CLSA (MKCLSA = 0.031) and CNMF
(MKCNMF = 0.011). Kappa score for the
NMF-based methods is remarkably lower than the oth-er three approaches.
SemEval and Fairy tales datasets, while DIM surpasses the others in ISEAR dataset. Our PLSA conducted in all experiments is inferior to NMF, DIM as well as LSA. The result implies that statistical models which consider a proba-bility distribution over the latent space do not always leads to sound performances. In addition, we can infer that models (NMF and DIM) with non-negative factors are appropriate for dealing with text collections. Another interesting notice from overall results is that the precision, recall, and F-measure are higher in fairy tales than in two other datasets. The sentences in fairy tales have ampler emotional terms and the length of sentences is longer in comparison with those in other datasets. The nature of fairy tales makes unsupervised models yield better performance (see Table 2). In summary, categorical NMF model and dimensional model show the better emotion identification performance as a whole.
1.1 Cohen’s Kappa
The kappa score is used as the metric to evaluate the performance of each approach. Figure 4 graphically depicts the mean kappa scores and its standard errors obtained from the emotion classi-fication. Comparisons between four approaches are shown and there are statistically significant differences in the kappa scores across all three datasets. MCB is excluded in the comparison because the mean kappa score of MCB is 0.
Let MKLSA,MKPLSA,MKNMF, and MKDIMbe the
mean kappa scores of four methods. The highest score (MKNMF = 0.382) is achieved by the NMF
when the dataset is SemEval. In fairy tales, the NMF method (MKNMF= 0.652) also displays
bet-ter result than the others (MKLSA= 0.506, MKDIM
= 0.304). Note that the achieved results are somewhat different in case of ISEAR dataset in comparison with the aforementioned experiment which used precision, recall, and F-measure. The DIM (MKDIM = 0.210) clearly outperforms all
methods like section 5.1. On the contrary, the kappa score of the PLSA approach (MKPLSA =
0.099) is quantitatively and significantly higher than the LSA (MKLSA= 0.031) and NMF (MKNMF
= 0.011). Kappa score for the NMF-based me-thods is remarkably lower than the other three approaches. Nevertheless, we can observe that NMF-based categorical model and dimensional model got good grades on the whole.
1.2 Cohen’s Kappa
[image:7.612.135.488.66.217.2]The most frequent words used in ISEAR dataset for each emotion are shown in Table 4. NMF and
Figure 1: Distribution of the ISEAR dataset in the 3-dimensional and 2-dimensional sentiment space. The blue ‘x’ denotes the location of one sentence corresponding to valence, arousal, and dominance.
(a) (b) (c)
Figure 2: Comparisons of Precision, Recall, and F-measure: (a) SemEval; (b) ISEAR; (c) Fairy tales.
Data set SemEval ISEAR Fairy tales
Prec. Rec. F1 Prec. Rec. F1 Prec. Rec. F1
MCB 0.077 0.250 0.118 0.100 0.250 0.143 0.102 0.250 0.145 CLSA 0.363 0.348 0.340 0.484 0.282 0.228 0.662 0.640 0.630 CPLSA 0.189 0.282 0.219 0.260 0.317 0.270 0.282 0.307 0.280 CNMF 0.523 0.506 0.505 0.461 0.258 0.166 0.747 0.731 0.733
[image:7.612.110.505.267.381.2]DIM 0.446 0.422 0.386 0.528 0.417 0.372 0.530 0.404 0.419
Table 4: Overall average results
(a) (b) (c)
[image:7.612.110.532.433.679.2]an acceptable level of agreement. On the basis of this definition, the kappa score obtained by our best classifier (MKCNMF = 0.652) would be
rea-sonable. Most of the values are too low to say that two raters (human judges and computer ap-proaches) agreed upon the affective states. How-ever, we have another reason with respect to this metric in the experiment. We make use of the kappa score as an unbiased metric of the relia-bility for comparing four methods. In other words, these measures are of importance in terms of the relative magnitude. Hence, the kappa re-sults are meaningful and interpretable in spite of low values. We can observe that the NMF-based categorical model and the dimensional model both experienced higher performance.
5.3 Frequently occurring words
The most frequent words used in fairy tales for each emotion are listed in Table 5. We choose this dataset since there are varying lexical items and affective high agreement sentences, as men-tioned in Section 5.1. Stemming is not used cause it might hide important differences as be-tween ‘loving’ and ‘loved’. CNMF and DIM were selected for the comparison with the Gold Standard because they were the two methods with the better performance than the others. Gold Standard is the annotated dataset by human raters for the evaluation of algorithm performance. The words most frequently used to describe anger across all methods include: cried, great, tears,
king, thought, and eyes. Those used to describe fear include: heart, cried,mother,thought,man, and good. Joy contains happy, good, and cried
whereas sadness has only criedfor three methods. There is something unexpected for the word frequencies. We can observe that the association
between frequently used words and emotion cat-egories is unusual and even opposite. For in-stance, a ‘joy’ is one of the most frequent words referred to for sadnessin the Gold Standard. In CNMF and DIM, a ‘good’ is employed frequent-ly with regard to fear. Moreover, some words occur with the same frequency in more catego-ries. For example, the word ‘cried’ is utilized to expressanger,fear, and joyin the Gold Standard, CNMF, and DIM. In order to find a possible ex-planation in the complexity of language used in the emotional expression, some sentences ex-tracted from fairy tales are listed below:
“The cook was frightened when he heard the or-der, and said to Cat-skin, You must have let a hair fall into the soup; if it be so, you will have a
goodbeating.” – which expresses fear
“When therefore she came to the castle gate she saw him, and criedaloud for joy.” – which is the expression forjoy
“Gretel was not idle; she ran screaming to her master, and cried: You have invited a fine guest!” – which is the expression for angry-disgusted
From these examples, we can observe that in these cases the affective meaning is not simply propagated form the lexicon, but is the effect of the linguistic structure at a higher level.
6
Conclusion
We compared the performances of three tech-niques, based on the categorical representation of emotions, and one based on the dimensional rep-resentation. This paper has highlighted that the NMF-based categorical classification performs
Model Emotion Top 10 words
Gold Standard Anger king, thought, eyes, great, cried, looked, joy, mother, wife, tears Fear great, cried, good, happy, thought, man, heart, poor, child, mother Joy thought, mother, good, cried, man, day, wept, beautiful, back, happy Sadness cried, fell, father, mother, back, joy, dead, danced, wife, tears CNMF Anger great, cried, eyes, mother, poor, joy, king, heart, thought, tears
Fear cried, king, happy, good, man, heart, thought, father, boy, mother Joy mother, thought, cried, king, day, great, home, joy, good, child Sadness thought, cried, good, great, looked, mother, man, time, king, heart DIM Anger eyes, fell, heart, tears, cried, good, stood, great, king, thought
[image:8.612.82.526.534.696.2]Fear king, cried, heart, mother, good, thought, looked, man, child, time Joy eyes, man, children, danced, cried, good, time, happy, great, wedding Sadness cried, thought, great, king, good, happy, sat, home, joy, found
the best among categorical approaches to classi-fication. When comparing categorical against dimensional classification, the categorical NMF model and the dimensional model have better performances. Nevertheless, we cannot general-ize inferences on which of these techniques is the best performer because results vary among data-sets. As a future work, we aim at performing a further investigation on this connection in order to identify more effective strategies applicable to a generic dataset. Furthermore, we aim at explor-ing improvements in the methodology, employed in this work, and based on the combination of emotional modeling and empirical methods.
Acknowledgments
This research is partially sponsored by a Norman I. Price Scholarship from the University of Syd-ney.
References
C. O. Alm (2009). Affect in Text and Speech, VDM Verlag Dr. Müller.
S. Aman and S. Szpakowicz (2007). Identifying ex-pressions of emotion in text. Text, Speech and Di-alogue.
M. M. Bradley and P. J. Lang (1999). Affective norms for English words (ANEW): Instruction manual and affective ratings. University of Flori-da: The Center for Research in Psychophysiology. J. Cohen (1960). A coefficient of agreement for
no-minal scales. Educational and psychological mea-surement 20(1): 37-46.
S. D'Mello, A. Graesser, and R. W. Picard (2007). Toward an affect-sensitive AutoTutor. IEEE Intel-ligent Systems 22(4): 53-61.
S. D’Mello, S. Craig, A. Witherspoon, B. Mcdaniel, and A. Graesser (2008). Automatic detection of learner’s affect from conversational cues. User Modeling and User-Adapted Interaction 18(1): 45-80.
P. Ekman (1992). An argument for basic emotions. Cognition & Emotion 6(3): 169-200.
J. L. Fleiss and J. Cohen (1973). The equivalence of weighted kappa and the intraclass correlation. Educational and psychological measurement 33: 613-619.
H. He and E. A. Garcia (2009). Learning from Imba-lanced Data. IEEE Transactions on Knowledge and Data Engineering 21(9): 1263.
T. Hofmann (2001). Unsupervised learning by proba-bilistic latent semantic analysis. Machine Learning 42(1): 177-196.
B. Kort, R. Reilly, and R. W. Picard (2001). An affec-tive model of interplay between emotions and learning: Reengineering educational pedagogy-building a learning companion. IEEE International
Conference on Advanced Learning Technologies, 2001. Proceedings.
T. K. Landauer, P. W. Foltz, and D. Laham (1998). An introduction to latent semantic analysis. Dis-course processes, Citeseer. 25: 259-284.
P. J. Lang (1980). Behavioral treatment and bio-behavioral assessment: Computer applications. Technology in mental health care delivery sys-tems: 119-137.
D. D. Lee and H. S. Seung (1999). Learning the parts of objects by non-negative matrix factorization. Nature 401(6755): 788-791.
P. Penumatsa, M. Ventura, A.C. Graesser, M. Lou-werse, X. Hu, Z. Cai, and D.R. Franceschetti (2006). The Right Threshold Value: What Is the Right Threshold of Cosine Measure When Using Latent Semantic Analysis for Evaluating Student Answers? International Journal on Artificial Intel-ligence Tools, World Scientific Publishing. J. A. Russell (2003). Core affect and the
psychologi-cal construction of emotion. Psychologipsychologi-cal review 110(1): 145-172.
K. R. Scherer and H. G. Wallbott (1994). Evidence for universality and cultural variation of differen-tial emotion response patterning. Journal of Perso-nality and Social Psychology 66: 310-328. C. Strapparava and R. Mihalcea (2007).
Semeval-2007 task 14: Affective text. Proceedings of the 4th International Workshop on Semantic Evalua-tions, Association for Computational Linguistics. C. Strapparava and R. Mihalcea (2008). Learning to
identify emotions in text. SAC '08: Proceedings of the 2008 ACM symposium on Applied computing, Fortaleza, Ceara, Brazil, ACM.
C. Strapparava and A. Valitutti (2004). WordNet-Affect: an affective extension of WordNet. Pro-ceedings of LREC.
R. B. Yates and B. R. Neto (1999). Modern informa-tion retrieval. ACM P.