THE
ECONOMIC & SOCIAL
RESEARCH INSTITUTE
Rural Household Budget
--Feasibility Study
SILE SHEEHY
R. O’CONNOR
THE ECONOMIC AND SOCIAL RESEARCH INSTITUTE COUNCIL i97o- 7I
*G. O’BRIEN, D.LITT., LITT.D.~
President of the Institute and Chairman of the Council.
T. J. BARRINGTON,
Director, Institute of Public Administration. *J. P. BEDDY, D.ECON.SC., LL.D. (H.C.)
Chairman, The Industrial Credit Co. Ltd. R. D. C. BLACK, PH.D.,
Professor, Department of Economies, The O ueen’s University, Belfast. *F. B. CHUBB, M.A.~ D.PHIL.,
Professor, Department of Political Science, Trinity College, Dublin. VERY REV. D. CREOAN, C.M.
President, St. Patrick’s Training College, Drumcondra, Dublin. G. DEAN, M.D., F.R.C.P.
Director, Nledico-Social Research Board.
REV. PETER DEMPSEY, O.F.M.CAP., M.A., PH.D., D.D.,
Professor, Department of Applied Psychology, University College, Cork. *~II. P. FOGARTY, M.A., D.POL.SOO.SO. (Louvain),
Director of tim Institute. N. J. GIBSON, B.SC. (ECON.), PH.D.,
Professor, Department of Economics, The New University of Ulster, Coleraine. *}V. A. I-IONOHAN, M.A.~ F.I.A.,
Sccrctary, Dcpartmcnt of Social Welfare. *I~EV. JAMES KAVANAGH, M.A., S.T.L.,
Professor, Department of Social Science, University College, Dublin. IVOR KENNY~ M.A.~
Director, Irish Management Institute.
T. P. LINEHAN~ B.E., B.SC.~ Director, Central Statistics Office. P. LYNCH~ M.A.j
Chairnmn, Medlco-Soclal Research Board. CHARLES McCARTHY, B.L.~
Chairman, Human Sciences Committee.
*IvI. D. McCARTHY, M.A., PH.D., D.SC., President, University College, Cork. J.J. I%/IcFJLLIGOTT, M.A., LL.D.,
Past President of the Institute. G. A. MEAOHER, B.GOMM., D.P.A.,
Deputy Secretary, Department of Local Government. *J. F. I~[EENAN~ M.A., B.L.,
Professor of Political Economy, University College, Dublin. *C. H. I~URRAY,
Secretary, Department of Finance.
J. C. NAGLE, M.COMM.,
Secretary, Department of Agriculture.
D. NEVIN,
Assistant General Secretary, Irish Congress of Trade Unions.
RmHT REV. MONSmNOR J. NEWMAN, ra.A., D.PH.,
President, St. Patrick’s College, Maynooth. TADHG 0 CEARBHAILL,
Secretary, Department of Labour.
REV. E. F. O’DOHERTY, M.A., B.D., PH.D.,
Professor, Department of Logic and Psychology, University College, Dublin. D. P. O’MAHONY, M.A., PH.D., B.L.,
Professor, Department of Economics, University College, Cork. LABHRAS O~NUALLAIN, D.ECON.SC.,
Professor of Economics, University College, Galway.
*W. J. L. RYAN, I~I.A., PH.D.,
Professor of Political Economy, Trinity College, Dublin
P. G. SHERRY~ M.SC., PH.D.~ Federation of Irish Industries.
T. %VALSH, D.S(].,
Director, An Foras Talfintais.
*T. K. WHITAKER, M.SC. (ECON.), D.EfiON.SC., Governor, Central Bank of Ireland.
*Members of Executive Committee.
Rural Household Budget
ACKNOWLEDGEMENTS ’
The authors wish to acknowledge the contributions made by Mr C. Q.uinn and Miss B. McGennis who were mainly responsible for conducting the field-work in connection with this study and to Misses N. Gannon, K. O’Higgins and T. O’Donoghue who helped out with this work at various times. We also wish to acknowledge the contributions of Mr B. Whelan, Mr T. O’Connell and Mrs K. McGrail who rendered invaluable help in preparing the data for publication.
CONTENTS
Acknowledgements
Preface
Introduction
Methodology
Results of Survey
Conclusions and Suggestions
Summary
Appendix A
Appendix B
2
4
5
6
I7
33
38
42
PREFACE
Rural Household Budget--Feasibility Study
SILE SHEEHY*
R. O’CONNOR
INTRODUCTION
T
HF. consumer price index in Ireland is based on household budgetinquiries carried out in urban areas only. Such an index is very useful for many purposes but it would be desirable to have in addition a rural price index together with an overall index reflecting expenditure patterns in both rural and urban areas. In order to establish the weighting system for such indices, it would be necessary to carry out rural household budget inquiries on a scale not so far attempted in this country. Such surveys could of course be used to obtain information on many facets of rural life other than family expenditure. In particular, they could be used to obtain income data for rural households including information on non-farm income and its sources.In Britain the Family Expenditure Survey,1 which has been in continuous operation since 1957, covers all types of households both urban and rural. It has provided regular data about the earnings of both manual and white-collar workers as well as providing a basis for annual revision of the weighting of the Retail Price Index.
Before a large-scale rural household budget inquiry is carried out, it is desirable to undertake experimental studies to establish methodology and to
XDepartment of Employment and Productivity: Family Expenditure Survey Report, 1957-I 968, HMSO, London, i969.
*Mrs. Sile Sheehy was a Temporary Assistant Research Officer with the Economic and Social Research Institute and Professor R. O’Connor is a Research Professor. This paper has been accepted for publication by the Institute. The authors are responsible for the contents of the paper including the views expressed therein.
6 THE ECONOMIC AND SOCIAL RESEARCH INSTITUTE
isolate the problems which are likely to arise. One such experimental study~ was carried out by one of the authors in I964/65 and yielded valuable informa-tion on the methods to be used and on the difficulties associated with this type of investigation. This study, which was carried out on 275 farm households, obtained information on housing, household amenities and equipment, as well as on shopping habits and expenditure patterns in the households. As each of the farm households included in the survey was drawn from the sample of farms used by An Foras Talfintais in ~fs Farni Management Survey, , data on farm incomes were available from this source. The problem of having to record farm incomes as part of the household budget inquiry did not therefore arise and no information was provided on the difficulties facing an interviewer in collecting this and various other income data as part of such an inquiry. ~:
The present study was undertaken to investigate the methods of obtaining comprehensive income and expenditure information in a single survey from individual rural households. With this objective in mind and taking account of the funds available, it was decided to carry out the investigation on about I oo rural households in different parts of the country. It should be emphasised that a sample of this size while sufficient for testing methodology is not intended to give accurate results and accordingly the results given must be taken as being of an illustrative nature rather than as accurately representing rural income and expenditure levels., ~, ’ : ~/
In this study, the households co-operated in (a) an expenditure survey involving the recording of detailed household accounts for a period of two weeks as weli as giving information on expenditure by interview, .(b) a survey to determine farm income, farmi expenditureand household consumption of own farm produce for one year, ’and (c)an investigation to determine non-farm income from all sources, such as off-farm employment, dividends and pensions from. at.home or abr6ad, social welfare and other benefits, emigrants’ remit-tances, etc: It was anticipatedthat it would be difficult to obtain all this information in one survey.. In particular it was not known i how income recording would affect the survey as a whole; ...
METHODOLOGY
The Sdm Ze
The counties in which the survey was done were arbitrarily selected to represent different types of farming and different social conditions so that the full spectrum of farming conditions could be experienced and any special problems located. The counties and, the conditions they were considered :to represent were as follows:--,
2O’Neill, Sile: "An’Experiment in"Family Farm Expenditure Surveys in Ireland"., Irish Journal of,
RURAL HOUSEHOLD BUDGET--FEASIBILITY STUDY
Cork/Limerick
Meath/Westmeath Wexford ..
Cavan ....
Clare .... West Donegal
West Galway ..
dairying~ and pigs
dry cattle raising
tillage and mixed farming mixed general farming
do.
poor farming/fishing Gaeltacht fishing area, with little farming.
Two adjacent District Electoral Divisions (DEDs) were arbitrarily selected within each of these areas and as far as possible eight holdings were drawn at random from each DED, one being from each of the following eight size groups:*
I
5
IO
I5 30 50
IOO
-- I acre
-- 5 acres
-- I o acres
-- 15 acres
-- 3° acres
-- 5° acres
-- ioo acres
acres and over.
The intention of this exercise was to locate the practical problems that would arise on different sized holdings, the giving of a representative coverage being of secondary importance. The sample was drawn in the Central Statistics Office from the I965 Agricultural Enumeration Books.
A total of 138 households were approached to obtain a final sample of 105 co-operating households. Of the" 33 households which did not co-operate, 17 were unavailable either because of wrong address or vacant dwellings; 4 because of illness; 9 actual refusals and a further 3 households discontinued during the survey.
Because of the method of selection an assumption that the sample is repre-sentative of rural households in the State would be invalid. In preparing for the survey it was felt that there might be considerable difficulty in obtaining information on items of non-farm income such as social welfare payments and emigrants’ remittances. As these payments are likely to occur more frequently in the underdeveloped regions these areas were deliberately over-sampled. Some good farming areas were also selected for comparison but despite this it is considered that on the whole the sample is biassed tpwards the lower income
households.
8 THE ,ECONOMIC AND SOCIAL RESEARCH INSTITUTE
Conduct of the Survey
Fieldwork commenced inDecember 1968 and ontinued until~February 197o.~ Two female interviewers collected the data on household expenditure and non-farm income, iOne male interviewer (farm surveyor) dealt with the farm income by making estimates of it at one visit on very small holdings or by keeping simple accounts on the larger farms in the sample. The problems encountered in obtaining farm incomes are discussed in some detail later under "Farm Income Records".
Each householder was canvassed by letter and this was followed within a week by a visit from one of the interviewers. The purpose of the inquiry was explained at this visit, compiete confidentiality was assured and co-operation was sought from each income recipient present. !f all income recipients were not present an appointment was made for a time when the absent members would be available.
The survey commenced when all income recipients had agreed to co-operate. The subsequent procedure varied.somewhat depending on whether the farm surveyor or female interviewers made the initial contact. If contact was made by the female interviewers details of household composition and annual fixed items of expenditure were obtained immediately, with details of non-farm income being obtained at the second visit. The ¯farm surveyor called Very shortly afterwards to estimate the farm income or where this was not possible to commence the farm recording. If the farm surveyor made the initial contact he estimated the farm income or commenced the recording and explained that the female interviewers would call later to record expenditure and non-farm income. In most cases it was the farm surveyor who called first. All households were visited by him before the end of April I969 but it was the middle of June 1969 before the female interviewers could make theirfirst visitto some households. Seventy-four households completeit farm account books and though all of these households were visited by the farm surveyor for various purposes on at least four occasions quite a number among the seventy-four had so little farming activity that their farm income could have been and indeed was obtained at one visit. Some households were involved in businesses other than farming, e.g. shop, garage, etc. and incomes arising from these businesses were recorded by thefemale interviewers at their second visit to the household.¯
I~URAL HOUSEHOLD BUDGET--FEASIBILITY STUDY
household were in order. In a large-scale survey this scrutiny would be done in the interviewers’ field headquarters and hence it can be taken that in the study it took three weeks to complete the recording of expenditure and non-farm income in i 6 households.
Types of Information Collected
The following types of dater were collected:
I. Information on household members--relationship to head of household, age, etc.
2. Annual fixed expenditure such as rates, rent, etc.
3. Expenditure on items purchased on a day to day basis, e.g. food, cigarettes, cleaning materials, newspapers, etc.
4. Consumption of home-produced food.
5. Irregular large expenses such as household durables, clothing and footwear, house repairs, etc.
6. Regular personal expenditure such as holidays, licences, motor tax and insurance, etc.
7. Details of income and deductions from income.
The definitions used in collecting and classifying this information are given in
Appendix B. ’
Description of Schedules
In the I965-66 Urban Household Budget Inquiry (H.B.I.) carried out by the Central Statistics Office the various income and expenditure data were collected in three questionnaires, copies of which are published in the Report of the Inquiry.s Similar type data on expenditure and non-farm income were collected in the present inquiry but in this case it was found convenient to use six schedules.
The reasons for using the extra schedules might be summarised as follows: i. Somewhat more data on incomes and occupations were collected in this
survey than in the H.B.I.
2. In the present survey data on irregular large expenses were collected every three months and so a separate schedule was required for these items.
3. Shorter schedules tend to give more flexibility to the interviewer than longer ones, i.e. two short schedules can often be fitted into a respon-dent’s timetable more easily than one long one. Also short schedules are not as tiresome to complete as long ones since a break can be taken between them.
IO THE ECONOMIC "AND SOCIAL ~KESEARCH INSTITUTE
In addition tothe expenditure and non-farm income schedules a farm account bookwas used in the present studyto collect informationon farm income and expenditure on the larger holdings while a single page income’ and expenditure "Farm Income Schedule" was used for recording, data on ¯very small holdings.
A list of the schedules used together witha brief description of each is given below, but readers interested in further details may Obtain copies on application
to the ESRI. ’ " ; " ...; ~
The schedules used .were as follows: : .... :
I. Annual Fixed Charges Schedule. ¯
2. Seven Day Schedule. ... : ... ~
3. Irregular Large Expenses Schedule. ... ~. :. 4. Schedule for Recall Visits. ~ , ". "~ ’ 5" Regular Personal Expenditure Schedule. : " ¯ ", ’
6. Personal Income Schedule. ¯ :
7. Farm Account Book andFarm IncOme Schedule" .... ~,
Annual Fixed Charges Schedule ’’ " .... This schedule was completed by or~e of the female interviewers on her first Visit. The following information was obtained from the head of the househ01d.
i. A complete list of household members, as defined in Appendix B, together with details ofsex, age, marital status, whether an income recipient and/or spender, and type of school being attended.
2. Information 0n whether the dwelling was~ owned or rented.
3, Details of annual~ fixedcharges such as rent, rates, water ,Charges, insurance, gas; electricity; telephone
and~ the
pr0Portion.0f these which should be charged as farm or business expenses.Little difficulty was encountered in completing this schedule though the allocation of some expenses between household and farm or business was not always easy..These allocations .were made by the householder after: discussion with the interviewer. -~ - ....
Seven Day Schedule " ....
RURAL HOUSEHOLD BUDGET--FEASIBILITY STUDY I I
item were not feasible for the housewife. (The problems encountered in recording household consumption of own produce are discussed in more detail later).
The households were visited on at least three other occasions during the tWO seven-day periods in connection with other items of expenditure and non-farm income. Checks were made at these visits to see that the seven-day schedules were being kept satisfactorily and any problems that arose were dealt with on these visits. The completed schedules were scrutinised befbre being collected at the end of each of the seven-day periods.
Irregular Large Expenses Schedule
Details of irregular large expenses were collected from each income recipient for the preceding three months at the third visit. The first seven-day schedule was also collected at this visit and the second seven-day schedule was com-menced. Irregular large expenses covered both expenses of a personal and household nature. They included all fuel and power, telephone accounts, house repairs, maintenance and decoration, durable goods (such as gas or electric appliances, cars, furniture and furnishings, etc.), clothing and footwear, etc. Information on durable goods sold or traded in part against a new article was obtained. Goods purchased on hire purchase were also noted so that the proper payments could be offset against the individual items at a later time. All expenses relating to medical, dental and nursing fees in the previous three months were included, such as expenditure on optical goods, medicines got with or without prescriptions, surgical goods, etc. Payments made by cheque or banker’s order for membership fees, etc. were also included. All items of less than i o shillings in value were excluded from tllis schedule.
Schedule for Recall Visits
As the farm surveyor would be visiting a majority of the households in the study throughout the year in connection with the farm accounts, it was decided to have him visit allhouseholds periodically to record annual figures for irregular large expenses such as had been obtained for three months only in the previous questionnaire. Thus every household (whether or not it was keeping a farm account) was visited at three-monthly intervals and details were recorded of expenditure on these items for the Preceding three months. These quarterly visits were also used to record gas, electricity and telephone expenses throughout the year even though payments on the last account received for these items had already been entered in the schedule for annual fixed charges.
Regular Personal Expenditure Schedule
THE ECONOMIC AND SOCIAL RESEARCH INSTITUTE
business purposes were completely excluded, but if an item was used partly for household and pai:tly for farm or business purposes the expense share attributable to the household only was included. This share was estimated by the person in the household most intimately connected with it. Holiday
expenses during the previous year were included together with school and examination fees. Scholarships of any kind were noted and were later included as a component of income. :
hmome Records " " ~ " ¯
Many people are reluctant to disclose their incomes and this fact results in a high rate of non-co-operation in household budget inquiries., For this reason the income data are usually obtained atanearlyvisit ~ind with tliis problem surmounted the inquiry can proceed more smoothly. : :.
N6n-farm income was recorded in this sfirvey by the female interViewers .as soon as all income recipients in the houseliold had agreed to do-operate. This was generally done at the interviewers" seCond’x/isitoth0ugh sometimes it had to be postponed to a subsequent "¢isit, ira respondent Was Unavailabie. The farm income on all holdings Could not, of course, be’0btained: ~/t this time since.in many cases it depended on records extending 0qer- the whole year. However, all’ tlie recording wascommenced at an. earlyvisit:and all the:one visit estimates’ were made at this time also. N0neof the people keeping farm rec0rds dropped out during the year"but if they"had; ;an attempt would have been made .to estimate annum income from the data’Mr~ady collected. ~ " ’ - " :
Personal Income Schedule
Non-farm income was recorded in apersonal income Schedule for’ each: income recipient at the second visit. Details of the main and subsidiary paid occupations of each worker, whether in an agricultural or other occilpation, the number of weeks worked at these occupations and th6 gross earned income during tile previous year (or period of time most suitable for eachperson) were recorded. All deductions from pay in the form:of income tax, social insurance contributions, life assurance, health insurance, pension fund, and trades union subscriptions were also recorded as well as information on bonuses. Every effort was made to distinguish clearly between gross and disposable incomes. Persons retired on pension from past employment were asked tO give details of gross pension, deductions therefrom’, and net pension for the previous twelve months. Similarly all persons were asked to give information on income accruing from interest or dividends over the past year, again distinguishing between net and gross income.
Payments fi’om the State were also recorded. These v(ere classified under the following headings:
I. Children’s allowances.
benefits,:--RURAL HOUSEHOLD BUDGET--FEASIBILITY STUDY 13
3- Old age pension. 4. Widow’s pension.
5. Disability pension. 6. Any other benefits.
As many as possible of these were verified by checking particular characteristics of the household members, e.g. children’s allowances, old age pension, widow’s pension, etc. Information was also collected on income from property and income from part-time work or irregular employment as well as emigrants’
remittances from at home in Ireland or from abroad. Unfortunately, there was no means of cross-checking the latter figures.
There was little difficulty in recording the incomes of wage and salary earners. For self-employed persons such as small shop-keepers, etc., a few of whom were included ill the sample, the recording was more difficult. In these cases, the interviewer had to obtain estimates of sales and purchases of goods, as well as any other expenses for the business in order to arrive at the income figures.
Once people had agreed to co-operate they appeared to be willing to give all the details they could recall of both earned and unearned income. Contrary to what one might expect, they did not seem to be at all wary about giving details of benefits paid by the State or emigrants’ remittances, etc.
Unfortunately the farm incomes did not relate to exactly the same period as the non-farm incomes. The farm incomes related to a year within the period December 1968 to February 197o, while the non-farm incomes related to a year within the period January 1968 to end of June 1969. The seven month period December 1968 to end of June 1969 wascommon to both. This lack of cor-respondence in the income reference period is not entirely satisfactory, particularly if an important objective of the study is to obtain figures for sources and distribution of income. Two methods of overcoming this difficulty might be considered in a large-scale study. The first method would be to spread the survey over two years carrying out the farm and non-farm income surveys the first year and the expenditure survey in the second year. This procedure would not necessarily be much more, expensive ttlan a single year survey as in either case two sets of people would have to be employed for one year only (i.e. one group of male and one group of female interviewers). In the two-year study the male interviewers who would collect all the income data could be dispensed with at the end of the first year, when the female interviewers would take over, whereas in the one-year survey the two groups would be working simultaneously.
The main disadvantage associated wkh this suggestion is that the data collection would be spread over a rather longer period and there would inevitably be a higher rate of fall-out than if the survey were concentrated into a single year.
1,1. THE ECONOMIC AND SOCIAL RESEARCH INSTITUTE
be to retain a one-year survey but to spread the non-farm income collection over the survey year. This could be done in a two-cycle expenditure survey by collecting non-farm income figures at both visits. It could also be done by having the farm surveyors collect non-farm income at their periodic visits to farms throughout the year or by making special visits for this pUrpose.
Farm Income Recording ’ :
One of the main problems in preparing for a rural household budget study is to devise a relatively inexpensive means of estimating farm incomes. Farmers themselves have usually little idea as to their exact annual incomes and there is no point in asking them straight out for such figures. The normal method of estimating farm incomes is by b/ring accounts kept on the farms under review, and to ensure that the accounts are being properly kept thefarms are visited by a trained interviewer on a number of Occasions thicoughoutlthe year. At these visits questions are asked as to the various transactions which took place since the previous visit and the accounts brought up to date in this way. It is quite obvious that this is a rather time-consuming operation and is an expensive method of obtaining farm income data if the number of visits to each farm is frequent.
It is, of course, possible for a well-trained farm surveyor to make reasonably good estimates of farm income on many farms at a single visit but this procedure has its disadvantages also, The time taken to dothe interviewing increases greatly with size of business and on many farms the respondent gets impatient before all the required information is obtained. In such circumstances the surveyor has little option except to hurry over the final details and terminate the interview. Arranging to come back at a later date seldom works well in these cases. After one long gruelling interview the respondent Usually has had enough. Because of this problem, experienced farm surveyors do not care very much for the one visit approach to obtaining farm incomes except on very small businesses. If the business is of any fair size they prefer to paya number of short visits throughout the year and so obtain the required information without any great strain on themselves or the respondents. It is a question therefore of finding the happy mean, where costs are not too high and results are reasonably good. " ’: .... " " : "
Unfortunately’ there are no obj6ctive criteria for determining when the correct balance has been obtained, and the person responsible must play it very much by ear~ Of course a lot depends on the purpose of the survey, If the objective is to obtain information’on expenditure and the income data are onlY required for classification purposes then figures for farm income obtained at one or a few visits would suffice. In:such a case the surveyor could take short cuts on the larger farms so as:to keep the length of interview within bounds, i.e. not more than about one hour or so.
RURAL HOUSEHOLD BUDGET--FEASIBILITY STUDY I5
large farms. The number of visits to be undertaken on these depends on the size of the business. In the Foras Talfintais Farm Management Surveys the interviewers visit the co-operating farms six to eight times a year but at these visits they collect much more farm data than would be required in a rural household budget inquiry.* Hence it can be expected that in the latter case fewer visits would be required.
In the survey under review a well-trained farm surveyor was employed to c611ect the farm income information with the initial objective of ascertaining if reasonable estimates of income could be obtained in a single visit to each holding.
For this purpose two types of income schedule were used. One was a single page "Farm Income Schedule" similar to that shown in Appendix B, and the other was the Farm Account Book used by the Department of Agriculture and Fisheries in connection with the Small Farm (Incentive Bonus) Scheme.J" This is a very small book of I3 pages aimed at obtaining sufficient information to determine figures for output, expenses and income for the whole farm.
The single page schedule was useful only for the very small farm businesses. For the larger business the farm account book was more satisfactory, even for a one-visit estimate. By going through the various pages of the book it was possible in one interview to build up a fair picture of the farm income on many farms. On many others, however, scrutiny of the results revealed that the estimates obtained were not very reliable. It was therefore decided in the interests of accuracy to go over to book-keeping on all except the very small businesses.
At the end of the accounting periods the book results were compared with the available one-visit estimates with rather indifferent results. In some cases the estimates were quite close to the account figures but in others they diverged considerably, particularly on large mixed holdings. It is not possible, however, to draw any firm conclusions from the discrepancies found since the two sets of figures relate to two different years, i.e. the account book results relate to the survey year while the one-visit estimates relate to the previous year. As a result of our experiences, however, we would not be too happy with figures for farm incomes obtained at one visit on medium to large mixed farms. On these holdings two to four visits would be required depending on the size of the business. Only in rare instances should more than four visits be necessary. On small farms on the other hand and on medium to large dairy farms where creamery receipts ’are available, good income figures could be obtained at one visit. In a full-scale inquiry the farm surveyor would have to decide for himself whether he should keep an account book on a holding or do the job in one interview but whoever is in charge of the survey should keep in close
*Personal communication from M. Brannick, Head of Field Services, Rural Economy Division, an Foras Talfintais.
16 THE ECONOMIC AND SOCIAL RESEARCH INSTITUTE
touch in order to see exactly what is happening in the field in this regard, and advise accordingly.
In the final count we had 74 completed farm account books for the IO5 households of which IO were entered up at one visit. All of these had somesales of farm produce, In addition there were a further 18 completed farm income schedules showing that there was some farm income for 92 ’househOlds. The entries on these 18 schedules related almost entirely to household consumption Of own farm produce, only On: four of them were some sales recorded. On :the holdings for which farm accounts were kept, inventories were taken at the first visit but inventories taken after I February 1969 were in all cases dated back to that date so as to prevent the inquiry extending over tOO long a period. This back-dating by as much as three months in some cases presented no great
problems. : ~
Farm transactions were recorded from the date of the opening inventory and were kept up to date on subsequent visits by the surveyor. At the final visit transactions since the previous visit together with end inventories were entered. The accounts were then summarised and the required details extracted. On some of the very small holdings, there was little farm recording to be done at the different visits but since the households were being visited every quarter in connection with the: irregular large expenses, the surveyor usually checked the
f~/rm accounts whenever tie called. :
In all cases the Surveyor retained tile account book himself and made the necessary entries at his visits from data supplied by the ~farmer. In most cases these data were supplied from memory by the farmer but in some cases a record of large transactiollS was kept in a diary. On,two holdings accounts were being kept by the:local agriculturaladvisor. These were made available to the farm ¯ surveyor with the farmers’ permission. The definitions used in obtaining farm
income are given in Appendix B.
Problems Encountered in Estimating House holdConsumption of Own Farm Produce
The problem of weighing and measuring the home produced food presented the usual measurement difficulties. Where no measure for liquids or solids was available, it was,necessary to measure, the cooking and storage utensils which were in daily use; the housewife indicated the amounts normally consumed by the family and these wereweighed or measured. Where the housewife had an existing means of measure either for Solids or liquids, this was checked before recording, began ...
RURAL HOUSEHOLD BUDGET--FEASIBILITY STUDY 17
into account for all items. This was evident from the results of the farm records from which estimates of household consumption of own produce were also obtained.
For some items like milk and potatoes, the grossed I4-day figures were quite close to the farm records. For others, particularly pigs and poultry, the two estimates differed, the farm record figures being somewhat lower than the I4-day figures, except for turkeys.
Though the estimates from the farm accounts were considered more accurate than the I4-day figures, it was decided not to use the farm figures since purchased and home-produced goods are probably competitive consumption items. Thus, if consumption of home produced meats were reduced to the amounts indicated by the farm records, the consumption of purchased meats would have to be increased by some amount to counterbalance this reduction. As it was not possible to define the amount of this adjustment, it was decided to accept the
data as recorded in the 14-day schedules, except in the case of turkeys. In this latter case, the figure on the I4-da~ schedules was understated as the house-holders were not asked to keep records over the Christmas period. The figures for this item from the farm records were used, but no adjustments were made in the consumption of other meats to counteract the inclusion of turkeys.
As stated above the discrepancies between the two estimates of household consumption of own produce were no doubt strongly associated with the period over which the recording extended. They may also be due to a certain extent to the size of the sample. Therefore, with a large sample and I4-day records spread over the year the results would probably be much better. However, for satisfactory results the records for each household should extend over two I4-day periods at six monthly intervals and the records for the total sample should be continuous for a period of at least one year.
RESULTS OF SURVEY
Though the sample of households included in this study is very small and is unrepresentative nevertheless it is felt that the results should be published in some detail for the following reasons:
I. To show by comparison with data from other sources whether or not
I8 THE’ EGONOMIG AND SOGIAL RESEAROH INSTITUT~
2. To show the type of information forthcoming from a survey of this nature so that official authorities candecide if public money shoutdbe spent on obtaining such information in a full-scale inquiry.
3. To give an indication of how data of this kind shOuld bepresented (i.e. the type of tables which might be constructed and the sort of commentary which might be of interest).
4. It is felt that despite their limitations the data are of inferest in their own right and provide a str6ng case for the conduct" of a broadly based inquiry of this nature.
The detailed results of the Survey are set out inTable A. i tO A.7 of Appendix A. To facilitate the presentation two main classifications were adopted namely:
(i) Size of household (number ofpersons) and
(2) Grossweekly income per householc[ ()~). - ... .
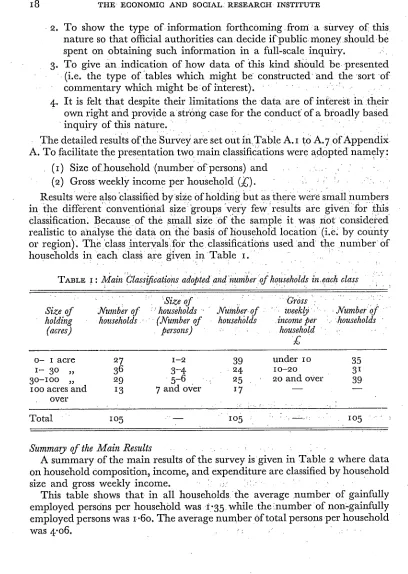
[image:20.510.65.473.48.622.2]Results were also. classified bysize 0f holdirig but as there were small numbers in the different conventional size groups very few results are given for tiffs classification. Because of the small size Of the sample it was not considered realistic to analyse the"data on the basis of household location (i.e: by county or region). The class intervalSf0r the classifications used and the number of households in each class are given in Table 1.
TABLE I : Main Classifications adopted andnumbero3i households in.each class
Size of
Size of Number of- : households holding households (Number of
(acres) persons)
: "
dross ... ...
Number.of " . Weekly - Numberof househblds .income per _ .households
household
£
o- i acre 27 i-2
i- 3° ,, 36 3-4
3O-lOO ,, 29 5-6 .
IOO acres and 13 7 and oxier over
39 under lO 35
-24 io-2o 31
25 ¯ 2o and over 39
17 -- __
Total lO5 - ¯1o5 : :’ ’: .: ’ lO5 ....
Summary of the Main Results .... ~ ~-.
A summary of the main results of the survey is given in Table 2 where data on household composition, income, and expenditure are Classified by household size and gross weekly income. :. :., .~:,- " ~ ¯
RURAL HOUSEtIOLD BUDGeT--FEASIBILITY STUDY 19
TABLE 2: Summary of Household Composition, Income and Expenditure per Household, classified by Size of Household and Gross Weekly Income (a)
Size of Household (Persons) Gross Weekly Income (;~)
Item All
1-2 3-4 5-6 7-t- uuder io lO-2O oo+ Households
Number of Households 39 24 25 17 35 31 39 105
Household Composition (Persons per household)
Gainfully employed 0.82 1.38 1.88 1.76 0"83 1.26 1.90 1"35 Non gainfully employed o.9o I "54 2"2o 2"41 1 "23 1.87 1 "72 1.6o Total 14 years and over I"72 2"92 4"o8 4"I8 2.o6 3.13 3"62 2"95 Total under 14 years o.oo o.5o I’32 4"I8 o.2o o.97 2.o2 1.11 Total persons 1.72 3.42 5.40 8.35 0.06 4.io 5.64 4.06
Household Income (£ per week)
Earned Income (b) "8.06 02. i i 22"54 25"76 3"5° 9.84 36.38 17"58 Unearned income 3"83 3"23 4’87 4"93 4"o5 5.o8 3"42 4"12 Total gross income 1 I’9O 25"34 27"4° 30’69 7"55 14"92 39.80 °I’7° Obligatory deductions 0’23 0.60 0"99 0"64 0"03 o"I9 1"33 0"56 Disposable income I1"67 24"74 26"4I 30"05 . 7’52 14"7I 38"47 21"14 Inventory changes 0.78 --o.31 2.20 3"33 0"45 °"13 2"95 1.28 Balance of income (b) lO’89 25’05 24"21 26"72 7"07 14"58 35"52 19"86
I:Iousehold Expenditure (b) (£ per week)
Food 3"94 6.13 8.31 I i "213"92 6"44 9"29 6.66 Clothing and Footwear o.95 1.93 3.18 6.34 o.99 2.62 3"97 2"58 Fuel and light (b) o.89 1.05 I .o6 1.36 i .o8 o.97 I "43 i .o5 Housing 0"97 0’89 i.o2 o.97 0"50 1.21 i.I9 0.96 All other goods 3.8o 4.29 6.63 6’65 2. i I 4"46 7"79 5.0o
All services 1.81 2.46 3"64 4"36 o’9o 2"36 4"87 2"85 Total expenditure (b) 12.36 i6.7.~ 23.84 30.89 9.5° i8.o6 28.54 19"1o
(a)The figures given in this and in other tables are of being representative of rural conditions generally.
(b)Includes household consumption of own produce.
an illustrative nature and must not be taken as
For all households the average earned income per household per week was ~i7.58. Unearned income was ~4"I2 giving a total gross weekly income of ~21.7o. The obligatory deductions (income tax, social welfare contributions etc.) were ~o’56 per week leaving disposable income at £21"14 per week. If we wish to compare income with expenditure, however, two* further items should, be allowed for, namely, depreciati6n of farm machinery and the value of changes in farm inventories, since these are non-cash items which enter into the estimates of farm expenses and output.
For all households combined it was found that depreciation was almost
THE ECONOMIC AND SOCIAL RESEARCH INSTITUTE
identical with expenditure on farm capital items less capital receipts, hence no adjustment need be made for depreciation. An adjustment has, however, to be made for inventory changes since these are substantial on some of the larger holdings.
For all households the value of inventory increases came to £1.28 per week and when this is deducted from disposable income, giving what we termed the "balance of income", the amount available for spending is £19.86 per week. This compares with the figure of £19. IO per week for total expenditure which is a very close correspondence for figures of this kind. As might be expected, tile correspondence is not nearly so close for thevarious sub-groups, particularly for the 3-4 person households where the balance of income is £25.05 as against an expenditure of£i6.75 per week, and for the £2o and over per week house= holds where balance of income is £35"52 as against expenditure of £28.54. Among the lower income group on the other hand there tends to be dissaving. In the £1o-£2o income group balance of income is £14.58 per week while expenditure is £18.o6 while in the under £IO per week group the figures are £7"07 and £9"50 respectively.
As was pointed out in the evaluation of the results of the urban household budget inquiry4 direct comparison between income and expenditure is mis-leading to a certain extent. In the first place the scope of the income compared with the expenditure definitions employed in all household budget inquiries differs in a number of respects. For example, in this study the definition of household income excludes certain receipts of an irregular and non-recurring nature such as legacies, receipts from the sale of possessions, loans, withdrawals fi’om savings, maturity payments on insurance policies, etc. As these receipts can be used to finance consumer transactions they must account to some
extent for the apparent deficit in the results in the lower income households. On the other hand additions to savings could account for the Surplus in the higher income households. Also the time periods for the incomeand expenditUre figures did not always coincide so that stated income and expenditure figures need not necessarily be the same. In addition, of course, the income of a particular household in a certain year may be temporarily higher or lower than its long run level.
In the 1965/66 urban household budget inquiry, expenditure exceeded income in all households by an average of £2.16 per week as the figures in Table 3 show. Despite this overall deficit, hoWever, income was greater than expenditure in the £40 per week and over income groups, showing that as in the present study the upper income people tend to save and the lower income group to dissave.
More detailed Results
The data in Table 2 are in arather abbreviated form and so give a general
RURAL HOUSEHOLD BUDGET--FEASIBILITY STUDY 2I
TABLE 3 : Summary of Income and expenditure from 1965/66 urban household budget classified by size of income
Item
Gross weekly income (£)
All fiwome Under xo io-2o 2o-3o 3o-4o 40-5o 5o-t- groups
(i) Disposable
house-hold income 5"65 I4"39 22"85 31.78 4o.21 58.93 I9.O6 (2) Total expenditure 7"84 x7"24 25"89 34"6I 39"43 5I’tO 2I’22 (3) Difference (I)--(2) --2.I9 --2.85 --3.04 --2.83 0.78 7"83 --2.I6
outline only of the sample results. Detailed tables are therefore presented in the following sections which give a more comprehensive picture of household composition, income and expenditure patterns in the different households.
Household Composition Age and Marital Status
The number of persons in the sample classified by age and conjugal condi-tion is shown in Table 4. A number of ratios based on the data in this table are given in Table 5, where they are compared with similar ratios for aggregate rural areas* in the 1966 Census of Population.5
As can be seen from Table 4, the total number of persons in all households in the sample was 426. This is an average of 4"o6 persons per household com-pared with 4"o3 in the urban household budget inquiry of I965/66 and with
3"95 in "aggregate rural areas" in the 1966 Census of Population.6
TABLE 4: Number of Persons in households classified by sex, age group and conjugal conditions
Male Female
Age Last Total
Birthd@ Single Married Widowed Total Single Married Widowed Total Persons
o- 4 28 o o 28 15 o o 15 43
5-I3 39, o o 39 34 o o 34 73
I4-I9 27 o o 27 IX o o II 38
2o-29 26 5 o 31 8 9 o 17 48
30-39 I3 7 o 20 2 13 x x6 36
4o-49 5 I5 o 2o 4 I9 3 26 46
50-64 9 25 2 36 4 24 4 32 68
65+ ix 27 6 44 5 I5 xo 3° 74
Total I58 79 8 245 83 80 I8 I8I 426
*The area outside towns of 1,5oo inhabitants or over is classed as belonging to the aggregate rural area.
5Census of Population of Ireland, x 966, Vol. II--Ages and Conjugal Conditions Classified by Areas.
[image:23.510.59.424.422.551.2]THE ECONOMIC AND SOCIAL RESEARCH INSTITUTE
Of the total persons in~ the sample 116 were underi4 years of:age while 74 were 65 years of age and over; The ratio of the sum of these two groups to the remaining persons commonly known as the dependency ratio was 0.8I as shown in Table 5. This ratio is a good deal higher than the corresponding figure of o17i kindly calculated for us in the CSO for aggregate rural areas in the State in 1966. However, it should be pointed out that this difference is, not statistically significant, as can be shown by testing the difference between the proportions of dependents in the sample which is 44.6 per cent and that in the rural population which is 41.5 per cent ... , ,
The number of females per I oo males in the sample was only 74 compared with 89 in the aggregate rural areas in I966. The low female/male ratio is due among other things to the fact that in the sample there was an extraordinarily low number of females in the o-I3 year age groups. Since this cannot be explained by migration or emigration as could such a sex ratio among the over 14 year age groups it must have occurred by chance.
TABLE 5: Average Household Composition, and Other P~pulation Characteristics in Rural
Household Budget Sample (I968/69) compared with those in aggregate rural areas (1966) Aggregate Rural Household Item ~ " rural areas Budget sample
1966 1969
Average number of persons per household 3"95
Dependency ratio (a) 0.7 I
Number of females per lOO males , 89
Single persons 2o years and over as per cent of all members of similar sex in this age group
Males % 45
¯ Females % 25
4.06 o.81
74
4°
19
(a) Persons under 14 years of age plus those 65 years of age and over as a proportion
of the remaining population.
Of the females in the age group 20 years and over 19 per cent were single while of the males in the same age group 42 per cent were single. These proportions compared with figures of 25 per cent and 45 per cent respectively for the same categories in the aggregate rural areas in 1966.
Occupations of Household Members
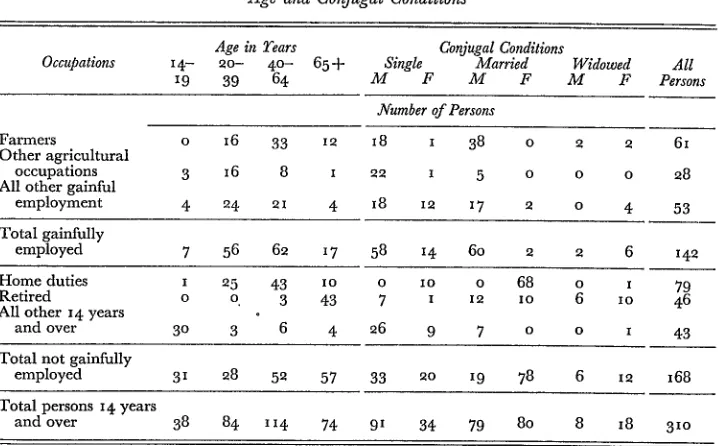
The number of household members in each occupational group 14 years and over classified by age and conjugal condition is given in Table 6.
RURAL HOUSEHOLD BUDGET--FEASIBILITY STUDY 23
TABLE 6: Household Members (male and female) in each Occupational Group Classified by Age and Conjugal Conditions
Age in Tears Conjugal Conditions
Occupations 14- 20- 4°- 65+ Single Married Widowed All
19 39 64 M F M F M F Persons Number of Persons
Farmers o 16 33 12 i8 i 38 o 2 2 6i
Other agricultural
occupations 3 16 8 i 22 I 5 o o o 28
All other gainful
employment 4 24 21 4 I g 12 17 2 o 4 53
Total gainfully
employed 7 56 62 ~7 58 14 6o 2 2 6 i42
Home duties 1 25 43 io o io o 68 o i 79
Retired o o 3 43 7 I 12 I o 6 I o 46
All other 14 years
and over 3o 3 6 4 26 9 7 o o I 43
Total not gainfully
employed 3I 28 52 57 33 20 19 78 6 12 I68
Total persons 14 years
and over 38 84 114 74 91 34 79 8o 8 I8 3io
Of the 168 people in the sample not gainfully employed, 79 were engaged in home duties, 46 were retired and the remaining 43 were returned as others. The latter were mainly students. Of the 6I farmers in the sample 33 were between 4° and 64 years and 12 were 65 years of age and over. Thirty-eight of the farmers were married and 4 (2 males and 2 females) were widowed. The number of household members in each occupational group classified by size of holding, size of household and gross weekly income is given Table A. I of Appendix A.
Details of Income Income Sources
Figures for average weekly income per household from different sources classified by size of household and gross weekly income are given in Table A.2. Because of the nature of the sample, however, it must not be assumed that this income pattern is representative of rural households generally.
THE ECONOMIC AND "sOCIAL RESEARCH INSTITUTE’
and dividends were, about 4:percent, while emigrafits’ remittances were less than 2 per cent. In summary, therefore, for all households in the sample earned income accounted for about four-fifths~ of total gross income while unearned income accounted for almost one-fifth. Of course, this proportion varied very much as between different classes of household.
The first section of Table 7, where households are classified by size of holding, shows that on the 1-3o acre holdings gross income was divided fairly equally between agriculture, other gainful employment and unearned, income.’ On these small holdings 28 per cent of the gross income came from state ,benefits, the main constituent of this item being old age and widow’s pensions and children’s allowances. The state benefits included here do not include any of the items of "state expenditure in relation to agriculture" which are published annually in the Budget tables and which amounted to about £9° million in 1969-7o.~ The appropriate items of the latter expenditure are included in:the figures for income from agricultural occupations.o On the very large holdings agriculture contributed over 80 per cent to total income while unearned income accounted for less than 4 per cent. About 16 per cent of the income on these farms came from gainful employment other than agriculture. On the 3o-Ioo acre holdings, on the other hand, agriculture provided only two-thirds of the gross income; ~ "
The second section of Table 7, where incomes are classified by size Of household shows that in the very small households unearned .income was about one-third of total income, the major Portion of this inc0me being state benefits. : ... ~ .
TABL~ 7: Pei’centage contribution of certain income sources to total .gross income in different,
classes of household, ’ , , , : ,:
Size of holding (acres) ia) .’
hwome Sources
1-3o 3O-lOO I oo and over
Earned income from: per cent
Agricultural occupations 31.I -63"7 8o’3 Other gainful employment 32"3 ’23"o i6.i
Total earned income 63.5 86.8 96.4
Unearned income from:
Interest, dividends, pensions from employment 6.2 o.8 1.2 Social welfare and other State benefits (b) 28.1 lO.8 1.6 Emigrants’ remittances and othei- unearned 2.1 1.5 o.8
Total Unearned income ~ 36-4 13’1 3-6
Total gross income ioo-- IOO.-
RURAL HOUSEHOLD BUDGET--FEASIBILITY STUDY 25
Earned income from:
Agricultural occupations Other gainful employment
¯ Size of household (Persons)
I-3 3-4 5-6 7 and over
per cent
5o.o 55"o 4o.6 43.8 17’8 32’2 41"7 4o’1
Total earned income 67’8 87’2 82"3 83"9
Unearned income from:
Interests, dividends, pensions from employment 9.0 I .o 6.2 1.4 Social welfare and other State benefits (b) 20.3 I I.O lO.6 lO.7 Emigrants’ remittances and other unearned 2"9 o.8 o’9 1.9
Total unearned income 32"2 12.8 17.7 16.o
Total gross income i oo.- i oo.- i oo.- I
oo.-Gross weekly income (£)
Earned income from:
Agricultural occupations Other gainful employment
o-Io IO-2O
All 20 and
House-over holds per cent
34"2 39"0 52"0 47"1 12.2 26.9 38.3 33"9
Total earned income 46.4 66.0 90.3 8I .o
Unearned income from:
Interest, dividends, pensions from employment 7"4 6"4 3"3 4"3 Social welfare, and other State benefits (b) 41"7 24"3 6-o 13.2 Emigrants’ remittances and other unearned 4"4 3"2 o’4 1.5
Total unearned income 53’5 33’9 9"7 19"o
Total gross income i oo.- i oo.- i oo.- I oo
.-(a) Holdings ofo-i acre excluded from the classification by size of holding but are included in the other classifications.
(b) Other State benefits do not include State expenditure in relation to agriculture as published in the Budget tables. Appropriate items of this latter expenditure are included in arriving at income from agricultural occupations.
06 TI-IE ECONOMIC AND SOCIAL RESEARCH INSTITUTE
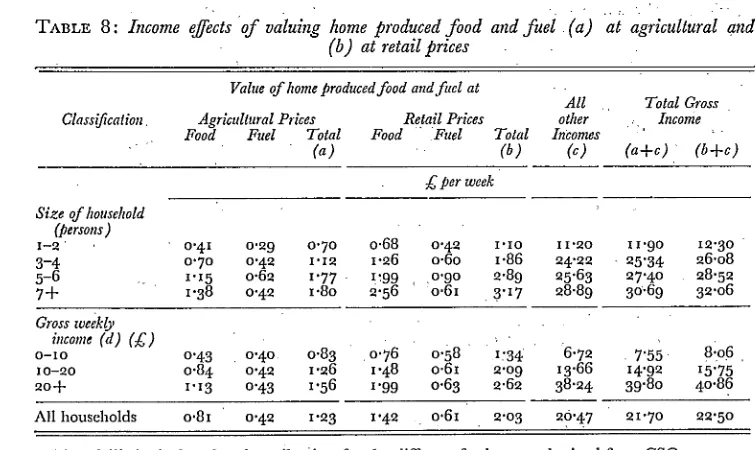
Home consumed food and fi~el valued at retail prices
It might be argued that for measuring rural incomes, unsold food and fiael consumed in the homes should be valued at retail prices and that if this were done the average incomes would be much higher. The results after such a valuation are given in Table 8.
As can be seen from this table the valuation of food arid fuel at retail prices did not affect the income situation substantially pardcul~/rly in the smaller sized and lower income households. In the I-2 person households and in the households having less than-£1o per week gross income, the valuation of food and fuel at retail prices increased average income by only about £o.5r, per week. In other households ’it increased incomes somewhatmore but in’ in0 case was the average increase more than £i.40 per week. For ali households the average increase was about £o.8o per week.
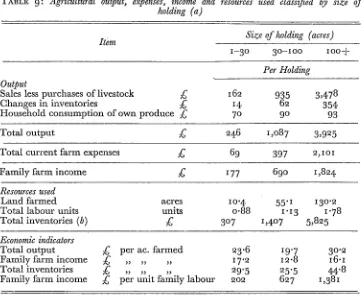
Details of agricultural output, expenses and resources on sample farms
Though the figures for farm output and income are not representative of farms generally, nevertheless it is felt that such figures should be giver/in a paper of this kind, so as to complete the picture of the sample used. Figures for output, expenses and income classified by size of holding are given in
[image:28.508.75.453.336.561.2]Table A.3 while details of resources used per holding and certain economic indicators for the different sized holdings are given in this table also. The more important results from this table are summarised in Table 9 opposite.,
TABLE 8: Income effects of valuing home produced food and fuel (a) at agricultural and
(b) at retail flrices
Value of home produced food and fitel at
All Total Gross Classification, Agricultural Prices Retail Prices other , Income
flood Fuel Total Food Fuel Total Incomes ~ ~ (a) (b) (c) (a+c) (b+c)
£ per week Size of household
(persons)
x-2’ ’ o.4i 0.o9 0.70 3-4 0"7° 0"42 1.12 5-6 1"15 o.6o 1.77
7+ 1.38 0.4o 1.8o
0.68 0.42 1.~6 0.60 1;99 0’9° 6.56 o.6x
I "IO I I "20 I 1.9o io.3o 1"86 °4"2° - 25"34 26.08 2,89 °5"63 27"4o 28"52 ¯ 3.17 28"89 30"69 32"06
Gross weekly iucon,e (d) (£)
0"76 o.58 ’ 6"72 7"55 8:o6
o-xo o’43 o’4o o’83 I:34
io-r,o o.84 o.42 1.26 1.48 o’61 o’o9 x3"66 14"9° 15"75 oo+ 1.13 o.43 1.56 1.99 o.63 2.6o 38.o4 39"8o 4o’86 All bouselmlds o.81 o’42 1"23 1’42 o.61 2"o3 o9"47 2I’7o 22"5o
(a) and (b) Agricultural and retail pi:ices for file different foods were obtained from CSO. (c) Income not including the value of home produced fuel and food.
RURAL HOUSEHOLD BUDGET--FEASIBILITY STUDY
Table 9 shows that in the 1-3o acre group, output per holding was about £246. Total current expenses were £69 leaving a family farm income of£i 77. On the 3O-lOO acre holdings total output per holding was £1,o87, total current expenses were £397 leaving a family farm income of £690. On the large holdings, on the other hand, total output per holding was £3,925, of which
£354 was for increased inventories. Some of the inventory rises were due to increased prices but they were mainly due to extra stock numbers particularly cattle. Total current expenses on the over IOO acre holdings were £2,ioi leaving a family farm income of £1,824.
[image:29.510.60.421.266.561.2]The average area of land farmed per holding on the 1-3o acre holdings was lO.4: acres, on the 3O-lOO acre holdings 55.1 acres and on the ioo acre and over holdings 13o.2 acres. An average of less than one labour unit was employed on the 1-3o acre holdings; somewhat more than one unit was employed on the 3O-lOO acre holdings while on the i oo and over acre holdings
TABLE 9: Agricultural output, expenses, income and resources used classified by size of
holding (a)
Size of holding (acres)
I-3O 3o-Ioo
IOO-l-Output
Sales less purchases of livestock £ Changes in inventories £ Household consumption of own produce £
Per Holding
~62 935 3,478
~4 62 354
7° 9° 93
Total output £ 246 I,o87 3,925
Total current farm expenses £ 69 397 2, i o I
Family farm income £ 177 69o 1,824
Resources used
Land farmed acres I o"4 55" I 13o.2
Total labour units units o.88 I.I3 1.78
Total inventories (b) £ 3o7 1,4o7 5,825
Economic indicators
Total output Family farm income Total inventories Family farm income
£ per ac. farmed 23.6 I9.7 30.2
£ ,, ,, ,, I7.2 I2-8 I6.I
£ , ... 29’5 25"5 44"8 £ per unit family labour 2o2 627 1,38I
(a) Because of the nature of the sample the results for the different size groups must not be taken as being nationally representative.
THE ]ECONOMIC AND SOCIAL RES]EARCH INSTITUT]E
a little less than two units were employed of which about half a unit was hired. The average value of investment in livestock, machinery and crops was £307, on the I-3o acre holdings, £i,4o7 on the 3o-Ioo acre holdings and £5,825 on those I OO acres and over. On the latter holdings the total investment in livestock, machinery and crops per acre was £45 of which £34 was for live-stock and £IO for machinery.
The total output per acre farmed was about £24 on the I-3o acre holdings, £20 on the 3O-lOO acre holdings and £3° on the IOO and over acre holdings. The output figure of£3o per acre on the ioo acre holdings compared with£2o on the 3O-lOO acre farms is unusual as it is normal for output per acre to decrease with increased farmsize. The results of the 1955-59 FarmSurveys showed that for all regions and all systems of farming the small farms tended to have higher outputs per acre than the, larger ones. However, the more recent Farm Management Surveys by An Foras Talfintais,O’ 10 do not follow this pattern entirely as the figures in Table IO show.
TABLE IO: Output per acre on different sized holdings in all regions and for all systems of faming, I955-59, 1966-67 and 1967-68
Farm Management Surveys Size Group Farm Survey
acres 1955-58 1966-67 1967-68
Output per adjusted acre (£)
5- 3° 20"7 I9"6 23"9
3°- 5° 20’5 21.8 25"2
5O-lOO 20.0 22.7 26.9
oo-2oo 18.4 20.5 25"0
2oo -t- acres i5.6 18.9 2i.o
As can be seen from this table the per acre outputs in 1966=67 and i967~68 are higher on the 30-5° and 5o-Ioo holdings than on the 5-3° acre groups, indicating a change in the output pattern by farm size over the years. This trend however does not progress into the over Ioo acre groups where the per acre outputs are lower than those on the smaller holdings. The high output per acre figures obtained on the large holdings in the present study do not therefore appear to be very typical. As it turned out, most of the large farms included in the survey had high stock and cropping rates and appeared, to be farmed rather efficiently. There is no doubt but that they are’ much better than average.
~National Farm Survey I955[56-1957/58 Final Report comPiled by cSO. Pr. 618o Stationery Office, " Dublin, August i96x.
[image:30.508.80.439.262.417.2]RURAL HOUSEHOLD BUDGET--FEASIBILITY STUDY 29
Expenditure Patterns Total Expenditure
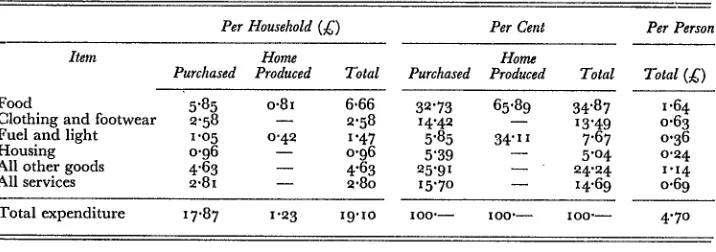
[image:31.512.61.419.200.326.2]The average values of goods and services consumed in different households in the sample on a per household and per person basis classified in different ways are shown in Table A.5. The goods entered include both purchased and home produced items the latter valued at agricultural prices. A summary of these results for all households combined is given in Table i I below.
TABLE I I : Average weekly value of goods and services used in all households
Per Household (£) Per Cent Per Person
Item Home Home
Purchased Produced Total Purchased Produced Total Total (~, )
Food ¯ 5"85 o’81 6.66 32’73 65’89 34"87 x .64 Clothing and footwear 2-58 -- 2"58 I4"42 -- I3’49 0"63 Fuel and light i .o5 o.42 1.47 5"85 34" 11 7.67 o.36
Housing o’96 -- o’96 5"39 -- 5"o4 o’24
All other goods 4.63 -- 4.63 25.91 -- 24.24 i.i4
All services 2.8I -- 2.8o I5.7o -- i4.69 o.69
Total expenditure 17"87 I’23 19.Io xoo.-- Ioo.-- xoo--- 4.7°
This table shows that of the total value of £19. I per week for goods and services ~i7.9 was spent on purchased items, the value of home produced food and fuel being about £I "2 per week. The total value of goods and services used per person was ~4"7 per week of which about ~I.6 went for food. Of the money spent on purchased items about third went for food, one-seventh for clothing and footwear, about one-tenth for fuel, light and housing, one-quarter for all other goods and about one-sixth for all services.
In order to see if the pattern of expenditure of this inquiry appears realistic, some of the percentage figures from Table A.4 are given in Table I~ along with similar figures from the 1965-66 Household Budget Inquiry and from the 1964-65 Foras Talfintais Study. This table shows that the figures from the study under review appear fairly realistic particularly when the purchased items are compared with tlle CSO results.
3o THE ECONOMIC AND ,SOCIAL RESEARCHINSTITUTE
TABLE 12: Proporlional conlribulion of different ilems to total expend{lure
from different surveys , ¯
Ilenl
¯ (a) ¯
¯ eSO (b) ,: Fr (4
i968-69 i965-66 - i964±65
Purchased Total, ::Total Small Towns* Purchased
Food
Clothing and footwear Fuel and light
Housing All other goods All services
Per Gent
32"33 34"87 3I"55 33"9° 35"52 I4"42 I3"49 9"IO , IO~25 I3"93 5"85 7"67 5"29 6.I i I 1.33 5"39 5"04 8’09 5"09 --25"91 24"24 27"98 28.96 i9.67 i5.7o I4.69 i7.99 I5.68 I9.55
Total IOO’-- IOO’-- IOO’-- IOO’-- , : IOO~-- ~
(a) Present study: ~,
(b) CSO Household Budgetiriquiry, I965-66. , (c) An Foras Talfintais farm-family expenditure study, I964-65.
*Towns with less than 1,5oo inhabitants;
Expenditure on Food
RURAL HOUSEHOLD BUDGET--FEASIBILITY STUDY 31
national estimates and tile others since the pork equivalent of sausages and cooked meats is included ill tile national figures while it is not ill the others.
One further general point regarding comparability should be noted also. As the national estimates of consumption per person are obtained by dividing total national consumption by the indigenous population (tourists being omitted) tile resulting figures are not strictly comparable with those from household budget inquiries. The degree of non-comparability will telld to vary for different items depending on tourists’ preferences but ill general because of the method of calculation tile national figures for all items should tend to be higher than those for comparable items from a full scale, representa-tive national household budget inquiry.
[image:33.510.62.423.282.512.2]Table 13 shows that for practically all items tile figures for consumption per person from tile 1965-66 HBI are lower than tile national estimates for comparable items. They are also lower than the ESRI figures for all items except beef, veal and other meats. Because the consumption figures from the
TABLE 13 " Comparison of figures for certain items o f food consi, mption from different sources
Item Unit of Quantity
ESRI Central Statistics Offce Household National
1968-69 Budget estimates
I965-66 for I968ix Per person per year
Fresh milk (a) gallon 40.7 33"3 45"7
Butter lb. 32"2 30.2 29" I
Cheese lb 4"7 4.o 4"7
Eggs No. 313 196 23°
Beef and veal lb. 18.2 24"1 39"3
Mutton and lamb ,, 27"o 17.8 23.8
Pig meat (b) ,, 56.7 38.7 56.3
Poultry ,, lO’4 -- 2o.2
Other meats (c) ,, 13-o 22.2
--Total meat ,, 125"3 i o2.8 139.6
Potatoes ,, 339 25° 312
Tea ,, 9"4 8.8
--Sugar ,, 69 "2 58. 7 59" I
(a) Includes the milk equivalent of cream.
(b) The figures given for pig meat are for pork equivalent and are obtained by multiplying those for rashers, bacon and ham by I "33.
(c) Includes sausages, black and white puddings, cooked meats, liver and other edible offals, together with poultry meat in the case of the 1965-66 HBI figure. Where actual quantity figures were not available the amounts were estimated from the values of the items concerned.
THE ECONOMIC AND SOCIAL RESEARCH INSTITUTE
HBI (which relate to town :househOlds) are lower than the national averages for comparable items we would expect that the I ESR1 estimates for rural households should be higher than the national figures, This is not always the case, however, but when account is taken of the tourist effect mentioned above the ESRI figures look reasonably realistic. , ¯
: ¯ ,. ¯
Expenditure on non-food items
Figures" for the average weekly expendkure per household on non-food items classified by size Of household and gross Weekly income are given in Table A.7. As can be seen from this table the total expenditureonnon-fo0d items varied from £8. I per household in the small sized households to£i 9"3 in the largest size group, the average for all households being £12.o per week. In die households with less than £io per week gross income the average expendi-ture on non-food items was £5.2 per week whilein the £20 and Over households it was £I8"8 per week.
Further reference to Table A.7 shows that for practically all the classifications listed expenditure per household increased with household size and average household income. Actually there was no expenditure at all, on children’s clothing or on education in the 1-2 person households reflecting the absence of children in these households.
[image:34.510.86.455.346.598.2]A summary of the actual and percentage expenditure per household on non-food items for all households is given inTable 14. Thistable shows that
TABLE 14 : Actual and percentage weekly expenditure per household and per person on purchased
non-food items
Actual ....
Per Per Per Item Household Person Cent ¯ ¯
£
Clothing and footwear .... Fuel and light
Housing
Tobacco and cigarettes Alcoholic drinks
Household durables and semi-durables Transport and vehicles
Miscellaneous goods
Holiday expenses and entertainment Medical expenses ¯ Insurance andpension contributions Education, training and personal services All other expenditure
2 "58 i .05 0.96 1"21 0"55 0.62 i "57 0.68 0.55 : 0-65 ~ 0.41
0’34 ~ :~ 0,86 0.63 0.26 0"24 0"30 0.13 o’I5 0"39 o.i7 o.13 o’16 ,, O’IO 0.08
0"Ol ¯ ’
Total expenditure 2"96
21 "43 ’8.69 ,
: 8"0~ IO.O5 ," . ,