Munich Personal RePEc Archive
Determinants of natural gas demand in
Ghana
Ackah, Ishmael
University of Portsmouth, UK
26 September 2014
Online at
https://mpra.ub.uni-muenchen.de/59214/
Determinants of natural gas demand
in Ghana
Ishmael Ackah
PhD Student, Department of Economics, Portsmouth Business School, University of Portsmouth, Winston Churchill Avenue PO1 2UP, UK. Email: ackish85@yahoo.com
Abstract
The study investigates the effect of economic and non-economic factors on natural gas demand in Ghana at the aggregate and disaggregates levels. The structural time series model is employed as it has the ability of capturing exogenous non-economic factors. The findings suggest that both eco-nomic and non-ecoeco-nomic factors influence natural gas demand. It further reveal that different sectors respond differently to these factors. The study recommends that policies such as natural gas price subsidies should be customised for different sectors to obtain optimal results.
1. Background
Due to supply security and environmental concerns, global natural gas demand is increas-ing at a rate above average primary energy demand (Ruester and Neumann, 2008). The increase in global natural gas consumption has been attributed to many factors. Firstly, gas is cleaner than coal to burn and cheaper than petroleum. For instance, natural gas pos-sesses some attractive characteristics like the limited carbon emissions, operational flexi-bility and efficiency (Akkurtet al., 2010). Moreover, natural gas is the cleanest and most hydrogen-rich of all the hydrocarbon energy sources, and it has high energy conversion efficiencies for power generation (Economides and Wood, 2009).
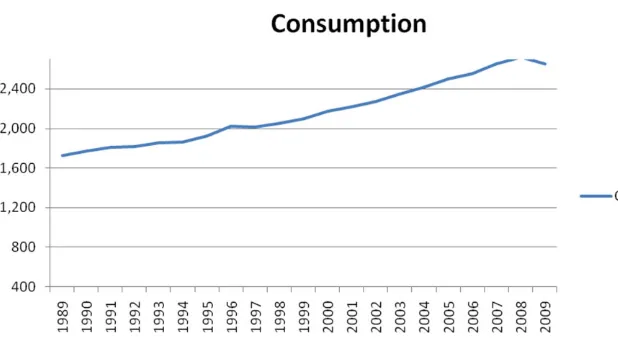
Figure 1 shows that, global consumption of natural gas has increased from 1729 million tons of oil equivalent to 2653 million tons of oil equivalent (BP, 2010).
The global demand for natural gas is in the process of dramatic changes, such as the globalisation of the gas market (Huntington, 2009), rising shares of LNG trade and spot contracts (IEA, 2008) and the increase in the in the prospect of unconventional gas supply. The increase in the demand may be driven by many other factors. In Bangladesh, the Gov-ernment is encouraging the use of compressed natural gas as a transportation fuel (Wadud
et al., 2011). In other cases, the demand has been due to advances in technology such as the use of gas fired combined cycle gas turbine power plants for electricity generation.
Natural gas consumption has grown substantially in recent years in Africa, stimulated by increased economic activity, large investments in new infrastructure and domestic price
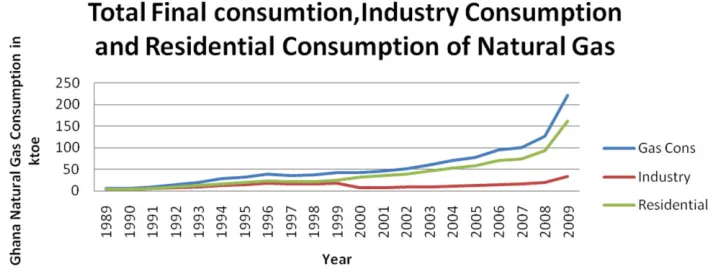
subsidies (Eggohet al., 2011). Ghana uses natural gas mainly as a fuel for cooking, trans-port and industry (Kemausuoret al., 2011). Ghana’s forest cover has dwindled from 8.13 million hectares at the beginning of the last century to 1.6 million hectares today (Ghana Energy Commission, 2010). According to the UN Food and Agriculture Organization 2009, the rate of deforestation in Ghana is 3 per cent per year. In order to solve the defor-estation problem, the government of Ghana launched a National LPG programme in 1990 to encourage the use of LPG as an alternative to charcoal and firewood for cooking to reduce deforestation and help to achieve the climate change goal of the Government (UNDP, 2004). The policy among other things supported natural gas consumption through price subsidies that encouraged households to buy. Again, the opening of the natural gas and cylinder distribution and retail markets to the private sector helped industry and households in rural areas especially to have access to gas. Finally, the use of gas in power production especially by the Asogli power plant boosted natural gas consumption. This policy led to an exponential increase in the demand for natural gas.Figure 2shows that, the total final consumption of natural gas in Ghana was 6 Ktoe in 1989. However, the final natural gas consumption in 2009 was 221 Ktoe. This has been driven by both residential demand and industry demand. For instance, natural gas consumption in Ghana’s industry sector has increased by 52.6 per cent per annum from 1989 to 2009. Figure 2 shows the natural gas demand at the aggregate level, residential sector and the industrial sector of Ghana between 1989 and 2009.
[image:3.431.41.350.73.247.2]For regions such as sub-Saharan Africa, the investments necessary to produce the required increase in all forms of commercial energy are major compared with traditional
gross capital formation in society and net capital inflows (De Vitaet al., 2006). Over-investments in energy infrastructure and Over-investments made long before they are needed, represent costly drains on scarce resources under-investments, or investments made too late, can also carry significant economic costs. With a significant potential for energy demand growth in the developing world, but an equally great uncertainty over the time and magnitude of this growth, providing information that may decrease this uncertainty should prove valuable to policy makers. Therefore, the knowledge of current demand patterns, the factors that affect demand and future possible trend demand will be a valuable asset for both planning and for investment decisions such as production, refinery and storage (Abdel-Aal, 2008).
Although, as far as is known, there is no study on gas demand and forecasting in Ghana, efforts have been made to model the demand for other sources of energy especially electricity. Previous attempts have been made to model aggregate electricity demand and investigate the long-run equilibrium relationship and short-run causal relationship between electricity consumption and economic growth in Ghana (Adom, 2011). Again, existing energy studies in Ghana concentrate only on the aggregate level or a specific sector and not both aggregate and the sectors. In addition, the overwhelming majority of studies that have tested for geographical-based differences in elasticities have found that consumers in different regions respond differently to changes in the determinants of natural gas demand (Dagher, 2012).This means that, elasticities of natural gas studies in other developing countries cannot be used as a proxy in Ghana.
[image:4.431.37.393.80.214.2]Recently, Ghana started commercial oil production. The government has been explor-ing how the associated gas discovered with the oil will be developed and commercialised. Because these decisions require huge investments, knowledge of the natural gas market
will help the natural gas policy design. The purpose of this study is to examine the effect of economic and non-economic factors to natural gas demand in Ghana. In addition, the Structural Time Series Model (STSM) and the Underlying Energy Demand Trend (UEDT), which have the advantage to capture the changes in ‘taste’, energy saving techni-cal progress and efficiency (Huntet al., 2003) have not been applied to energy studies in Ghana. In addition, due to long lead time and large amount of money needed to build natural gas facilities, identifying the factors that influence demand will be an added advantage.
2. Literature review
The oil price hikes of the 1970s and 1980s led to an increase in the number of energy demand studies, a trend that has been to some extent revitalised by the emergence of worries about the emissions of greenhouse gases from the combustion of fossil fuels. In addition, environmental concerns and concerns about possibility of oil peaking have intensified studies on natural gas demand. Therefore, various studies of natural gas demand have been undertaken using various estimation methods and have obtained dif-ferent elasticities. The purpose of this section is to evaluate the methods that have been used to estimate natural gas demand and assess the application of econometric models to energy studies in Ghana. The Literature Review is divided into three sections. These are: studies on natural gas demand at the national, regional or global level, natural gas demand at the residential level, and industry level, and energy studies in Ghana. The focus of the literature is narrowed to studies based on the economic concept of natural gas demand instead of the technical qualities of natural gas such as transportation and storage.
2.1. Natural gas demand at the national level
STSM to estimate both the short-run and long-run price and income elasticities for natural gas demand in Ghana.
Estrada and Fugleberg (1989) adopted a model based on translog functions to investi-gate the price responsiveness of natural gas demand for West Germany and France and found estimated price elasticities varying between −0.75 and −0.82 for West Germany and from −0.61 to −0.76 for France. However, Blackorby et al. (1977), suggests that the translog does not provide a good approximation of a wide range of observations and are inflexible in providing second-order approximation. To overcome these weaknesses, Lu
et al. (1979) suggest that the sample size is increased when using the translog functions. Again, an economic variable such as income was not considered in their study. This study considers the effect of income on natural gas demand in addition to price over a period of 20 years and included variables such as income, final household expenditure and industry variable added in addition to gas price to assess their impact on natural gas demand in Ghana.
Eltony (1996) explores the structure of the demand for natural gas in Kuwait using two econometric models: Partial Adjustment Model (PAM) and Error Correction Model (ECM). The results from PAM indicated that demand for natural gas is inelastic with respect to both price and income for both the short and long run. Based upon ECM, the estimates of short- and long-run price elasticities are −0.17 and −0.34, respectively, indi-cating an inelastic demand. The income elasticity of demand for ECM model is 0.45 in the short run and 0.82 in the long run, suggesting that the response of natural gas consumption to changes in income is higher in the long run than short run.
Most of the above studies have concentrated on the developed economies. In order to estimate natural gas demand from a developing economy, Wadudet al. (2011) develops a dynamic econometric model to understand the natural gas demand in Bangladesh, in the national level, the power and the industrial sectors. The demand model shows large long-run income elasticity around 1.5 for aggregate demand for natural gas but a short-long-run income elasticity of 0.33. Forecasts into the future also show a larger demand in the future than predicted by various national and multilateral organisations. Price response was sta-tistically not different from zero, indicating that prices are possibly too low and that there is a large suppressed demand for natural gas in the country. For the power sector, the short-run income elasticity is 0.58, whereas the long-short-run income elasticity is 6.3. The estimated short and long-run income elasticities for the industrial sector is 0.76 and 1.76, respec-tively.Table 1shows a summary of natural gas demand elasticities.
2.2. Residential and industry natural gas demand
The pioneering work of Houthakker (1951) on the British urban electricity consumption perhaps initiated the econometric investigation of residential energy demand in a formal way. Since then, and as with other applications, a wide variety of applications of the econometric approach to the residential sector has appeared in the literature. According to Bohi and Zimmerman (1984) and Madlener (1996), more studies have been done on this sector than any other area. Balestra and Nerlove (1966) pool annual data from 1950 to 1962 for 36 states to estimate a dynamic model of residential natural gas demand as a function of real natural gas prices, real per capita income and total population. The results indicate that time-invariant regional effects account for roughly 75 per cent of the total residual variance for residential natural gas demand, with the estimated long-run price and income elasticities of −0.63 and 0.62, respectively. However, this study did not consider the effect of energy-saving technical efficiency or the effect of other exog-enous variables on natural gas demand. Such an omission may lead to misleading price and income elasticities.
Grady (1986) utilises pooled data from 1968 to 1978 for all 50 US states, grouped into five categories based on natural gas availability, to estimate residential natural gas demand using an error component model. The results indicate that only own price and heating degree days are statistically significant, whereas prices for electricity and fuel oil, income and the ratio of households using natural gas relative to total households are statistically insignificant. Moreover, Grady reports the average short-run and long-run own-price elasticity estimates across the five categories of states as −0.1 and −0.4, respectively.
[image:7.431.40.397.92.187.2]Linet al. (1987) examines the demand for residential natural gas for the four US census regions and the nine sub-census regions over the 1960–1983 period. Within a reduced-form dynamic model of residential natural gas demand, Linet al. employ the
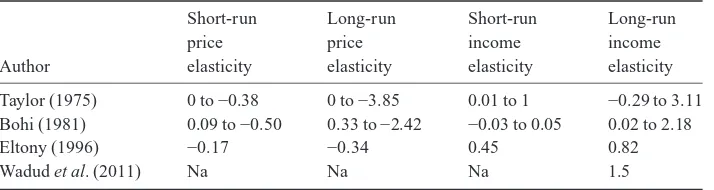
Table 1 Summary of natural gas studies at the National level
Author
Short-run price elasticity
Long-run price elasticity
Short-run income elasticity
Long-run income elasticity
Taylor (1975) 0 to −0.38 0 to −3.85 0.01 to 1 −0.29 to 3.11 Bohi (1981) 0.09 to −0.50 0.33 to −2.42 −0.03 to 0.05 0.02 to 2.18
Eltony (1996) −0.17 −0.34 0.45 0.82
Wadudet al. (2011) Na Na Na 1.5
error components seemingly unrelated regression procedure to find that, based on the average elasticity estimates across regions, the own-price elasticity estimate is −0.15 in the short run and −1.215 in the long run. The average income elasticity estimate is 0.11 in the short run and 0.57 in the long run. Furthermore, he found that the respective own price, income and cross price elasticity estimates and adjustment speeds to the desired level of residential natural gas consumption vary across regions.
Payneet al. (2011) estimates the demand for residential natural gas in the state of Illinois using an autoregressive distributed lag (ARDL) bounds testing approach based on annual data from 1970 to 2007. The ARDL bounds testing approach reveals a long-run equilibrium relationship between natural gas consumption per capita and real residential natural gas prices, real personal disposable income per capita, real residential electricity prices, real fuel oil prices and heating degree days. The short-run own-price elasticity is −0.26, whereas the short-run elasticity for heating degree is 0.63. In the long-run residen-tial natural gas consumption is price inelastic, as a 1 per cent increase in real residenresiden-tial natural gas prices decreases residential natural gas consumption by 0.264 per cent. A 1 per cent increase in real residential electricity prices increases residential natural gas consumption by 0.123 per cent, whereas a 1 per cent increase in heating degree days increases residential natural gas consumption by 0.626 per cent. The results from the cor-responding ECM indicate that only real residential natural gas prices and heating degree days are statistically significant. While the long-run elasticity estimates are larger than the short-run elasticity estimates, both the short-run and long-run elasticity estimates are less than one in absolute terms.
In conclusion, the above summary of residential and industrial natural gas demand studies suggest that there are varied elasticities of natural gas demand. In addition, efforts have not been made to capture energy-saving efficiency or the effect of other exogenous on natural gas demand studies in the residential and industrial sector. This studies attempts to model the effect of price, income, household final expenditure industrial value added (IVA) and ‘exogenous factors’ on the natural gas demand in Ghana.
2.3. Energy demand in Ghana and sub-Saharan Africa
There are few econometric studies on energy demand in Ghana. Most these studies are limited to the causality between electricity demand or energy demand and income.
1988 in Ghana and South Africa. The demand for energy in Ghana and South Africa is income inelastic in the long run. This may be due to the introduction of Structural Adjustment Programme in Ghana and the preparation of South Africa for their inde-pendence that were characterised by industrialisation and urbanisation. Furthermore, causality tests suggest bidirectional causality between energy consumption and real GDP in Cote d’Ivoire and unidirectional causality running from real GDP to energy usage in the case of Congo and Ghana. This study does not consider the effect of other economic factors. In addition, the finding is ambiguous as it is not known whether the cointegration between energy consumption and economic growth is in the short run, long run or both.
[image:9.431.39.402.414.531.2]Adom (2011) estimates the electricity-economic growth nexus in Ghana and its impli-cations for energy conservation measures and environmental policy. The Toda and Yomamoto Granger Causality test is used to carry out the test of causality between electricity consumption and economic growth from 1971 to 2008. The results obtained revealed that there exists a unidirectional causality running from economic growth to electricity consumption. Thus, data on Ghana support the growth-led-energy hypothesis. These findings differ from Esso’s (2010) findings that suggest that economic growth has negative effect on energy consumption in Ghana after 1988. The differences may be due to the nature of data, estimation method and the time frame for the estimation. The results on the energy studies on Ghana are therefore not conclusive. Therefore, this study uses the STSM to assess the effect of income and other economic factors on natural gas demand in Ghana.Table 2shows the summary of findings on the relationship energy consumption and growth in Ghana and Africa.
Table 2 Summary of energy studies on Ghana and Sub-Saharan Africa
Author Period Country Method
Causality Relationship
Adom (2011) 1971–2008 Ghana Toda and Yomamoto Granger Causality test
Y→EC
Twerefoet al. (2008)
1975–2006 Ghana Vector error correction model granger causality
Y→EC
Wolde-Rufael (2006)
1971–2001 Algeria, Congo, Egypt, Ghana, Ivory coast
Toda and Yomamoto granger causality test
Y→EC
Table 2 shows summary of selected studies on energy demand in Ghana and sub-Saharan Africa. Notes: →,↔and ---- represent, respectively, unidirectional causality, bidirectional causality and no causality.
To sum up, the findings on energy studies in Ghana have been varied. While some part of the literature indicates appositive relationship between economic growth and energy consumption, other parts of the literature reports otherwise. One thing though runs through all the literature. That is, both price and income have some effect on energy con-sumption. It has also been found that urbanisation and industry value added have signifi-cant effect on energy consumption both in the short and long run.
Most of the studies on natural gas demand occurred in the developed economy. Again, most of the elasticities reported for these studies were less than unitary.
However, a study conducted by Wadud et al. (2011) on Bangladesh gas demand
reported higher elasticities. This indicates a higher responsiveness of natural gas to changes in price and income in developing countries that developed. In addition, all the studies failed to capture the effect of exogenous factors on natural gas demand. This could be one of the reasons for the differences in the elasticities. Moreover, most of the estimation methods used in earlier studies such as the OLS have proven to be inadequate in recent times.
3. The model
Hunt et al. (2003) argues that energy-saving technical progress and a range of other exogenous factors (distinct from income and price) can have potential impact on energy demand. These factors include environmental pressures and regulations; energy effi-ciency standards; substitution of labour, capital or raw materials for energy inputs; and general changes in tastes that could lead to a moreor less energy intensive situation. Hence there is a need for a broader concept to capture not only energy saving technical progress in an energy demand function but also other unobservable factors that might produce energy efficiency. The concept of the UEDT is therefore used as, arguably, it acts as a proxy, not only for energy saving technical progress and improved energy effi-ciency, but also for the change in the ‘tastes’ outlined above (Huntet al., 2003). The STSM developed by Harvey (1989 and 1997, for example) allows for the UEDT to be modelled in a stochastic fashion hence it may vary over time (both positively and nega-tively) if supported by the data and is therefore a particularly useful and convenient tool in these circumstances. The UEDT/STSM has been found to be a superior approach to one that uses a deterministic trend to try and capture technical progress and moreover the elasticity estimates and the shapes of the UEDTs are robust to different lengths and frequencies of data (Dimitropouloset al., 2005).
Chapter three provides an overview of how the STSM/UEDT is used to model natural gas demand in the residential, industrial and aggregate level for Ghana.
here is to overcome some of the shortcomings of previous studies by attempting to identify key structural changes in natural gas demand in Ghana by using the UEDT and STSM.
Natural gas consumption results from demand for energy services such as cooking, heating and industrial production. In other words, it is a derived demand; hence, the factors that influence these services play an important role in the demand for natural gas. In indus-try and households alike, natural gas is used as an input into a productive process. That is, be it an industrial process or to produce heat in homes and the ‘production function’ is largely determined by the level and nature of the capital appliance stock. Hence the demand for natural gas is equally influenced by both the quantity and quality or efficiency of the capital and appliance stock. It is therefore important to reflect this in any estimated natural gas function.
Additionally, Hunt et al. (2003) argues that that technical progress is not the only exogenous factor that influences energy demand. Therefore, factors such as consumer tastes, change in regulations, change in economic structure, change in lifestyles and values might all play an important role in driving natural gas demand. In the absence of appropriate data to capture all the different exogenous effects, a stochastic UEDT is included in the natural gas demand specification estimated in line with recent research (Harvey and Koopman, 1993; Hunt and Ninomiya, 2003; Huntet al., 2003). To achieve this, the STSM is utilised, given that it allows for the impact of unobserved components in a time series model to be a captured by a stochastic trend (Harvey, 1989).
The STSM decomposes time series into explanatory variables, a stochastic trend and an irregular component. As additional observations are included, the parameters and unob-served components of the model are estimated by using recursive filtering smoothing process (Kalman, 1960) and maximum likelihood.
A framework similar to the methodology of Dilaver and Hunt (2011) is used to esti-mate natural gas demand in Ghana. Three models are estiesti-mated for the industrial, residen-tial and whole economy.
3.1. The model for aggregate natural gas demand
GN= f YN PN POP UEDTN
(
, , ,)
(1)Where
GNis the total gas demand of Ghana
PNis the real natural gas prices of Ghana
POPis the population of Ghana
UEDTNis the Underlying Energy Demand Trend for Aggregate Natural Gas Demand in Ghana.
3.2. Model for industrial demand
GI= f YI PI POP IVA UEDTI
(
, , , ,)
(2) WhereGIis the industry gas demand of Ghana
YIis the income/GPD per capita of Ghana
PIis the real natural gas prices of Ghana
POPis the population of Ghana
IVAis industry’s contribution to Ghana’s GDP
UEDTIis the Underlying Energy Demand Trend for Industrial Natural Gas Demand.
3.3. Model for residential demand
GR= f YR PR POP HE UEDTR
(
, , , ,)
(3) WhereGRis the residential gas demand of Ghana
YRis the income/GPD per capita of Ghana
POPis the total population of Ghana
PRis the real natural gas prices of Ghana
HEis the ratio of total final household expenditure to GDP of Ghana
UEDTRis the Underlying Energy Demand Trend for Residential Natural Gas Demand in Ghana.
From equations (1), (2) and (3), a general dynamic autoregressive distributed lag specification is estimated as follows:
A L ent
( )
=B L yn( )
t+C L pn( )
t+D L pop UEDTn( )
+ t+εt (4)Whereε is the irregular component of the schocastic trend,A(L)=is the polynomial lag operator 1 –λ1L–λ2L2–λ3L3–λ4L4, B(L) is the polynomial lag operator
1+ α1L+ α2L2+ α
3L3+ α
4L4
andC(L) is the polynomial lag operator defined as
1+ φ1L+ φ2L2+ φ3L3+ φ4L4,D(L) is a polynomial lag operator defined as
1+ δ1L+ δ2L2+ δ
3L3+ δ
4L4
, E(L) is polynomial lag operator defined as 1+ θ1L+ θ2L2+ θ3L3+ θ4L4.
In order to estimate elasticities, the following mathematical functions are performed on the polynomial lag operators at the aggregate level.
LetAL= δand BL=Φˆ,CL=Ψˆ,A(L)= δ
ˆ
ˆ ˆ ˆ
Φ
1−δ1−δ2+δ3+δ4 =the long-run income elasticity of aggregate gas demand ˆ
ˆ ˆ ˆ
Ψ
1−δ1−δ2+δ3+δ4 =the long-run price elasticity of aggregate gas demand
For the industrial sector, LetsK(L)= δ,M(L)= λ,N(L)= ρ,K(L)= δandO(L)= ζ
λ δ δ δ δ
1−ˆ1+ 2+ 3+ 4 =the long-run income elasticity
ρ δ δ δ δ
1−ˆ1+ 2+ 3+ 4 =the long-run price elasticity
ζ δ δ δ δ
1−ˆ1+ 2+ 3+ 4 =long-run elasticity of the industry value added.
For the residential sector, letV(L)= θ,W(L)= γ,U(L)= δandX(L)= α
γ δ δ δ δ
1−ˆ1+ 2+ 3+ 4 =long-run price elasticity for the residential sector
θ δ δ δ δ
1− 1+ 2+ 3+ 4 =long-run income elasticity for the residential sector
α δ δ δ δ
1−ˆ1+ 2+ 3+ 4 =long-run elasticity of final household expenditure
3.4. The UEDT
The UEDT is stochastic and can be estimated by the STSM.
βt=βt− +1 ε εt: t~ND
( )
0μt is the level whileβt is the slope of the UEDT.
ŋt andεt are mutually uncorrelated with zero means and variancesδˆε2andδˆ 2,
respec-tively. The disturbance termsŋt andμt determine the shape of the stochastic trend
compo-nent. The UEDT can be formulated as:
UEDT=µt+irregular intervention+level intervention slope in+ ttervention.
According to Dilaver and Hunt (2011), the purpose of including the slope and/or level interventions is to ensure that normality of the auxiliary residuals is maintained. In addi-tion, the interventions provide useful information about the model. The equations are to be estimated by maximum likelihood and Kalman filter. Insignificant variables are elimi-nated and interventions added to maintain the normality of the residuals and to ensure appropriate diagnostic test are passed to obtain the preferred model.
3.5. Data
Annual data from 1989 to 2009 on aggregate, residential and industrial natural gas demand was obtained from the IEA. Data on GDP, household final expenditure (HE) and IVA in current international prices were obtained from the World Bank. Data on Ghana’s population was obtained from the World Bank. Real natural gas prices were obtained from the Ghana Petroleum Authority.
4. Estimated results
The STSM is employed to examine the behaviour of the UEDT. Three models were esti-mated for aggregate, residential and industrial natural gas demand in Ghana. All the models were estimated using four lags. The various trend components of the STSM such as local trend model, smooth trend mode, and a local level model with drift and local trend model without drift were examined to select a suitable model for the study. Dummy vari-ables are introduced in 2000 and 1993 for the aggregate and in 2000 for the Industry natural gas demand and 1993, 1999 and 2000 for the residential natural gas demand. This is due to the large outliers found in the residuals graphics for the selected periods. In addi-tion, the use of the dummy variables improved the normality and the serial correlation test for the study. The preferred model is selected based on the statistical criteria as suggested by Huntet al. (2003) such as goodness of fit, prediction error variance, serial correlation and normality test. The results of the preferred model are shown in the Tables below.
4.1. The estimated results and test for national natural gas demand in Ghana
4.2. Long-run price elasticity aggregate for natural gas demand
ˆ ˆ
ˆ ˆ
ε
δ δ δ
pn LR=
− − + Ψ
1 1 2 3
ˆ .
.
εpnLR=
− −
0 35680 1 0 80330
ˆ .
εpnLR= −1 81
4.3. Long-run income elasticity for aggregate natural gas demand
ˆ ˆ ˆ ˆ ˆ
ˆ ˆ
ε
δ δ δ
yn
LR= + + +
− − + Φ1 Φ2 Φ3 Φ4
1 1 2 3
ˆ .
.
εyn LR=
−
0 38369 1 0 80330
ˆ .
εynLR=1 95
[image:15.431.41.391.92.227.2]The results suggest that all coefficient including the irregular intervention are signifi-cant at 5 per cent. The model passed all the standard diagnostic test such as residual graphic test, auxiliary residual test and the predictive test as shown inTable 3. There was no indication of heteroskedasticity, serial correlation or non-normality. The short-run income elasticity is 0.38. This means, a 1 per cent increase in income leads to
Table 3 Estimated coefficients of explanatory variables at the aggregate level
Variable Coefficient t-Value [P-value]
ynt-1 0.38369 6.41620 [0.00002]
pn −0.35680 −4.13061 [0.00118]
ent-1 0.80330 15.29489 [0.00000]
Irr 2000 −1.06046 −11.70150 [0.00000]
Slp1993 −0.15658 −2.71364 [0.01773]
Component Estimate q ratio Irregular 0.00643804 (1.000)
Level 0.000000 (0.0000)
0.38 per cent increase in natural gas demand at the national level. The short run price elas-ticity is −0.36.It means that a 1 per cent increase in price leads to a decrease of 0.36 per cent in natural gas demand in Ghana. The long-run elasticity estimates are higher than the short-run elasticity estimates as natural gas consumers have the opportunity to adjust appliance stock and their demand in the long run. The estimated long-run income elasticity is 1.95. This is similar to long-run elasticities reported in natural gas demand lit-erature in both developing and developed countries. For instance Taylor (1975) finds long-run income elasticity to be between −0.29 and 3.11 and long-long-run price elasticity to be from 0 to −3.85, whereas Wadudet al., (2011) finds long-run income elasticity to be 1.5. In rela-tion to electricity demand in Ghana, Adom (2011) finds long run income elasticity of 1.6.
Figure 3shows the UEDT for the aggregate natural gas demand. The shape that esti-mated UEDT shows a decrease and increase over the estimation period. This UEDT would appear to reflect the occasional natural gas shortage in Ghana. Because natural gas short-age seems to follow a predictable trend in Ghana, consumers have learned to plan their demand to suit the irregular supply. An irregular intervention in 2000 and slope interven-tions in 1993 were required in order to maintain the normality of residuals and auxiliary
epc-Level+Reg+Intv
1990 1995 2000 2005 2010 2015 2020 2025
0.4 0.6 0.8 1.0 1.2
1.4 UEDT NATIONAL
epc-Level+Reg+Intv
residuals. The interventions appear to reflect the impact of natural gas shortage on the behaviour of consumers. Natural gas demand usage ‘behaviour’ and energy intensity increased from 1989 to 1995 as shown by the upward slope of the UEDT curve over this period. It started decreasing in 1996, which is an election year. Then, there is sharp decrease from 1998 until it reached the lowest point in 2000, another election year indicat-ing a decreasindicat-ing in energy intensity. Between 2001 and 2009, natural gas usage behaviour and energy intensity have been increasing with some dynamic trends. There was a slight decrease in 2004 and 2008. This probably reflects the way consumers adjust their behav-iour to natural gas shortages especially during election years. However, the shape of the UEDT is different to the shape of the estimated UEDT of Hunt et al. (2003) and Dimitropouloset al. (2005).
4.4 Residential natural gas demand in Ghana
Sample 1989–2009 Dependent variable: er
4.5. Long-run price elasticity of the residential sector
ˆ
ˆ
ε γ
δ
prLR=
−
1 1
ˆ .
.
εpr LR= −
−
0 47411 1 0 094438
ˆ .
[image:17.431.48.393.317.448.2]εprLR= −0 52
Table 4 Estimated Coefficients of explanatory variables at the residential level
Variable Coefficient t-Value [P-value]
yr 0.47548 7.50370 [0.00001]
pr −0.47411 −6.48570 [0.00005]
ert-1 0.094438 17.29969 [0.00000]
het_1 1.35499 2.33504 [0.03952]
Outlier 2000(1) −0.97877 −9.52511 [0.00000] Level break 1999(1) 0.15216 1.82006 0.09604] Slope break 1993(1 −0.17949 −4.11626 [0.00171]
Level 0.70880
4.6. Long-run income elasticity of the residential sector
ˆ
ˆ
ε θ
δ
yrLR=
−
1 1
ˆ .
.
εyrLR=
−
0 47548 1 0 094438
ˆ .
εyr LR=
0 53
4.7. Long-run elasticity of household final expenditure
ˆ ˆ ε α δ he LR= − 1 1 ˆ . . εhe LR= − 1 35499 1 0 094438
ˆ .
εheLR=1 50
This study finds a short-run residential income elasticity of 0.48 as reported inTable 4. This means that residential demand is more responsive to income changes than the national natural gas demand. A 1 per cent increase in income leads to 0.48 per cent increase in natural gas demand in the residential sector.The short-run price elasticity is −0.47 per cent. This implies that a 1 per cent increase in price leads to 0.47 per cent decrease in energy demand. Residential demand is more price elastic than the national natural gas demand.The short-run elasticity of the ratio of final household expenditure to the GDP (he) is 1.4 per cent. The model passed all standard diagnostic tests, and no sign of non-normality, auto-correlation was observed. All estimated variables were significant at 5 per cent confi-dence level except the level break in 1999, which was significant at 10 per cent level. The estimated long-run income elasticity is 0.53. This on a lower side compared with Balestra and Nerlove (1966) and Linet al. (1987), who found long-run income elasticity for residen-tial natural gas demand to be 0.62 and 0.57, respectively. These higher figures may be due to the failure of these studies to capture the UEDT. The long-run price elasticity is −0.52. However, the long-run elasticity for household final expenditure is 1.50. This means that, in the residential sector, changes in final household expenditure has more effect on natural gas demand than changes in income and price in the long run.
gas created by ‘artificial shortages’. It could be due consumers’ preference for charcoal as a cooking fuel and periodic unavailability of natural gas. The UEDT is non-linear and shows a decreasing and a decreasing with some irregular trend.
4.8. Industrial gas demand in Ghana
Long-run price elasticity of industrial sector
ˆ
ˆ
ε ρ
δ
pi LR=
−
1 1
ˆ .
.
εpiLR=
− −
0 41022 1 0 93411
ˆ .
εpiLR= −6 23
epc-Level+Reg+Intv
1990 1995 2000 2005 2010
-1.50 -1.25 -1.00 -0.75 -0.50 -0.25 0.00
[image:19.431.43.393.61.330.2]0.25 epc-Level+Reg+Intv
Long-run income elasticity of the industrial sector ˆ ˆ ε λ δ yi LR= − 1 1 ˆ . .
εyiLR=
−
0 25470 1 0 93411
ˆ .
εyi LR=
3 7
Long-run elasticity of industry value added
ˆ
ˆ
ε ζ
δ
ivaLR=
−
1 1
ˆ .
.
εiva LR= −
−
0 45257 1 0 93411
ˆ .
εiva LR= −
6 87
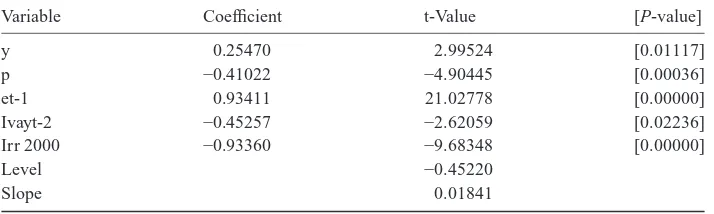
[image:20.431.39.396.93.200.2]The variables passed all diagnostic tests, and no non-normality, heteroskedasticity and serial correlation was observed. Table 5 shows the elasticities of the industrial sector of Ghana. The short-run income elasticity is 0.25. This is lower than both the resi-dential and national elasticities. This may be due to the fixed nature of natural gas appli-ance used in the industrial sector. A 1 per cent change in income leads to 0.25 per cent increase in natural gas demand in the industrial sector. The short-run price elasticity is −0.41 indicating that an increase in price by 1 per cent will lead to a fall in natural demand by 0.41 per cent. It is also observed that an increase in industrial output reduces natural gas consumption of the preceding 2 years. This may be due to efficiency improvement or technological advancement. The short-run elasticity for IVA was −0.45.
Table 5 Estimated coefficients of explanatory variables at the industrial level
Variable Coefficient t-Value [P-value]
y 0.25470 2.99524 [0.01117]
p −0.41022 −4.90445 [0.00036]
et-1 0.93411 21.02778 [0.00000]
Ivayt-2 −0.45257 −2.62059 [0.02236]
Irr 2000 −0.93360 −9.68348 [0.00000]
Level −0.45220
The long-run income and price elasticity is 3.7 and −6.3, respectively. This may be due to the high substitutability between natural gas and electricity in the industrial sector. The long-run income elasticity for IVA is –6.87. Because natural gas supply fluctuate in Ghana, an increase of 1 per cent in industrial output will lead to a decrease of 6.87 per cent in natural gas demand. Industry may demand more of electricity, which has a reliable supply to sustain the increase in output.
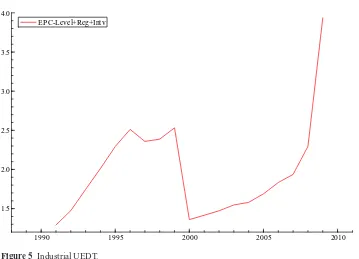
Figure 5shows the UEDT for the industrial sector of Ghana. The shape of the UEDT is similar to the UEDT of Ghana’s residential sector. The UEDT follows an irregular trend. The trend may be due to initial efforts by the Government to encourage domestic con-sumption of natural gas more than the industrial usage and high substitutability of natural gas and electricity in the industrial sector. It may also reflect the occasional natural gas shortage in Ghana.
5. Conclusion
5.1. Summary of findings
Due to environmental concerns and energy security, natural gas has become the fuel of choice. It has therefore become one of the fastest consuming fuels in the world.
EPC-Level+Reg+Intv
1990 1995 2000 2005 2010
1.5 2.0 2.5 3.0 3.5 4.0
EPC-Level+Reg+Intv
In Ghana, the Government launched a natural gas consumption programme to encour-age the use of natural gas in the residential areas to prevent reliance on charcoal for cooking. In addition to this, associated natural gas was discovered in Ghana in 2008. Efforts are been made by the Government to build gas infrastructure and estab-lish the local natural gas market. Knowledge of the demand of natural gas will serve as a valuable asset for planning and execution of national natural gas project and programmes.
The purpose of the study is to model and forecast natural gas demand in Ghana. Different models are estimated for the aggregate, industrial and residential. The STSM is used for the estimation. This is due the ability of the STSM to capture the UEDT and relative advantage to capture energy-saving technical change and structural breaks.
The estimated short-run price elasticity for the aggregate natural gas demand is −0.36, whereas the short-run income elasticity is 0.38. The long-run price and income elasticities are −1.81 and 1.95, respectively. The short-run elasticities for the residential sector are −0.47 for price and 0.48 for income. The income elasticity is relatively lower for the indus-trial sector than for the aggregate and residential sectors. For the residential sector, the long-run price elasticity is −0.52, wherease the long-run income elasticity is 0.53. The long-run elasticity for final household consumption is 1.50.
The short-run price elasticity for the industrial sector was −0.41 while the short-run income elasticity is 0.25 while the short-run elasticity for industry value added is −0.45. The long-run price and income elasticities are −6. 23 and 3.7, respectively. The long-run elasticity for industry value added is −6.87.
The UEDT for the aggregate, residential and industrial sector shows stochastic but increasing and decreasing periods. However, there is a significant structural change in 2000 for all the three sectors. This might reflect energy conservation programmes embarked by the Energy Commission. It may also be due to the general shortage of natural gas on the domestic market and the fall of cocoa prices on the international market that affect Ghana’s exchange rate.
5.2. Policy implications and recommendations
These findings have policy implications for Ghana. The government already provides subsidy to encourage natural gas consumption. However, the study has revealed that income changes induce more response in industrial sector than in the residential sector. Again, there is high response in the residential to changes in price than the industrial sector. These findings suggest policies such as subsidy can be made separately for the resi-dential and industrial sector instead of a uniform national gas subsidy as they respond to gas price and income changes differently. In addition, industrial output and household final expenditure were found to have significant effect on natural gas consumption. These variables are therefore recommended to be included in future energy demand studies in Ghana.
References
Abdel-Aal, R.E., 2008. Univariate modeling and forecasting of monthly energy demand time series using abductive and neural networks.Computers & Industrial Engineering54, 4, 903–917.
Adom, P.K., 2011. Electricity consumption-economic growth nexus: the Ghanaian case.
International Journal of Energy Economics and Policy1, 1, 18–31.
Akkurt, M., Demirel, O.F. and Zaim, S., 2010. Forecasting Turkey’s natural gas consumption by using time series methods.European Journal of Economic and Political Studies3, 2, 1–21.
Balestra, P. and Nerlove, M., 1966. Pooling cross section and time series data in the estimation of a dynamic model: the demand for natural gas.Econometrica34, 585–612.
Blackorby, C., Primont, D. and Russell, R.R., 1977. On testing separability restrictions with flexible functional forms.Journal of Economic5, 195–209.
Bohi, D.R., 1981. Analyzing Demand Behavior: A Study of Energy Elasticities. Published for Resources for the Future by Johns Hopkins Press, Baltimore, MD.
Bohi, D.R. and Zimmerman, M.B., 1984. An update on econometric studies of energy demand behavior.Annual Review of Energy9, 1, 105–154.
BP, Statistical Review of World Energy June 2010 (London: 2010).
Dagher, L., 2012. Natural gas demand at the utility level: an application of dynamic elasticities.
Energy Economics34, 4, 961–969.
De Vita, G., Endresen, K. and Hunt, I.C., 2006. An empirical analysis of energy demand in Namibia.Energy Policy34, 3447–3463.
Dilaver, Z. and Hunt, L.C., 2011. Industrial electricity demand for Turkey: a structural time series analysis.Energy Economics33, 3, 426–436.
Dimitropoulos, J., Hunt, L.C. and Judge, G., 2005. Estimating underlying energy demand trends using UK annual data.Applied Economics Letters12, 239–244.
Eggoh, J.C., Bangaké, C. and Rault, C., 2011. Energy consumption and economic growth revisited in African countries.Energy Policy39, 11, 7408–7421.
Eltony, M.N., 1996. Demand for natural gas in Kuwait: an empirical analysis using two econometric models.International Journal of Energy Research20, 957–963. Energy Commission, 2010.Draft Bioenergy Policy of Ghana Accra. Energy Commission,
Ghana.
Esso, L.J., 2010. Threshold cointegration and causality relationship between energy use and growth in seven African countries.Energy Economics32, 1383–1391.
Estrada, J. and Fugleberg, O., 1989. Price elasticities of natural gas demand in France and West Germany.The Energy Journal10, 3, 77–90.
Grady, S.T., 1986. Regional demand for natural gas in the residential sector.Review of Regional Studies16, 19–28.
Gregory, A.W. and Hansen, B.E., 1996. Practitioners corner: tests for cointegration in models with regime and trend shifts.Oxford bulletin of Economics and Statistics58, 555–560.
Harvey, A.C., 1989.Forecasting, Structural Time Series Models and Kalman Filter. Cambridge University Press, Cambridge, UK.
Harvey, A.C., 1997. Trends cycles and autoregression.Economic Journal107, 192–201.
Harvey, A., and Koopman, S.J., 1993. Structural time series models.Encyclopedia of Biostatistics. Houthakker, H.S., 1951. Some calculations of electricity consumption in Great Britain.Journal of
the Royal Statistical Society Series A114, 359–371.
Hunt, L.C., Judge, G. and Ninomiya, Y., 2003. Underlying trends and seasonality in UK energy demand: a sectoral analysis.Energy Economics25, 93–118.
Hunt, L.C. and Ninomiya, Y., 2003. Unravelling trends and seasonality: a structural time series analysis of transport oil demand in the UK and Japan.The Energy Journal24, 63–96.
Huntington, H.G., 2009. Natural gas across country borders: an introduction and overview.The Energy Journal30, Special Issue, 1–8.
IEA, 2008.World Energy Outlook 2008. OECD/IEA, Paris.
Kalman, R.E., 1960. A new approach to linear filtering and prediction problems.Journal of basic Engineering82, 1, 35–45.
Kemausuor, F., Obeng, G.Y., Brew-Hammond, A. and Duker, A., 2011. A review of trends, policies and plans for increasing energy access in Ghana.Renewable and Sustainable Energy Reviews15, 9, 5143–5154.
Lin, W.T., Chen, Y.H. and Chatov, R., 1987. The demand for natural gas, electricity and heating oil in the United States.Resources and Energy9, 233–258.
Liu, B.-C., 1983. Natural gas price elasticities: variations by region and by sector in the USA.
Energy Economics5, 195–201.
Lu, Y.C., Philip, C. and LeRoy, Q., 1979. Prospects for productivity growth in US agriculture. US Department of Agriculture, Bureau of Economics, Statistics, and Cooperative Service. Agricultural economic report 435.
Payne, J.E., Loomi, D. and Wilson, R., 2011. Residential natural gas demand in Illinois: evidence from the ARDL bounds testing approach.Journal of Regional Analysis and Policy41, 2, 138–147.
Ruester, S. and Neumann, A., 2008. The prospects for liquefied natural gas development in the US.
Energy Policy36, 8, 3160–3168.
Taylor, L.D., 1975. The demand for electricity: a survey.The Bell Journal of Economics6, 74–110. Twerefo, D.K., Akoena, S.K.K., Egyir-Tettey, F.K. and Mawutor, G., 2008. Energy consumption
and economic growth: evidence from Ghana. Department of Economics, University of Ghana. UNDP, 2004. A report on Liquefied Petroleum Gas (LPG) Substitution for Wood Fuel in
Ghana—Opportunities and Challenges, INFOLINK No.1.
Vinod, H.D., 1978. A survey of ridge regression and related techniques for improvements over ordinary least squares.The Review of Economics and Statistics60, 1, 121–131.
Wadud, Z., Dey, H.S., Kabir, M.A. and Khan, S.I., 2011. Modeling and forecasting natural gas demand in Bangladesh.Energy Policy39, 11, 7372–7380.