Machine learning methods for comparative and time-oriented
Quality Estimation of Machine Translation output
Eleftherios Avramidis and Maja Popovi´c
German Research Center for Artificial Intelligence (DFKI GmbH) Language Technology Lab
Alt Moabit 91c, 10559 Berlin
[email protected]@dfki.de
Abstract
This paper describes a set of experi-ments on two sub-tasks of Quality Esti-mation of Machine Translation (MT)
out-put. Sentence-level ranking of alternative
MT outputs is done with pairwise classi-fiers using Logistic Regression with black-box features originating from PCFG Pars-ing, language models and various counts.
Post-editing time prediction uses
regres-sion models, additionally fed with new elaborate features from the Statistical MT decoding process. These seem to be better indicators of post-editing time than black-box features. Prior to training the models, feature scoring with ReliefF and Informa-tion Gain is used to choose feature sets of decent size and avoid computational com-plexity.
1 Introduction
During the recent years, Machine Translation (MT) has reached levels of performance which al-low for its integration into real-world translation workflows. Despite the high speed and various ad-vantages of this technology, the fact that the MT results are rarely perfect and often require man-ual corrections has raised a need to assess their quality, predict the required post-editing effort and compare outputs from various systems on applica-tion time. This has been the aim of current re-search on Quality Estimation, which investigates solutions for several variations of such problems.
We describe possible solutions for two prob-lems of MT Quality Estimation, as part of the 8th Shared Task on Machine Translation:
(a) sentence-level quality ranking(1.2) of multi-ple translations of the same source sentence and
(b) prediction of post-editing time (1.3). We present our approach on acquiring (section 2.1)
and selecting features (section 2.2), we explain the generation of the statistical estimation systems (section 2.3) and we evaluate the developed solu-tions with some of the standard metrics (section 3).
2 Methods: Quality Estimation as machine learning
These two Quality Estimation solutions have been seen as typical supervised machine learning prob-lems. MT output has been given to humans, so that they perform either (a) ranking of the multiple MT system outputs in terms of meaning or (b) post-editing of single MT system output, where time needed per sentence is measured. The output of these tasks has been provided by the shared task organizers as a training material, whereas a small keep-out set has been reserved for testing pur-poses.
Our task is therefore to perform automatic qual-ity analysis of the translation output and the trans-lation process in order to provide features for the supervised machine learning mechanism, which is then trained over the corresponding to the respec-tive human behaviour. The task is first optimized
in adevelopmentphase in order to produce the two
best shared task submissions for each task. These are finally tested on the keep-out set so that their performance is compared with the ones submitted by all other shared-task participants.
2.1 Feature acquisition
We acquire two types of sentence-level features, that are expected to provide hints about the quality of the generated translation, depending on whether they have access to internal details of the MT de-coding process (glass-box) or they are only de-rived from characteristics of the processed and generated sentence text (black-box).
2.1.1 Black-box features
Features of this type are generated as a result of automatic analysis of both the source sentence and the MT output (when applicable), whereas many of them are already part of the baseline infrastruc-ture. For all features we also calculate the ratios of the source to the target sentence. These features include:
PCFG Features: We parse the text with a PCFG grammar (Petrov et al., 2006) and we derive the counts of all node labels (e.g. count of VPs, NPs etc.), the parse log-likelihood and the number of the n-best parse trees generated (Avramidis et al., 2011).
Rule-based language correction is a result of hand-written controlled language rules, that indi-cate mistakes on several pre-defined error indi- cate-gories (Naber, 2003). We include the number of errors of each category as a feature.
Language model scores include the smoothed n-gram probability and the n-gram perplexity of the sentence.
Count-based features include count and per-centage of tokens, unknown words, punctuation marks, numbers, tokens which do or do not con-tain characters “a-z”; the absolute difference be-tween number of tokens in source and target nor-malized by source length, number of occurrences of the target word within the target hypothesis av-eraged for all words in the hypothesis (type/token ratio).
Source frequency: A set of eight features in-cludes the percentage of uni-grams, bi-grams and tri-grams of the processed sentence in frequency quartiles 1 (lower frequency words) and 4 (higher frequency words) in the source side of a parallel corpus (Callison-Burch et al., 2012).
Contrastive evaluation scores: For the ranking task, each translation is scored with an automatic metric (Papineni et al., 2002; Lavie and Agarwal, 2007), using the other translations as references (Soricut et al., 2012).
2.1.2 Glass-box features
Glass-box features are available only for the time-prediction task, as a result of analyzing the verbose output of the Minimum Bayes Risk decoding pro-cess.
Counts from the best hypothesis: Count of phrases, tokens, average/minimum/maximum phrase length, position of longest and shortest phrase in the source sentence; count of words unknownto the phrase table, average number of unknown words first/last position of an unknown word in the sentence normalized to the number of tokens, variance and deviation of the position of the unknown words.
Log probability (pC) and future cost esti-mate(c) of the phrases chosen as part of the best translation: minimum and maximum values and their position in the sentence averaged to the num-ber of sentences, and also their average, variance, standard deviation; count of the phrases whose probability or future cost estimate is lower and higher than their standard deviation; the ratio of these phrases to the total number of phrases.
Alternative translations from the search path of the decoder: average phrase length, average of the average/variance/standard deviation of phrase log probability and future cost estimate, count of alternative phrases whose log probability or future cost estimate is lower and higher than their stan-dard deviation.
2.2 Feature selection
Feature acquisition results in a huge number of features. Although the machine learning mech-anisms already include feature selection or regu-larization, huge feature sets may be unusable for training, due to the high processing needs and the sparsity or noise they may infer. For this purpose we first reduce the number of features by scoring them with two popular correlation measurement methods.
2.2.1 Information gain
Information gain (Hunt et al., 1966) estimates the difference between the prior entropy of the classes and the posterior entropy given the attribute val-ues. It is useful for estimating the quality of each attribute but it works under the assumption that features are independent, so it is not suitable when strong feature inter-correlation exists. Information gain is only used for the sentence ranking task af-ter discretization of the feature values.
2.2.2 ReliefF
dif-ferent classes (Kononenko, 1994). It picks up a number of instances in random and calculates a featurecontributionbased on the nearest hits and misses. It is a robust method which can deal with incomplete and noisy data (Robnik-ˇSikonja and Kononenko, 2003).
2.3 Machine learning algorithms
Machine learning is performed for the two sub-tasks using common pairwise classification and
regressionmethods, respectively.
2.3.1 Ranking with pairwise binary classifiers
For the sub-task on sentence-ranking we used pair-wise classification, so that we can take advantage of several powerful binary classification methods (Avramidis, 2012). We usedlogistic regression, which optimizes a logistic function to predict val-ues in the range between zero and one (Cameron, 1998), given a feature setX:
P(X) = 1
1 +e−1(a+bX) (1)
The logistic function is fitted using the Newton-Raphson algorithm to iteratively minimize the least squares error computed from training data (Miller, 2002). Experiments are repeated with two variations of Logistic Regression concerning inter-nal features treatment:Stepwise Feature Set Selec-tion (Hosmer, 1989) and L2-Regularization (Lin et al., 2007).
2.3.2 Regression
For the sub-task on post-editing time prediction, we experimented with several regression meth-ods, such as Linear Regression, Partial Least
Squares (Stone and Brooks, 1990), Multivariate
Adaptive Regression Splines (Friedman, 1991),
LASSO(Tibshirani, 1996),Support Vector
Regres-sion (Basak et al., 2007) and Tree-based regres-sors. Indicatively, Linear regression optimizes co-efficientβfor predicting a valuey, given a feature
vectorX:
y=Xβ+ε (2)
2.4 Evaluation
The ranking task is evaluated by measuring cor-relation between the predicted and the human ranking, with the use of Kendall tau (Kendall, 1938) including penalization of ties. We addi-tionally consider two more metrics specialized in
ranking tasks: Mean Reciprocal Rank - MRR (Voorhees, 1999) and Normalized Discounted Cu-mulative Gain - NDGC (J¨arvelin and Kek¨al¨ainen, 2002), which give better scores to models when higher ranks (i.e. better translations) are ordered correctly, as these are more important than lower ranks.
The regression task is evaluated in terms of Root Mean Square Error (RMSE) and Mean Average Error (MAE).
3 Experiment and Results 3.1 Implementation
Relieff is implemented for k=5 nearest neighbours sampling m=100 reference instances. Information gain is calculated after discretizing features into n=100 values
N-gram features are computed with the SRILM toolkit (Stolcke, 2002) with an order of 5, based on monolingual training material from Europarl (Koehn, 2005) and News Commentary (Callison-Burch et al., 2011). PCFG parsing features are generated on the output of the Berkeley Parser (Petrov and Klein, 2007) trained over an English, a German and a Spanish treebank (Taul´e et al., 2008). The open source language tool1 is used
to annotate source and target sentences with lan-guage suggestions. The annotation process is or-ganised with the Ruffus library (Goodstadt, 2010) and the learning algorithms are executed using the Orange toolkit (Demˇsar et al., 2004).
3.2 Sentence-ranking
The sentence-ranking sub-task has provided train-ing data for two language pairs, German-English and English-Spanish. For both sentence pairs, we train the systems using the provided an-notated data sets WMT2010, WMT2011 and WMT2012, while the data set WMT2009 is used for the evaluation during the development phase. Data sets are analyzed with black-box feature gen-eration. For each language pair, the two systems with the highest correlation are submitted.
We start the development with two feature sets that have shown to perform well in previous ex-periments: #24 (Avramidis, 2012) including fea-tures from PCFG parsing, and #31 which is the baseline feature set of the previous year’s shared task (Callison-Burch et al., 2012) and we combine them (#33). Additionally, we create feature sets by
de-en en-es
id feature-set tau MRR NDGC tau MRR NDGC
#24 previous (Avramidis, 2012) 0.28 0.57 0.78 0.09 0.52 0.75
#31 baseline WMT2012 0.04 0.51 0.74 -0.16 0.43 0.69 #32 vanilla WMT2013 0.04 0.51 0.74 -0.13 0.45 0.70
#33 combine #24 and #31 0.29 0.57 0.78 0.10 0.53 0.75
#41 ReliefF 15 best 0.20 0.56 0.77 0.02 0.48 0.72
#411 ReliefF 5 best 0.22 0.53 0.76 0.19 0.49 0.73 #42 InfGain 15 best 0.15 0.53 0.75 -0.14 0.43 0.69 #43 combine #41 and #42 0.22 0.56 0.77 -0.12 0.44 0.70
[image:4.595.130.471.61.174.2]#431 combine #41, #42 and #24 0.27 0.60 0.80 0.11 0.54 0.75
Table 1: Development experiments for task 1.2, reporting correlation and ranking scores, tested on the development set WMT2009.
target feature β avg target word occurrence 2.18
pseudoMETEOR 0.71
count of unknown words 0.55
count of dots -0.25
count of commas 0.15 count of tokens -0.13
count of VPs -0.06
PCFGlog -0.02
lmprob 0.01
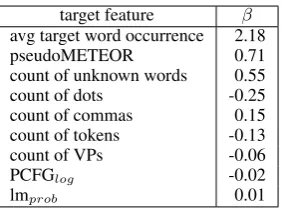
Table 3: Beta coefficients of the best fitted logistic regression on the German-English data set (set #33 with Stepwise Feature Set Selection)
scoring features with ReliefF (features #41x) and Information Gain (#42). Many combinations of all the above feature-sets are tested and the most im-portant of them are shown in Table 1. Feature sets are described briefly in Table 2.
For German-English, we experiment with 14 feature sets, using both variations of Logistic Re-gression. The two highest tau scores are given by Stepwise Feature Set Selection using feature sets #33 and #24. We see that although baseline fea-tures #31 alone have very low correlation, when combined with previously successful #24, provide the best system in terms of tau. Feature set #431 (which combines the 15 features scored higher with ReliefF, the 15 features scored higher with In-formation Gain and the feature set #24) succeeds pretty well on the additional metrics MRR and NDGC, but it provides slightly lower tau correla-tion.
ForEnglish-Spanish, the correlation of the pro-duced systems is significantly lower and it ap-pears that the L2-regularized logistic regression performs better as classification method. We ex-periment with 24 feature sets, after more scor-ing with ReliefF and Inf. Gain. Surprisscor-ingly enough, Kendall tau correlation indicates that the best model is trained only with features based
target feature β count of unknown words -0.55
count of VPs 0.19
count of of PCFG parse trees -0.16
count of tokens 0.15
% of tokens with only letters -0.07
lmprob -0.06
pseudoMETEOR precision -0.05 source/target ratio of parse trees -0.03
Table 4: Most indicative beta coefficients of the best fitted logistic regression on the English-Spanish data set (set #431 with L2-regularization)
on counts of numbers and punctuation, combined
withcontrastive BLEU score. This seems to rather
overfit a peculiarity of the particular development set and indeed performs much lower on the final test set of the shared task (tau=0.04). The second best feature set (#431) has been described above and luckily generalizes better on an unknown set. It is interesting to see that this issue would have been avoided, if the decision was taken based on the ranking metrics MRR and NDGC, which pri-oritize other feature sets. We assume that further work is needed to see whether these measures are more expressive and reliable than Kendall tau for similar tasks.
The fittedβcoefficients (in tables 3 and 4) give
an indication of the importance of each feature (see equation 1), for each language pair. In both language pairs, target-side features prevail upon other features. On the comparison of the models for the two language pairs (and theβ coefficients
as well) we can see that the model settings and performance may vary from one language pair to another. This also requires further investigation, given that Kendall tau and the other two metrics indicate different models as the best ones.
[image:4.595.112.256.225.331.2] [image:4.595.338.497.226.321.2]Selec-set features
#24 From previous work (Avramidis, 2012):
[s+t]: PCFGlog, count of: unknown words, tokens, PCFG trees, VPs
[t]: pseudoMETEOR
#31 Baseline from WMT12 (Callison-Burch et al., 2012)
[s+t]: tokensavg, lmprob, count of: commas, dots, tokens, avg translations per source word
[s]: avg freq. of low and high freq. bi-grams/tri-grams, % of distinct uni-grams in the corpus
[t]: type/token radio
#32 All 50 “vanilla” features provided by shared-task baseline software “Quest” #411 ReliefF best 5 features
[s+t]: % of numbers, difference between periods of source and target (plain and averaged)
[image:5.595.120.483.59.207.2][t]: pseudoBLEU
Table 2: Description of most important feature sets for task 1.2, before internal feature selection of Logistic Regression is applied. [s] indicates source, [t] indicates target
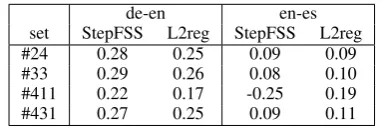
de-en en-es
set StepFSS L2reg StepFSS L2reg
#24 0.28 0.25 0.09 0.09
#33 0.29 0.26 0.08 0.10
#411 0.22 0.17 -0.25 0.19
[image:5.595.309.522.260.376.2]#431 0.27 0.25 0.09 0.11
Table 5: Higher Kendall tau correlation (on the dev. set) is achieved on German-English by us-ing Stepwise Feature Set Selection, whereas on English-Spanish by using L2-regularization
tion, whereas the English-Spanish one with L2-Regularization (table 5) may be explained by the statistical theory about these two methods: The Stepwise method has has been proven to be too bound to particular characteristics of the de-velopment set (Flom and Cassell, 2007). L2-Regularization has been suggested as an alterna-tive, since it generalizes better on broader data sets, which is probably the case for English-Spanish.
Our method also seems to perform well when compared to evaluation metrics which have access to reference translations, as shown in this year’s Metrics Shared Task (Mach´aˇcek and Ondˇrej, 2013).
3.3 Post-editing time prediction
The training for the model predicting post-editing time is performed over the entire given data set and the evaluation is done with 10-fold cross-validation. We evaluated 8 feature sets with 6 re-gression methods each, ending up with 48 experi-ments.
The evaluation of the most indicative regression models (two best performing ones per feature set) can be seen in Table 6. We start with a
glass-1 10 19 28 37 46 55 647382 91 100 109 118 127 136 145 154 163 172 181 190 199 208 217 226 235 0
50 100 150 200 250 300 350 400 450 500
REF HYP
Figure 1: Graphical representation of the values predicted by the linear regression model with fea-ture set #6 (blue) against the actual values of the development set (red)
box feature set, scored with ReliefF and conse-quently add black-box features. We note the mod-els that have the lowest Root Mean Square Error and Mean Average Error.
Our best model seems to be the one built linear regression using feature set #6. This feature set is chosen by collecting the 17 best features as scored by ReliefF and includes both black-box and glass-box features. How well this model fits the devel-opment test is represented in Figure 1.
The second best feature set (#8) includes 29 glass-box features with the highest absolute Reli-efF, joined with the black-box features of the suc-cessful feature set #6.
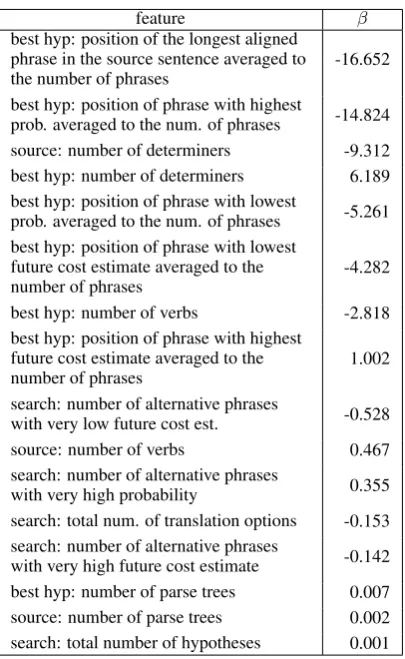
More details about the contribution of the most important features in the linear regression (equa-tion 2) can be seen in table 7, where the fittedβ
[image:5.595.85.277.261.325.2]id feature set method RMSE MAE #1 20 glass-box features with highest absolute ReliefF MARSSVR 91.5493.57 59.0755.87
#2 9 glass-box features with highest positive ReliefF LassoLinear 83.2083.32 51.5751.72
#3 16 glass-box features with highest positive ReliefF LassoLinear 77.5477.60 47.1647.27
#4 22 glass-box features with highest positive ReliefF LassoLinear 76.0576.17 46.3746.48
#5 Combination of feature sets #1 and #2 MARSSVR 91.5493.57 59.0755.87
#6 17 features of any type with highest positive ReliefF LinearLasso 74.7074.75 45.2044.99
#8 Combination of #5 and #6 + counts of tokens LassoPLS 75.1477.63 44.9947.48
#6 First submission Linear 84.27 52.41
#8 Second submission PLS 88.34 53.49
[image:6.595.135.466.61.260.2]Best models 82.60 47.52
Table 6: Development and submitted experiments for task 1.3
• the longest of the source phrases used for
pro-ducing the best hypothesis appears closer to the end of the sentence
• the phrases with the highest and the lowest probability appear closer to the end of the translated sentence
• there are more determiners in the source
and/or less determiners in the translation
• there are more verbs in the translation and/or
less verbs in the source
• there are fewer alternative phrases with very
high probability
Further conclusions can be drawn after examining these observations along with the exact operation of the statistical MT system, which is subject to further work.
4 Conclusion
We describe two approaches for two respective problems of quality estimation, namely sentence-level ranking of alternative translations and pre-diction of time for post-editing MT output. We present efforts on compiling several feature sets and we examine the final contribution of the fea-tures after training Machine Learning models. Elaborate decoding features seem to be quite help-ful for predicting post-editing time.
feature β
best hyp: position of the longest aligned phrase in the source sentence averaged to
the number of phrases -16.652 best hyp: position of phrase with highest
prob. averaged to the num. of phrases -14.824 source: number of determiners -9.312 best hyp: number of determiners 6.189 best hyp: position of phrase with lowest
prob. averaged to the num. of phrases -5.261 best hyp: position of phrase with lowest
future cost estimate averaged to the
number of phrases -4.282
best hyp: number of verbs -2.818 best hyp: position of phrase with highest
future cost estimate averaged to the
number of phrases 1.002
search: number of alternative phrases
with very low future cost est. -0.528 source: number of verbs 0.467 search: number of alternative phrases
with very high probability 0.355 search: total num. of translation options -0.153 search: number of alternative phrases
[image:6.595.316.519.343.673.2]Acknowledgments
This work has been developed within the TaraX ˝U project, financed by TSB Technologiestiftung Berlin – Zukunftsfonds Berlin, co-financed by the European Union – European fund for regional de-velopment. Many thanks to Prof. Hans Uszko-reit for the supervision, Dr. Aljoscha Burchardt, and Dr. David Vilar for their useful feedback and to Lukas Poustka for his technical help on feature acquisition.
References
Avramidis, E. (2012). Comparative Quality Estima-tion: Automatic Sentence-Level Ranking of Multi-ple Machine Translation Outputs. In Proceedings of 24th International Conference on Computational Linguistics, pages 115–132, Mumbai, India. The COLING 2012 Organizing Committee.
Avramidis, E., Popovic, M., Vilar, D., and Burchardt, A. (2011). Evaluate with Confidence Estimation : Machine ranking of translation outputs using gram-matical features. InProceedings of the Sixth Work-shop on Statistical Machine Translation, pages 65– 70, Edinburgh, Scotland. Association for Computa-tional Linguistics.
Basak, D., Pal, S., and Patranabis, D. C. (2007). Support vector regression. Neural Information Processing-Letters and Reviews, 11(10):203–224.
Callison-Burch, C., Koehn, P., Monz, C., Post, M., Soricut, R., and Specia, L. (2012). Findings of the 2012 Workshop on Statistical Machine Translation. In Proceedings of the Seventh Workshop on Statis-tical Machine Translation, pages 10–51, Montr´eal, Canada. Association for Computational Linguistics.
Callison-Burch, C., Koehn, P., Monz, C., and Zaidan, O. (2011). Findings of the 2011 Workshop on Sta-tistical Machine Translation. InProceedings of the Sixth Workshop on Statistical Machine Translation, pages 22–64, Edinburgh, Scotland. Association for Computational Linguistics.
Cameron, A. (1998). Regression analysis of count data. Cambridge University Press, Cambridge UK; New York NY USA.
Demˇsar, J., Zupan, B., Leban, G., and Curk, T. (2004). Orange: From Experimental Machine Learning to Interactive Data Mining. InPrinciples of Data Min-ing and Knowledge Discovery, pages 537–539.
Flom, P. L. and Cassell, D. L. (2007). Stopping step-wise: Why stepwise and similar selection methods are bad, and what you should use. In NorthEast SAS Users Group Inc 20th Annual Conference, Bal-timore, Maryland. 2007.
Friedman, J. H. (1991). Multivariate Adaptive Regres-sion Splines. The Annals of Statistics, 19(1):1–67.
Goodstadt, L. (2010). Ruffus: a lightweight Python library for computational pipelines. Bioinformatics, 26(21):2778–2779.
Hosmer, D. (1989).Applied logistic regression. Wiley, New York [u.a.], 8th edition.
Hunt, E., Martin, J., and Stone, P. (1966). Experiments in Induction. Academic Press, New York.
J¨arvelin, K. and Kek¨al¨ainen, J. (2002). Cumulated gain-based evaluation of IR techniques. ACM Trans. Inf. Syst., 20(4):422–446.
Kendall, M. G. (1938). A New Measure of Rank Cor-relation. Biometrika, 30(1-2):81–93.
Koehn, P. (2005). Europarl: A parallel corpus for sta-tistical machine translation. Proceedings of the tenth Machine Translation Summit, 5:79–86.
Kononenko, I. (1994). Estimating attributes: analy-sis and extensions of RELIEF. In Proceedings of the European conference on machine learning on Machine Learning, pages 171–182, Secaucus, NJ, USA. Springer-Verlag New York, Inc.
Lavie, A. and Agarwal, A. (2007). METEOR: An Au-tomatic Metric for MT Evaluation with High Levels of Correlation with Human Judgments. In Proceed-ings of the Second Workshop on Statistical Machine Translation, pages 228–231, Prague, Czech Repub-lic. Association for Computational Linguistics.
Lin, C.-J., Weng, R. C., and Keerthi, S. S. (2007). Trust region Newton methods for large-scale logistic re-gression. In Proceedings of the 24th international conference on Machine learning - ICML ’07, pages 561–568, New York, New York, USA. ACM Press.
Mach´aˇcek, M. . and Ondˇrej, B. (2013). Results of the WMT13 Metrics Shared Task. InProceedings of the 8th Workshop on Machine Translation, Sofia, Bul-garia. Association for Computational Linguistics.
Miller, A. (2002). Subset Selection in Regression. Chapman & Hall, London, 2nd edition.
Naber, D. (2003). A rule-based style and grammar checker. Technical report, Bielefeld University, Bielefeld, Germany.
Papineni, K., Roukos, S., Ward, T., and Zhu, W.-J. (2002). BLEU: a Method for Automatic Evalua-tion of Machine TranslaEvalua-tion. InProceedings of the 40th Annual Meeting of the Association for Com-putational Linguistics, pages 311–318, Philadelphia, Pennsylvania, USA. Association for Computational Linguistics.
International Conference on Computational Lin-guistics and 44th Annual Meeting of the Association for Computational Linguistics, pages 433–440, Syd-ney, Australia. Association for Computational Lin-guistics.
Petrov, S. and Klein, D. (2007). Improved inference for unlexicalized parsing. InProceedings of the 2007 Annual Conference of the North American Chap-ter of the Association for Computational Linguis-tics, Rochester, New York. Association for Compu-tational Linguistics.
Robnik-ˇSikonja, M. and Kononenko, I. (2003). Theo-retical and Empirical Analysis of ReliefF and RRe-liefF. Machine Learning, 53(1-2):23–69.
Soricut, R., Wang, Z., and Bach, N. (2012). The SDL Language Weaver Systems in the WMT12 Quality Estimation Shared Task. InProceedings of the Sev-enth Workshop on Statistical Machine Translation, pages 145–151, Montr´eal, Canada. Association for Computational Linguistics.
Stolcke, A. (2002). SRILM – An Extensible Language Modeling Toolkit. In Proceedings of the Seventh International Conference on Spoken Language Pro-cessing, pages 901–904. ISCA.
Stone, M. and Brooks, R. J. (1990). Continuum re-gression: cross-validated sequentially constructed prediction embracing ordinary least squares, par-tial least squares and principal components regres-sion. Journal of the Royal Statistical Society Series B Methodological, 52(2):237–269.
Taul´e, M., Mart´ı, A., and Recasens, M. (2008). An-Cora: Multilevel Annotated Corpora for Catalan and Spanish. In Proceedings of the Sixth International Conference on Language Resources and Evaluation (LREC’08), Marrakech, Morocco. European Lan-guage Resources Association (ELRA).
Tibshirani, R. (1996). Regression shrinkage and selec-tion via the lasso. Series B:267–288.