On the Feasibility of Automatically Describing
n
-dimensional Objects
Pablo Ariel Duboue Les Laboratoires Foulab
999 du College Montreal, Queb´ec [email protected]
Abstract
This paper introduces the problem of gen-erating descriptions ofn-dimensional spa-tial data by decomposing it via model-based clustering. I apply the approach to the error function of supervised clas-sification algorithms, a practical problem that uses Natural Language Generation for understanding the behaviour of a trained classifier. I demonstrate my system on a dataset taken from CoNLL shared tasks.
1 Introduction
My focus is the generation of textual descriptions for n-dimensional data. At this early stage in this research, I introduce the problem, describe a potential application and source of interesting n -dimensional objects and show preliminary work on a traditional NLG system built on off-the-shelf text planning and surface realization technology plus a customized sentence planner.
This work was inspired by a talk by Kathleen McCoy in which she described a system that pro-duces Natural Language explanations of maga-zine infographics for the blind by combining Com-puter Vision techniques with NLG (Carberry et al., 2013). She mentioned an anecdote in which she asked a blind user of the system what would the user would want added to the text description and the user replied “I don’t know, I have never seen an infographic.” I found the comment very inspir-ing and it led to the realization thatn-dimensional objects (for n > 3) were also something which we, as humans, have never seen before and which we will profit from having a computer system to describe to us.
A type ofn-dimensional objects that are of par-ticular practical interest are the error function for a machine learning algorithm for particular training data. That is the case because, for NLP
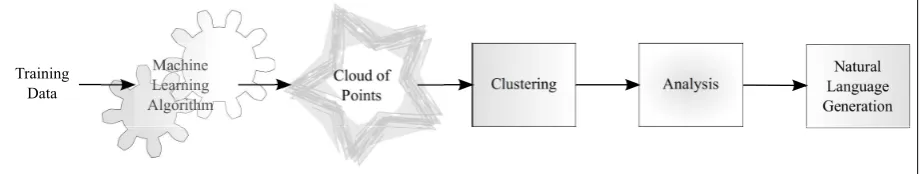
practition-ers using supervised classification, the task of de-bugging and improving their classifiers at times in-volves repeated steps of training with different pa-rameters. Usually, at each stage the trained model is kept as an opaque construct of which only ag-gregate statistics (precision, recall, etc) are inves-tigated. My technology improves this scenario by generating Natural Language descriptions for the error function of trained machine learning models. My system, Thoughtland,1(Fig. 1) is a pipeline with four stages, accessed through a Web-based interface (Duboue, 2013), further discussed in the next section.
This early prototype is already able to tackle de-scriptions of existing, non-trivial data. These re-sults are very encouraging and the problem merits attention from other NLG researchers. To further broad interest in this problem, I am distributing my prototype under a Free Software license,2 which should encourage extensions and classroom use. I have already found the current descriptions useful for telling apart the output of two different algo-rithms when run on the same data.
I will now describe the algorithm and then dive into the NLG details. I conclude with related and future work discussions.
2 Algorithm
Thoughtland’s architecture is shown in Fig. 1. While the first stage lies clearly outside the in-terest of NLG practitioners, the next two stages (Clustering and Analysis) are related to the mes-sage generationaspect of content planning (Reiter and Dale, 2000),3 as they seek to transform the
data into units that can be communicated verbally (the last stage is the more traditional NLG system itself).
1http://thoughtland.duboue.net
2https://github.com/DrDub/Thoughtland 3pages 61-63.
Training Data
Figure 1: Thoughtland’s architecture.
2.1 Cross-Validation
The error function is computed as the error for each point in the input data. For a numeric tar-get class, that would mean that for every training instance (~x, y),e =
f( ~ x)−y
, where the error
is computed using f trained on the folds that do not contain(~x, y).4This stage produces a cloud of points inn-dimensions, forn =F + 1, whereF
is the number of features in the training data (the extra dimension is the error value).
2.2 Clustering
The cloud of error points obtained in the previous step is then clustered using a mixture of Dirich-let models (McCullagh and Yang, 2008) as imple-mented by Apache Mahout (Owen et al., 2011).5
I choose this clustering approach because each of the obtained clusters has a geometrical rep-resentation in the form of n-balls, which are n -dimensional spheres. These representations are important later on for the natural language gener-ation approach.
Some input features present a natural geomet-ric groupings which will interfere with a clustering set to elucidate the error function. To make the er-ror coordinate the most prominent coordinate for clustering, I re-scale the error coordinate using the radius of ann-ball that encompasses all the input features.
2.3 Analysis
In Fig. 1, the Analysis Stage involves determin-ing the overall size, density, distances to the other
n-balls and extension in each dimension for each
n-ball. These numbers are put into perspective with respect to then-ball encompassing the whole cloud of points. The distance between twon-balls, for example, is said to bebigif in any dimension
4
The error is different if the target class is not numeric (nominal target classes). In that case the error is 1.0 if the class is different from the target or 0 if it the same.
5See Section 9.4.2, “Dirichlet clustering.”
it is above half the radius of the large n-ball in that particular dimension. Eachn-ball is also com-pared to each other in terms of distance.
I have so far determined these thresholds by working on the mileage data discussed elsewhere (Duboue, 2013). Objective-function optimization-based techniques (discussed in the next section) might prove useful here.
This stage is at its infancy, in future work I want to analyze the pairs of n-balls in terms of rotations as they are particularly important to de-termine how many dimensions are actually being used by the sets ofn-balls.
3 Natural Language Generation
As I go exploring the different aspects of the prob-lem, I opt for a very traditional generation system and architecture. Approaches based on learning (Mairesse et al., 2010; Varges and Mellish, 2010; Oh and Rudnicky, 2000) are not particularly easy to apply to this problem as I am producing a text for which there are no available examples. I do hope to explore objective-function optimization-based techniques such as Lemon (2011) or Deth-lefs and Cuay´ahuitl (2011) in the near future.
The NLG system is thus implemented on top of McKeown’s (1985) Document Structur-ing Schemata (usStructur-ing the recent implementation OpenSchema6) and SimpleNLG (Gatt and Reiter, 2009). I use two schemata, in one the n-balls are presented in order while in the other the attributes are presented in order. One of the schemata I am using is shown in Fig. 2. Document structur-ing schemata are transition networks of rhetorical predicates that can contain free and bound vari-ables, with restrictions on each variable. The sys-tem presents the user the shorter description.
Either strategy should emphasize similarities, simplifying aggregation (Reape and Mellish, 1999). I employ some basic aggregation rules, that
is, for each aggregation segment I assemble all
n-balls with the same property together to make complex sentences. That works well for size and density. To verbalize distances, I group the dif-ferent pairs by distance value and then look for cliques using the Bron-Kerbosch clique-finding al-gorithm (Bron and Kerbosch, 1973), as imple-mented in JGraphT.7 I also determine the most common distance and verbalize it as a defeasible rule (Knott et al., 1997), which significantly short-ens the text.
This pipeline presents a non-trivial NLG appli-cation that is easy to improve upon and can be used directly in a classroom setting.
3.1 Case Study
I will now illustrate Thoughtland by virtue of an example with training data from the CoNLL Shared Task for the year 2000 (Sang and Buch-holz, 2000). The task involved splitting a sentence into syntactically related segments of words:
(NP He) (VP reckons) (NP the current account deficit) (VP will narrow) (PP to) (NP only # 1.8 billion) (PP in) (NP September) .
The training contains for each word its POS and its Beginning/Inside/Outside chunk information:
He PRP B-NP
reckons VBZ B-VP
the DT B-NP
current JJ I-NP account NN I-NP deficit NN I-NP
will MD B-VP
narrow VB I-VP
I transformed the data into a classification problem based on the current and previous POS, rendering it a two dimensional problem. The provided data consists of 259,104 training instances. Over this data Na¨ıve Bayes produces an accuracy of 88.9% and C4.5, 89.8%. These numbers are very close, but do the two algorithms produce similar error function? Looking at Thoughtland’s descriptions (Fig. 3) we can see that is not the case.
In later runs I add the current and previous words, to make for a three and fourth dimensional problem. These are extra dimensions with a nomi-nal class with 20,000 distinct values (one for each word). Interestingly, when the classifiers become good enough, there is no discriminating informa-tion left to verbalize. A similar situainforma-tion happens when the classifiers have poor accuracy.
7http://jgrapht.sourceforge.net/
schema by-attribute(whole: c-full-cloud) ; first sentence, overall numbers pred-intro(cloud|whole)
aggregation-boundary star
pred-size()
aggregation-boundary star
pred-density() aggregation-boundary star
pred-distance()
predicate pred-density variables
req def component : c-n-ball req attribute : c-density properties
component == attribute.component output
pred has-attribute pred0 component pred1 attribute pred2 magnitude
Figure 2: One of the two schemata employed by Thoughtland. This schema produces descriptions focusing on the similar attributes of each of then -balls. I include one of the predicates for reference.
4 Related Work
The problem of describingn-dimensional objects is a fascinating topic which Thoughtland just starts to address. It follows naturally the long term inter-est in NLG for describing 3D scenes (Blocher et al., 1992), spatial/GIS data (De Carolis and Lisi, 2002) or just numerical data (Reiter et al., 2008).
In the more general topic of explaining machine learning decisions, ExOpaque (Guo and Selman, 2007) takes a trained system and uses it to pro-duce training data for an Inductive Logic Program-ming (Muggleton and Raedt., 1994) system, pre-senting the resulting Horn-clauses directly to the user. Focusing on explaining the impact of specific attributes in the prediction outcome of a particular instance, Robnik-Sikonja and Kononenko (2008) analyze changes to the classification outcome un-der different input variations, weighted by their priors, an idea explored early on in agent-based systems (Johnson, 1994). In general, systems based on Bayesian networks seem to have a stronger probabilistic framework that facilitates explanations (Lacave and Diez, 2000).
commu-THREEDIMENSIONS
Naive Bayes C4.5
Accuracy 88.9% Accuracy 89.8%
There are five components and three dimensions. Component One is big and components Two, Three and Four are small. Component Four is dense and components Two and Three are very dense. Components Three and Five are at a good distance from each other. The rest are all far from each other.
There are six components and three dimensions. Component One is big, components Two, Three and Four are small and component Five is giant. Component Five is sparse and com-ponents Two, Three and Four are very dense. Comcom-ponents One and Two are at a good distance from each other. The rest are all far from each other.
FOURDIMENSIONS
Accuracy 90.4% Accuracy 91.4%
There are six components and four dimensions. Components One, Two and Three are big and components Four and Five are small. Component Three is dense, component One is sparse and components Four and Five are very dense. Components Two and Three are at a good distance from each other. The rest are all far from each other.
There are six components and four dimensions. Components One, Two and Three are big and components Four and Five are small. Component One is dense, component Three is sparse and components Four and Five are very dense. Components Three and Four are at a good distance from each other. Components Six and Four are also at a good distance from each other. The rest are all far from each other.
FIVEDIMENSIONS
Accuracy 91.6% Accuracy 91.6%
There is one component and five dimensions. There is one component and five dimensions. Figure 3: Example generated descriptions.
nities. However, as stated by Janert (2010):8
As soon as we are dealing with more than two variables simultaneously, things become much more complicated – in particular, graphical methods quickly become impractical.
The focus is then in dimensionality reduction9
and projection (Kaski and Peltonen, 2011), usually as part of an integrated development environment (Kapoor et al., 2012; Patel et al., 2010). The usual discussion regarding the complementary role of text and graphics, as studied for a long time in NLG (McKeown et al., 1997), applies also here: there are things like generalizations and excep-tions that are easier to express in text. We look forward for NLG-based approaches to be included in future versions of ML IDEs such as Gestalt.
Finally, Thoughtland uses the error function for an ML algorithm as applied to training data. A similarly worded term which should not be con-fused is error surface(Reed and Marks, 1999),10 which refers to the space of possible MLmodels. Error surfaces are particularly important for train-ing algorithms that explore the said surface, for ex-ample by gradient descent.
8
Chapter 5, page 99.
9
A reviewer suggested combining dimensionality reduc-tion and NLG, an idea most definitely worth exploring.
10Chapter 8.
5 Final Remarks
I have presented Thoughtland, a working proto-type addressing the problem of describing clouds of points inn-dimensional space. In this paper I have identified the problem and shown it to be ap-proachable with a solution based on model-based clustering.
For future work, I want to enrich the analysis with positional information: I want to find planes on which a majority of then-balls lie so as to de-scribe their location relative to them. I am also considering hierarchical decomposition in up to five to seven n-balls (to make it cognitively ac-ceptable (Miller, 1956)) as it will translate well to textual descriptions.
My preliminary experiments suggest there is value in generating comparisons for two error functions. I can therefore employ the existing body of work in NLG for generating comparisons (Milosavljevic, 1999).
While the pilot might speak of the feasibility of the task, Thoughtland still needs to be evaluated. For this, I want to start with simple cases such as overfitting or feature leaks and see if the descrip-tions help humans detect such cases faster.
Acknowledgements
References
A. Blocher, E. Stopp, and T. Weis. 1992. ANTLIMA-1: Ein System zur Generierung von Bildvorstel-lungen ausgehend von Propositionen. Techni-cal Report 50, University of Saarbr¨ucken, Sonder-forschungsbereich 314, Informatik.
Coenraad Bron and Joep Kerbosch. 1973. Finding all cliques of an undirected graph (algorithm 457). Commun. ACM, 16(9):575–576.
Sandra Carberry, Stephanie Elzer Schwartz, Kathleen Mccoy, Seniz Demir, Peng Wu, Charles Green-backer, Daniel Chester, Edward Schwartz, David Oliver, and Priscilla Moraes. 2013. Access to mul-timodal articles for individuals with sight impair-ments.ACM Trans. Interact. Intell. Syst., 2(4):21:1– 21:49, January.
Berardina De Carolis and Francesca A Lisi. 2002. A NLG-based presentation method for supporting KDD end-users. InFoundations of Intelligent Sys-tems, pages 535–543. Springer.
Nina Dethlefs and Heriberto Cuay´ahuitl. 2011. Hier-archical reinforcement learning and hidden markov models for task-oriented natural language genera-tion. InProceedings of the 49th Annual Meeting of the Association for Computational Linguistics: Hu-man Language Technologies: short papers-Volume 2, pages 654–659. Association for Computational Linguistics.
P.A. Duboue. 2013. Thoughtland: Natural Language Descriptions for Machine Learning n-dimensional Error Functions. InProceedings of ENLG’13.
Albert Gatt and Ehud Reiter. 2009. SimpleNLG: a realisation engine for practical applications. In Pro-ceedings of the 12th European Workshop on Natu-ral Language Generation, ENLG ’09, pages 90–93, Stroudsburg, PA, USA. Association for Computa-tional Linguistics.
Yunsong Guo and Bart Selman. 2007. ExOpaque: A framework to explain opaque machine learning models using Inductive Logic Programming. In IC-TAI (2), pages 226–229. IEEE Computer Society.
Philipp K. Janert. 2010. Data Analysis with Open Source Tools. O’Reilly.
W Lewis Johnson. 1994. Agents that learn to ex-plain themselves. In Proceedings of the twelfth national conference on Artificial intelligence, vol-ume 2, pages 1257–1263.
Ashish Kapoor, Bongshin Lee, Desney Tan, and Eric Horvitz. 2012. Performance and preferences: In-teractive refinement of machine learning procedures. InTwenty-Sixth AAAI Conference on Artificial Intel-ligence.
Samuel Kaski and Jaakko Peltonen. 2011. Dimen-sionality reduction for data visualization [applica-tions corner]. Signal Processing Magazine, IEEE, 28(2):100–104.
Alistair Knott, Mick O’Donnell, Jon Oberlander, and Chris Mellish. 1997. Defeasible rules in con-tent selection and text structuring. In Proceed-ings of the Sixth European Workshop on Natural Language Generation, pages 50–60, Duisburg, Ger-many, March.
Carmen Lacave and Francisco J. Diez. 2000. A re-view of explanation methods for bayesian networks. Knowledge Engineering Review, 17:2002.
Oliver Lemon. 2011. Learning what to say and how to say it: Joint optimisation of spoken dialogue man-agement and natural language generation. Com-puter Speech & Language, 25(2):210–221.
Franc¸ois Mairesse, Milica Gaˇsi´c, Filip Jurˇc´ıˇcek, Simon Keizer, Blaise Thomson, Kai Yu, and Steve Young. 2010. Phrase-based statistical language generation using graphical models and active learning. In Pro-ceedings of the 48th Annual Meeting of the Asso-ciation for Computational Linguistics, pages 1552– 1561. Association for Computational Linguistics.
Peter McCullagh and Jie Yang. 2008. How many clus-ters? Bayesian Analysis, 3(1):101–120.
Kathleen McKeown, Shimei Pan, James Shaw, Jordan Desmond, and Barry Allen. 1997. Language gener-ation for multimedia healthcare briefings. In Pro-ceedings of the Fifth Conference on Applied Nat-ural Language Processing (ANLP-97), Washington (DC), USA, April.
Kathleen Rose McKeown. 1985.Text Generation: Us-ing Discourse Strategies and Focus Constraints to Generate Natural Language Text. Cambridge Uni-versity Press, Cambridge, England.
George Miller. 1956. The magical number seven, plus or minus two: Some limits on our capacity for processing information. The psychological review, 63:81–97.
Maria Milosavljevic. 1999. Maximising the Coher-ence of Descriptions via Comparison. Ph.D. thesis, Macquarie University, Sydney, Australia.
S. Muggleton and L. D. Raedt. 1994. Inductive logic programming: Theory and methods. Journal of Logic Programming, (19/20):629–679.
Alice Oh and A. Rudnicky. 2000. Stochastic language generation for spoken dialogue systems. In Pro-ceedings of the ANLP/NAACL 2000 Workshop on Conversational Systems, pages 27–32, Seattle, WA, May.
Road PO Box 261 Shelter Island, NY 11964, first edition.
Kayur Patel, Naomi Bancroft, Steven M Drucker, James Fogarty, Andrew J Ko, and James Landay. 2010. Gestalt: integrated support for implemen-tation and analysis in machine learning. In Pro-ceedings of the 23nd annual ACM symposium on User interface software and technology, pages 37– 46. ACM.
Mike Reape and Chris Mellish. 1999. Just what is aggregation anyway? In Proceedings of the European Workshop on Natural Language Genera-tion (EWNLG’99), pages 20 – 29, Toulouse, France, May.
Russell D. Reed and Robert J. Marks. 1999. Neural Smithing: Supervised Learning in Feedforward Ar-tificial Neural Networks. MIT Press.
Ehud Reiter and Robert Dale. 2000. Building Natural Language Generation Systems. Cambridge Univer-sity Press.
Ehud Reiter, Albert Gatt, Franc¸ois Portet and Marian van der Meulen 2008. The importance of narrative and other lessons from an evaluation of an NLG sys-tem that summarises clinical data. InINLG ’08.
Marko Robnik-Sikonja and Igor Kononenko. 2008. Explaining classifications for individual instances. IEEE Trans. Knowl. Data Eng., 20(5):589–600.
Tjong Kim Sang and Sabine Buchholz. 2000. Intro-duction to the CoNLL-2000 shared task: Chunking. InProceedings of the 2nd workshop on Learning language in logic and the 4th conference on Com-putational natural language learning, September, pages 13–14.