The Social Mood of News:
Self-reported Annotations to Design Automatic Mood Detection Systems
Firoj Alam, Fabio Celli, Evgeny A. Stepanov, Arindam Ghosh, and Giuseppe RiccardiDepartment of Information Engineering and Computer Science, University of Trento, Italy
{firoj.alam,fabio.celli,evgeny.stepanov,arindam.ghosh,giuseppe.riccardi}@unitn.it
Abstract
In this paper, we address the issue of automatic prediction of readers’ mood from newspaper ar-ticles and comments. As online newspapers are becoming more and more similar to social media platforms, users can provideaffectivefeedback, such as mood and emotion. We have exploited the self-reported annotation of mood categories obtained from the metadata of the Italian online newspapercorriere.it to design and evaluate a system for predicting five different mood cate-gories from news articles and comments: indignation, disappointment, worry, satisfaction, and amusement. The outcome of our experiments shows that overall, bag-of-word-ngrams perform better compared to all other feature sets; however, stylometric features perform better for the mood score prediction of articles. Our study shows that self-reported annotations can be used to design automatic mood prediction systems.
1 Introduction and Background
Participating in social media has become a mainstream part of our daily lives – we read articles, com-ments, other people’s statuses and provide feedback in terms of emotions through written content. Cur-rently, newspapers are also being designed as social media platforms to facilitate users to provide their opinion along with emotional feedback. Since currently our social participation is mostly done through social media platforms, the online content, including social media and newspapers’ content, is growing very rapidly. In (Turner et al., 2014) the authors estimate that by2020online content might reach 44 trillion gigabytes, including news articles and user generated content such as likes, dislikes, emotions, tastes, identities, and data collected by sensors (Liu, 2007).
Such increasing amount of digital data creates an unprecedented opportunities for businesses and in-dividuals, as well as it poses new challenges to process and generate concrete summaries out of it. For example, everyday journalists need to deal with the large quantity of information whenever they need to prepare a historical/follow-up report or a summary from a large collection of documents. They might want to know how particulartopicsof a news are associated withusers’ mood. The importance of such studies and their use cases have also been reported in (Riccardi et al., 2015). The challenges include automatic processing of semi-structured or unstructured data in different dimensions such as linguistic style, interaction, sentiment, mood and other social signals. Finding the collective information of such signals requires automatic processing, which will be useful for various professionals, specifically psy-chologists and social and behavioral scientists. Among other affective dimensions, mood and sentiment are particularly important for the analysis the consumer behavior towards brands and products (Pang and Lee, 2008; Stieglitz and Dang-Xuan, 2013).
In the past few decades, the affective dimension of text has been mainly analyzed in terms of posi-tive and negaposi-tive polarity (Pak and Paroubek, 2010a; Kouloumpis et al., 2011; Cambria et al., 2016a), although more detailed dimensions are proven to be very useful. In particular, moods such as tension, depression, anger, vigor, fatigue, and confusion in tweets have been found to be good predictors of
This work is licensed under a Creative Commons Attribution 4.0 International Licence. Licence details: http://creativecommons.org/licenses/by/4.0/.
stock market exchanges (Bollen et al., 2011). It has also been demonstrated that it is possible to pre-dict anger, sadness, and joy from LiveJournal blogs with performances up to 78%accuracy (Nguyen et al., 2010). Moreover, it is also possible to distinguish Twitter users who are likely to share content generating joy or amusement from the ones who are likely to share content generating sadness, anger or disappointment with an accuracy of around 61% (Celli et al., 2016). An increasing number of studies focuses on analyzing sentiment in terms of positive and negative polarity from a short text (microblog) (Akkaya et al., 2009; Paltoglou and Thelwall, 2010). From the automatic classification perspective, a research application SentiStrength utilizes a different source of information to assign a sentiment score to a short text (Thelwall et al., 2011; Stieglitz and Dang-Xuan, 2013). Such information includes word-list of sentiment, idioms, emoticons, negating words, linguistic rules and sentiment polarity classification algorithms.
To design automatic detection and classification systems a typical approach to generating reference annotation is to use either sentiment lexicon or automatic system (such as SentiStrength) (Bollen et al., 2011; Stieglitz and Dang-Xuan, 2013; Ferrara and Yang, 2015; Kim and Salehan, 2015), manual expert annotationorself-reported user annotation (Nguyen et al., 2014; Mishne and others, 2005). In (Cambria, 2016), the authors present a hybrid framework for sentiment analysis that includes a knowledge-based system and a machine learning module. Recent advances in knowledge-based NLP for sentiment analysis can be found in (Cambria et al., 2016b).
Self-reported mood annotation by the users of the blog posts has been previously addressed in (Go et al., 2009; Pak and Paroubek, 2010b; Pak and Paroubek, 2010b). In (Davidov et al., 2010), the authors use twitter hashtags as labels for designing an automatic classification system. A similar study has also been reported in (Kunneman et al., 2014). There are still many challenges in designing an automatic system using self-reported annotation because the annotations are not done in a consistent manner. Users annotate them based on theirself-perception, and social media platforms are not designed following any psychological instruments or instructions. The obvious advantages of such annotations are that (1) they are cost-effective, and (2) they provide users’ natural affective expressions.
In this work, our goal is to investigate whether such annotations can be useful for designing an auto-matic system. We investigate two different approaches to predict mood from articles and user comments: (1) regression to assign a score foreach mood category, and (2) binary classification into a positive and negative mood. We comparatively evaluate the predictive power of different feature sets such as char-acter, word, and part-of-speech ngrams, stylometric, and psycholinguistic features. Our study is in-line with the study presented in (Nguyen et al., 2014), where the authors investigate a different set of features along with different machine learning algorithms for feature selection and classification. However, our focus in on the prediction of mood on a continuous [0..1]scale and the utilization of different sets of features. Moreover, we extract the feature from both articles and comments. Because text may contain a blend of emotional manifestations in separate parts, our goal is to obtain a fine-grained view on of a comment or an article in the form of ‘emotional sphere’. Since mood can be expressed through certain idiosyncratic vocabulary and writing style, we make use of stylometric and psycholinguistic features.
The structure of the paper is as follows. In Section 2 we present the details of the data we use through-out experiments. Then, in Section 3 we report the experimental methodology, and in Section 3.2 the results of the experiments. Finally, discussions and conclusions appear in Sections 4 and 5, respectively.
2 Corpus
The data was collected from the most popular Italian daily newspapers – Corriere della Sera. The newspaper’s web site is structured as a social media platform (Boyd et al., 2010). In particular, the platform of the Corriere (1) provides a semi-public profile1for each registered user, (2) articulates a list
of users connected by an ‘interest’ relationship, (3) allows to view user’s connections to other registered users, and (4) includes mood meta data reported by the readers as their ‘self-perception’.
The annotations for moods are available at the article and author levels. Therefore, the mood scores for
● ● ● ● ● ● ● ● ● ● ● ● ● ● ● ● ● ● ● ● ● ● ● ● ● ● ● ● ● ● ● ● ● ● ● ● ● ● ● ● ● ● ● ● ● ● ● ● ● ● ● ● ● ● ● ● ● ● ● ● ● ● ● ● ● ● ● ● ● ● ● ● ● ● ● ● ● ● ● ● ● ● ● ● ● ● ● ● ● ● ● ● ● ● ● ● ● ● ● ● ● ● ● ● ● ● ● ● ● ● ● ● ● ● ● ● ● ● ● ● ● ● ● ● ● ● ● ● ● ● ● ● ● ● ● ● ● ● ● ● ● ● ● ● ● ● ● ● ● ● ● ● ● ● ● ● ● ● ● ● ● ● ● ● ● ● ● ● ● ● ● ● ● ● ● ● ● ● ● ● ● ● ● ● ● ● ● ● ● ● ● ● ● ● ● ● ● ● ● ● ● ● ● ● ● ● ● ● ● ● ● ● ● ● ● ● ● ● ● ● ● ● ● ● ● ● ● ● ● ● ● ● ● ● ● ● ● ● ● ● ● ● ● ● ● ● ● ● ● ● ● ● ● ● ● ● ● ● ● ● ● ● ● ● ● ● ● ● ● ● ● ● ● ● ● ● ● ● ● ● ● ● ● ● ● ● ● ● ● ● ● ● ● ● ● ● ● ● ● ● ● ● ● ● ● ● ● ● ● ● ● ● ● ● ● ● ● ● ● ● ● ● ● ● ● ● ● ● ● ● ● ● ● ● ● ● ● ● ● ● ● ● ● ● ● ● ● ● ● ● ● ● ● ● ● ● ● ● ● ● ● ● ● ● ● ● ● ● ● ● ● ● ● ● ● ● ● ● ● ● ● ● ● ● ● ● ● ● ● ● ● ● ● ● ● ● ● ● ● ● ● ● ● ● ● ● ● ● ● ● ● ● ● ● ● ● ● ● ● ● ● ● ● ● ● ● ● ● ● ● ● ● ● ● ● ● ● ● ● ● ● ● ● ● ● ● ● ● ● ● ● ● ● ● ● ● ● ● ● ● ● ● ● ● ● ● ● ● ● ● ● ● ● ● ● ● ● ● ● ● ● ● ● ● ● ● ● ● ● ● ● 0.0 0.2 0.4 0.6 0.8 1.0 Am usement Disappointment Indignation Satisf
action Worr y (a) Articles ● ● ● ● ● ● ● ● ● ● ● ● ● ● ● ● ● ● ● ● ● ● ● ● ● ● ● ● ● ● ● ● ● ● ● ● ● ● ● ● ● ● ● ● ● ● ● ● ● ● ● ● ● ● ● ● ● ● ● ● ● ● ● ● ● ● ● ● ● ● ● ● ● ● ● ● ● ● ● ● ● ● ● ● ● ● ● ● ● ● ● ● ● ● ● ● ● ● ● ● ● ● ● ● ● ● ● ● ● ● ● ● ● ● ● ● ● ● ● ● ● ● ● ● ● ● ● ● ● ● ● ● ● ● ● ● ● ● ● ● ● ● ● ● ● ● ● ● ● ● ● ● ● ● ● ● ● ● ● ● ● ● ● ● ● ● ● ● ● ● ● ● ● ● ● ● ● ● ● ● ● ● ● ● ● ● ● ● ● ● ● ● ● ● ● ● ● ● ● ● ● ● ● ● ● ● ● ● ● ● ● ● ● ● ● ● ● ● ● ● ● ● ● ● ● ● ● ● ● ● ● ● ● ● ● ● ● ● ● ● ● ● ● ● ● ● ● ● ● ● ● ● ● ● ● ● ● ● ● ● ● ● ● ● ● ● ● ● ● ● ● ● ● ● ● ● ● ● ● ● ● ● ● ● ● ● ● ● ● ● ● ● ● ● ● ● ● ● ● ● ● ● ● ● ● ● ● ● ● ● ● ● ● ● ● ● ● ● ● ● ● ● ● ● ● ● ● ● ● ● ● ● ● ● ● ● ● ● ● ● ● ● ● ● ● ● ● ● ● ● ● ● ● ● ● ● ● ● ● ● ● ● ● ● ● ● ● ● ● ● ● ● ● ● ● ● ● ● ● ● ● ● ● ● ● ● ● ● ● ● ● ● ● ● ● ● ● ● ● ● ● ● ● ● ● ● ● ● ● ● ● ● ● ● ● ● ● ● ● ● ● ● ● ● ● ● ● ● ● ● ● ● ● ● ● ● ● ● ● ● ● ● ● ● ● ● ● ● ● ● ● ● ● ● ● ● ● ● ● ● ● ● ● ● ● ● ● ● ● ● ● ● ● ● ● ● ● ● ● ● ● ● ● ● ● ● ● ● ● ● ● 0.0 0.2 0.4 0.6 0.8 1.0 Am usement Disappointment Indignation Satisf
action Worr y
[image:3.595.74.472.63.257.2](b) Comments
Figure 1: Box-plots for the reference mood scores of each mood category.
���� ������ ��������
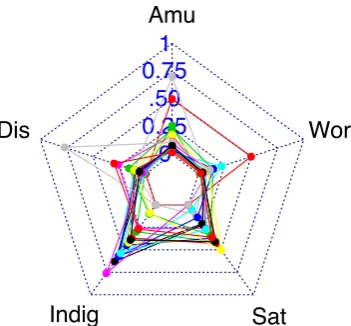
� ���� ��� ���� � ��� ��� ����� ��� ���Figure 2: Spider plot of the reference mood scores from the selected comments. Amusement (Amu), Disappointment (Dis), Indignation (Indig), Satisfaction (Sat), Worry (Wor).
each article are directly obtained from the metadata as an average of the reported users’ mood score for that article. Whereas the mood scores for comments are obtained from the mood scores of the posting user. Mood scores for users are part of users’ personal profiles and describe all the moods they have declared after reading the articles. A portion of the corpus has also been used in (Celli et al., 2014; Celli et al., 2016) to study mood and the relation between mood, personality traits and interaction styles.
For this study, we have collected ≈ 2200 articles and≈ 300K comments to them. The data was pre-processed to remove outliers for each mood category in both articles and comments. Outliers are defined as the mood scores that appear independently in each category. In Figure 1, for instance, for some articles we can observe outlier scores for amused, disappointed and worried. For comments, on the other hand, the outliers are for the satisfied category. Outliers for comments in the amused category have a score above0.4, which are the scores above the upper outer fence in the boxplot.
In Figure 1, we present box-plots of the mood score distribution for the articles and comments, re-spectively. From the figures, we observe that the distribution of the mood categories for both articles and comments are similar. For example, forindignationandsatisfaction, the scores of the data points vary between0.1to0.6. From the data, we also observe that in many cases users tend to annotate articles when the content of an article represents the emotions ofindignationorsatisfaction.
[image:3.595.212.388.291.454.2]Lei scrive Putin comunista ahahahaha. se fosse informato sparebbe che Vladimiri Putin
e' stato 1) membro del partito comunista sovietico 2) spia del KGB 3) spia del KGB nella DDR 4) ha collaborato con la STASI come spia nella DDR. io seguendo la politica
dal 1983 queste cose le sapevo gia' ma basta andare su wikipedia per saperle guardi le
fornisco anche l'indirizzo si informi
[You write that Putin is a communist, ha ha ha. if you were well informed perhaps you'll know that Vladimir Putin was: 1) a member of the communist party in URSS, 2) a KGB
spy, 3) a KGB spy in the DDR, 4) collaborating with STASI as a spy in the DDR. I knew all these things because I'm Following politics since 1983, but you can check Wikipedia, I also provide the URL, will
tell! ] Dis (0.20)
Indig (0.31)
Sat (0.23) Wor
(0.14) Amu
(0.11)
Class label Score (-0.31)
[image:4.595.185.415.69.342.2]Neg
Figure 3: An example of self-reported annotation of a comment with mood scores and category (negative for this example). English translation is provided in italics.
of1token. A closer look at the comments with a higher number of tokens reveals that people usually talk about national issues such as economy, taxes, and environmental causes. There is a difference between article and comments in terms of language style. Naturally, the written style of the articles is more formal, whereas the text in comments is more noisy and informal as it contains repetitions, emoticons, jargon, abbreviations, non-standard grammar, and URLs. The noisy structure is very common in any social media conversation as also reported in (Nguyen et al., 2014; Alam et al., 2013).
In Figure 2, we present a spider-plot with reference mood scores from the selected comments, which range from0 to1. As can be seen in the figure, the mood scores for indignation and satisfaction are higher than for other categories.
For a better understanding of labels such as mood scores and category for comments and articles, in Figure 3 we provide an example of an annotated user comment. In the figure, the comment is labeled with five mood scores for five mood categories as reported by the user. These mood scores are then turned into a class label (see Section 3.2.2) as positive or negative.
The data is split into training, development, and test sets as60%,20%, and20%respectively. The data partitioning will be made available together with the URL links to the articles on GitHub2.
3 Methodology
For prediction of mood score and designing the classification system using both articles and comments, we experiment with different sets of features. The feature sets include of-word-ngrams and bag-of-character-ngrams, part-of-speech ngrams, psycholinguistic, and stylometric features. In addition to studying predictive power of individual feature sets, we have also experimented with their feature level fusion. However, due to low performances, they are not reported.
For the mood score prediction task we use the Random Forests, whereas for the classification task we use Support Vector Machines (SVMs). The choice of algorithms for each task is motivated by our prior research on the topic, e.g. in (Celli et al., 2016) Random Forests outperform SVMs for the prediction
task.
3.1 Features
Bag-of-word-ngram We investigated the bag-of-word-ngrams, with3 >= n >= 1, and their loga-rithmic term frequencies (tf) multiplied with inverse document frequencies (idf) – tf-idf. Although the bag-of-words model has many drawbacks such as data sparsity and high dimensionality, it is the sim-plest and is known to work well for most text-based classification tasks. As bag-of-ngrams representation yields a large dictionary which increases computational cost, we have selected 5K most frequent ngrams.
Bag-of-character-ngram Similar to the word-ngrams, we also extracted and evaluated bag-of-character-ngrams, with6>=n >= 2and tf-idf transformation. The motivation for experimenting with this feature set is its success in sentiment classification task (Abbasi et al., 2008).
Part-of-Speech features (POS): To extract POS features we used TextPro (Pianta et al., 2008) and designed the feature vector using bag-of-ngram representation, with3 >=n >= 1and tf-idf transfor-mation.
Stylometric Features The use of stylometric features has its root in the domain of authorship identifi-cation (Yule, 1939; Abbasi and Chen, 2008; Bergsma et al., 2012; Cristani et al., 2012). Its use has also been reported for text categorization and discourse classification problems (Koppel et al., 2002; Celli et al., ). In authorship identification task, stylometric features are defined ias different groups such as lexical, syntactic, structural, content specific, idiosyncratic and complexity-based (Koppel et al., 2002; Abbasi and Chen, 2008; Cristani et al., 2012). In this work, we use the termstylometricto refer to the complexity-based3features reported in (Tanaka-Ishii and Aihara, 2015; Tweedie and Baayen, 1998). The
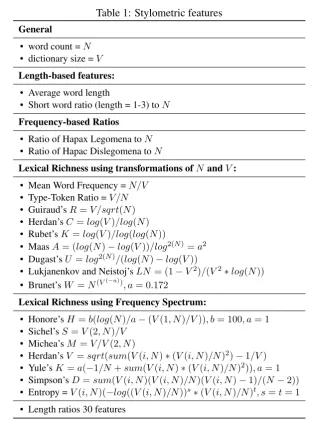
used stylometric feature groups are listed in Table 1.
In addition to the features listed in Table 1, we also extract word and character based low-level features and projected them onto statistical functionals. These include counts of word-ngrams (2 to 3-grams) and character ngram (2 to 4-grams). The statistical functions include mean, median and standard deviation. The total number of the features in the set is97.
Psycholinguistic Features To extract the psycholinguistic features from the articles and comments we utilized the Linguistic Inquiry Word Count (LIWC) (Pennebaker et al., 2001), which is a knowledge-based system developed over the past few decades. The utility of these features has been studied in different research fields such as psychology and sociology, and they are frequently used to study relations between usage of word and attributes such as gender, age, personality, honesty, dominance, deception, and health (Mairesse et al., 2007; Tausczik and Pennebaker, 2010). The utility of these features has also been reported in (Nguyen et al., 2014; Alam and Riccardi, 2014; Danieli et al., 2015).
The types of LIWC features include the following:
• General: word count, average number of words per sentence, a percentage of words found in the
dictionary and percentage of words longer than six letters and numerals.
• Linguistic: pronouns and articles.
• Psychological: affect, cognition, and biological phenomena.
• Paralinguistic: accents, fillers, and disfluencies.
• Personal concerns: work (e.g., job and majors), achievement (e.g., earn, hero, and win) and home (e.g., family).
• Punctuation marks and spoken categories such as assent (e.g., agree, OK and yes) nonfluencies (e.g., Er, hm and umm).
Since LIWC is a knowledge based system, it is packaged with dictionaries for different languages including Italian. In this paper, we use the Italian version of the dictionary (Alparone et al., 2004), which
Table 1: Stylometric features
General
• word count =N
• dictionary size =V
Length-based features:
• Average word length
• Short word ratio (length = 1-3) toN
Frequency-based Ratios
• Ratio of Hapax Legomena toN
• Ratio of Hapac Dislegomena toN
Lexical Richness using transformations ofNandV:
• Mean Word Frequency =N/V
• Type-Token Ratio =V/N
• Guiraud’sR=V/sqrt(N) • Herdan’sC=log(V)/log(N) • Rubet’sK=log(V)/log(log(N))
• MaasA= (log(N)−log(V))/log2(N)=a2 • Dugast’sU =log2(N)/(log(N)−log(V))
• Lukjanenkov and Neistoj’sLN = (1−V2)/(V2∗log(N)) • Brunet’sW =N(V(−a))
, a= 0.172
Lexical Richness using Frequency Spectrum:
• Honore’sH=b(log(N)/a−(V(1, N)/V)), b= 100, a= 1 • Sichel’sS=V(2, N)/V
• Michea’sM =V/V(2, N)
• Herdan’sV =sqrt(sum(V(i, N)∗(V(i, N)/N)2)−1/V) • Yule’sK=a(−1/N+sum(V(i, N)∗(V(i, N)/N)2)), a= 1 • Simpson’sD=sum(V(i, N)(V(i, N)/N)(V(i, N)−1)/(N−2)) • Entropy =V(i, N)(−log((V(i, N)/N))s∗(V(i, N)/N)t, s=t= 1 • Length ratios 30 features
contains 85 word categories. In addition, we have also extracted 5 general descriptors and 12 punctuation categories to yield a total of102features. The LIWC feature processing differs with respect to the type, which includes counts and relative frequencies (see (Tausczik and Pennebaker, 2010)).
3.2 Experiments
In this section, we report experiments on mood score prediction and mood classification. The develop-ment set is used for the preliminary experidevelop-ments and final models are trained by joining training and development sets.
3.2.1 Mood Score Prediction Experiments and Results
For the mood score prediction experiments, we utilized Random Forests as a learning algorithm (Breiman, 2001). It is a decision tree based algorithm where instances and features are randomly sam-pled to generate several trees (forest). Then the score of the forest is computed by averaging the scores from the trees. For this experiment, the number of trees is set to100. We did not optimize the number of trees for the task and plan to address this in the future.
We measure the performance of the mood score prediction system as Root Mean Square Error (RMSE). The performances of models are compared to the baseline that is produced by randomly gen-erating the scores using Gaussian distribution with respect to the prior mean and standard deviation, as presented in Table 2.
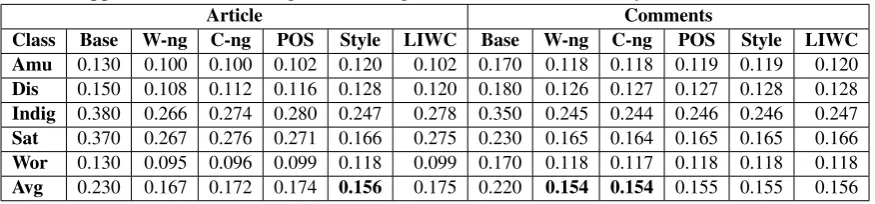
Table 2: Performance of the different feature sets on the test set as RMSE (lower is better). Baseline performances are produced by randomly selecting from the Gaussian distribution with respect to prior mean and standard deviation. Base: Baseline, W-ng: word ngram, C-ng: character ngram. Amusement (Amu), Disappointment (Dis), Indignation (Indig), Satisfaction (Sat), Worry (Wor).
Article Comments
Class Base W-ng C-ng POS Style LIWC Base W-ng C-ng POS Style LIWC
Amu 0.130 0.100 0.100 0.102 0.120 0.102 0.170 0.118 0.118 0.119 0.119 0.120
Dis 0.150 0.108 0.112 0.116 0.128 0.120 0.180 0.126 0.127 0.127 0.128 0.128
Indig 0.380 0.266 0.274 0.280 0.247 0.278 0.350 0.245 0.244 0.246 0.246 0.247
Sat 0.370 0.267 0.276 0.271 0.166 0.275 0.230 0.165 0.164 0.165 0.165 0.166
Wor 0.130 0.095 0.096 0.099 0.118 0.099 0.170 0.118 0.117 0.118 0.118 0.118
Avg 0.230 0.167 0.172 0.174 0.156 0.175 0.220 0.154 0.154 0.155 0.155 0.156
the articles are obtained using stylometric features, and the second best results are obtained using word-ngrams. For the comments, on the other hand, the best results are obtained with the word- and character-ngrams. Moreover, for comments, all the feature sets produce close results. The reason for this might be the noisy nature of comment content, and part-of-speech tags, stylometric and LIWC features might not be able to capture significant information. Yet another reason might be high variation in comment length, thus high feature sparseness. In terms of the performance and the number of features, we speculate that stylometric features might be useful for cross-language/domain experiments.
Nevertheless, compared to the random baseline performances are statistically significant with paired t-testp <0.05for both articles and comments.
3.2.2 Mood Classification Experiments and Results
For the classification task, we first transformed the mood scores into binary classes such as positive and negative. This is done by first computing an overall moodclass label scoreby subtracting the sum of “Disappointment”, “Worry” and “Indignation” scores from the sum of “Amusement” and“Satisfaction” scores (see Equation 1). Then, the score is mapped into either of the two classes – positive and negative – with respect to Equation 2. The instances with the overall score of zero are ignored. As a result,63% of articles are assigned to a negative category and37%to positive. The distribution of comments into negative and positive categories, on the other hand, is more balanced: 53%(negative)vs47%(positive).
class label score= (amusement+satisfaction)−(disappointment+worry+indignation) (1)
class_label_instance(i) =
{
pos if score >0
neg if score <0 (2)
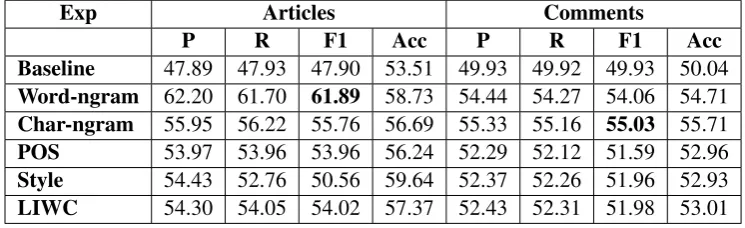
For the task of classification, we train a Support Vector Machines (SVM) (Platt, 1998) model with a linear kernel. The performance is measured in terms of macro-averaged precision, recall, F1-measure, and accuracy. Baseline results are computed by randomly generating the class labels, such as positive or negative, based on the prior class distribution of the training set (i.e. chance baseline) as shown in Table 3.
In Table 3, we present the classification results for the articles and comments. For the articles, we obtain the best results using word-ngrams and the second best result using character-ngrams. For the comments, on the other hand, we observe similar results with both word and character ngrams, however, character-ngram model is slightly better. The performances of POS, LIWC, and stylometric feature sets are lower. Compared to the chance baseline, the results are statistically significant with McNemar’s test andp <0.05.
4 Discussion
Table 3: Classification results on the test set using different feature sets as precision (P), recall (R), F1 measure (F1), and accuracy (Acc).
Exp Articles Comments
P R F1 Acc P R F1 Acc
Baseline 47.89 47.93 47.90 53.51 49.93 49.92 49.93 50.04
Word-ngram 62.20 61.70 61.89 58.73 54.44 54.27 54.06 54.71
Char-ngram 55.95 56.22 55.76 56.69 55.33 55.16 55.03 55.71
POS 53.97 53.96 53.96 56.24 52.29 52.12 51.59 52.96
Style 54.43 52.76 50.56 59.64 52.37 52.26 51.96 52.93
LIWC 54.30 54.05 54.02 57.37 52.43 52.31 51.98 53.01
From the article score prediction experiment, we obtain the best results using stylometric features, which are language independent. Thus, we plan to exploit them for cross-domain and cross-language study.
Regarding the use of self-reported mood annotation, our experiments suggest that for a better under-standing of their reliability, it is necessary to evaluate them through observer/expert annotation. One important issue is that in this self-reported annotations, users have not followed any instructions or have had any psychological instruments while expressing their affective opinions.
5 Conclusion
In this paper, we have presented the work on the prediction and classification of mood from news articles and comments. The self-reported mood annotations were used as a reference signal, and we have exper-imented with different features sets. For the mood score prediction task, the best results were obtained using bag-of-word-ngrams and stylometric features for both articles and comments. For the classifica-tion task, on the other hand, the best results were obtained with bag-of-word-ngrams. The predicclassifica-tion and classification tasks on comments are difficult due to the noisy nature of the data. Since the self-reported data is increasing over time, further expert annotation of the user-reported scores is required for design-ing better automatic systems. Another interestdesign-ing question that we plan to address in the future is how well the mood models generalize across different domains.
Acknowledgments
The research leading to these results has received funding from the European Union - Seventh Frame-work Programme (FP7/2007-2013) under grant agreement n° 610916 - SENSEI - http://www.sensei-conversation.eu/.
References
Ahmed Abbasi and Hsinchun Chen. 2008. Writeprints: A stylometric approach to identity-level identification and similarity detection in cyberspace. ACM Transactions on Information Systems (TOIS), 26(2):7.
Ahmed Abbasi, Hsinchun Chen, and Arab Salem. 2008. Sentiment analysis in multiple languages: Feature selection for opinion classification in web forums.ACM Transactions on Information Systems (TOIS), 26(3):12.
Alexander Pak and Patrick Paroubek. 2010b. Twitter as a corpus for sentiment analysis and opinion mining. InLREc, volume 10, pages 1320–1326.
Alec Go, Richa Bhayani, and Lei Huang. 2009. Twitter sentiment classification using distant supervision. CS224N Project Report, Stanford, 1:12.
Alexander Pak and Patrick Paroubek. 2010a. Twitter as a corpus for sentiment analysis and opinion mining. InLREC, pages 1320–1326.
Bo Pang and Lillian Lee. 2008. Opinion mining and sentiment analysis. Foundations and trends in information retrieval, 2(1-2):1–135.
Cem Akkaya, Janyce Wiebe, and Rada Mihalcea. 2009. Subjectivity word sense disambiguation. InProc. of the Conference on EMNLP, pages 190–199. Association for Computational Linguistics.
Danah Boyd, Scott Golder, and Gilad Lotan. 2010. Tweet, tweet, retweet: Conversational aspects of retweeting on twitter. In
System Sciences (HICSS), 2010 43rd Hawaii International Conference on, pages 1–10. IEEE.
Dmitry Davidov, Oren Tsur, and Ari Rappoport. 2010. Enhanced sentiment learning using twitter hashtags and smileys. In
Proceedings of the 23rd international conference on computational linguistics: posters, pages 241–249. Association for Computational Linguistics.
Erik Cambria, Soujanya Poria, Rajiv Bajpai, and Björn Schuller. 2016a. Senticnet 4: A semantic resource for sentiment analysis based on conceptual primitives. Inthe 26th International Conference on Computational Linguistics (COLING), Osaka.
Erik Cambria, Björn Schuller, Yunqing Xia, and Bebo White. 2016b. New avenues in knowledge bases for natural language processing.Knowledge-Based Systems, 108(C):1–4.
Erik Cambria. 2016. Affective computing and sentiment analysis.IEEE Intelligent Systems, 31(2):102–107.
Emilio Ferrara and Zeyao Yang. 2015. Quantifying the effect of sentiment on information diffusion in social media. PeerJ Computer Science, 1:e26.
Efthymios Kouloumpis, Theresa Wilson, and Johanna Moore. 2011. Twitter sentiment analysis: The good the bad and the omg! InICWSM.
Emanuele Pianta, Christian Girardi, and Roberto Zanoli. 2008. The textpro tool suite. InLREC. Citeseer.
Fabio Celli, Evgeny A. Stepanov, and Giuseppe Riccardi. Tell me who you are, i’ll tell whether you agree or disagree: Prediction of agreement/disagreement in news blog.
Fabio Celli, Giuseppe Riccardi, and Arindam Ghosh. 2014. Corea: Italian news corpus with emotions and agreement. In
Proceedings of the First Italian Conference on Computational Linguistics CLiC-it 2014 & and of the Fourth International Workshop EVALITA 2014, pages 98–102. Pisa University Press.
Fabio Celli, Arindam Ghosh, Firoj Alam, and Giuseppe Riccardi. 2016. In the mood for sharing contents: Emotions, person-ality and interaction styles in the diffusion of news. Information Processing & Management, 52(1):93–98.
Firoj Alam and Giuseppe Riccardi. 2014. Fusion of acoustic, linguistic and psycholinguistic features for speaker personality traits recognition. InProc. of ICASSP, pages 955–959, May.
Firoj Alam, Evgeny A Stepanov, and Giuseppe Riccardi. 2013. Personality traits recognition on social network-facebook. F. Alparone, S. Caso, A. Agosti, and A. Rellini. 2004. The italian liwc2001 dictionary. Technical report, LIWC.net, Austin,
TX.
FA Kunneman, CC Liebrecht, and APJ van den Bosch. 2014. The (un) predictability of emotional hashtags in twitter. François Mairesse, Marilyn A Walker, Matthias R Mehl, and Roger K Moore. 2007. Using linguistic cues for the automatic
recognition of personality in conversation and text.J. Artif. Intell. Res.(JAIR), 30:457–500.
Fiona J Tweedie and R Harald Baayen. 1998. How variable may a constant be? measures of lexical richness in perspective.
Computers and the Humanities, 32(5):323–352.
G Udny Yule. 1939. On sentence-length as a statistical characteristic of style in prose: With application to two cases of disputed authorship.Biometrika, 30(3/4):363–390.
Gilad Mishne et al. 2005. Experiments with mood classification in blog posts. InProceedings of ACM SIGIR 2005 workshop on stylistic analysis of text for information access, volume 19, pages 321–327. Citeseer.
Georgios Paltoglou and Mike Thelwall. 2010. A study of information retrieval weighting schemes for sentiment analysis. In
Proc. of the 48th ACL, pages 1386–1395. ACL.
Giuseppe Riccardi, Frederic Bechet, Morena Danieli, Benoit Favre, Robert Gaizauskas, Udo Kruschwitz, and Massimo Poesio. 2015. The sensei project: Making sense of human conversations. InInternational Workshop on Future and Emergent Trends in Language Technology, pages 10–33. Springer.
Hugo Liu. 2007. Social network profiles as taste performances. Journal of Computer-Mediated Communication, 13(1):252– 275.
James W Pennebaker, Martha E Francis, and Roger J Booth. 2001. Linguistic inquiry and word count: Liwc 2001. Mahway: Lawrence Erlbaum Associates, 71.
Johan Bollen, Huina Mao, and Alberto Pepe. 2011. Modeling public mood and emotion: Twitter sentiment and socio-economic phenomena. InProc. of ICWSM, pages 1–10.
John Platt. 1998. Sequential minimal optimization: A fast algorithm for training support vector machines. Technical report, Microsoft Research.
Kumiko Tanaka-Ishii and Shunsuke Aihara. 2015. Computational constancy measures of texts—yule’s k and rényi’s entropy.
Computational Linguistics.
Leo Breiman. 2001. Random forests.Machine learning, 45(1):5–32.
Marco Cristani, Giorgio Roffo, Cristina Segalin, Loris Bazzani, Alessandro Vinciarelli, and Vittorio Murino. 2012. Conversationally-inspired stylometric features for authorship attribution in instant messaging. InProc. 20th ACM Multi-media, pages 1121–1124. ACM.
Moshe Koppel, Shlomo Argamon, and Anat Rachel Shimoni. 2002. Automatically categorizing written texts by author gender.
Literary and Linguistic Computing, 17(4):401–412.
Mike Thelwall, Kevan Buckley, and Georgios Paltoglou. 2011. Sentiment in twitter events.JASIST, 62(2):406–418.
Thin Nguyen, Dinh Phung, Brett Adams, Truyen Tran, and Svetha Venkatesh. 2010. Classification and pattern discovery of mood in weblogs. InAdvances in knowledge discovery and data mining, pages 283–290. Springer Berlin Heidelberg. Thin Nguyen, Dinh Phung, Brett Adams, and Svetha Venkatesh. 2014. Mood sensing from social media texts and its
applica-tions.Knowledge and information systems, 39(3):667–702.
Shane Bergsma, Matt Post, and David Yarowsky. 2012. Stylometric analysis of scientific articles. InProc. of the NACL, pages 327–337. ACL.
Stefan Stieglitz and Linh Dang-Xuan. 2013. Emotions and information diffusion in social media—sentiment of microblogs and sharing behavior.Journal of Management Information Systems, 29(4):217–248.
Vernon Turner, John F Gantz, David Reinsel, and Stephen Minton. 2014. The digital universe of opportunities: Rich data and the increasing value of the internet of things.IDC Analyze the Future.