Proceedings of the Tenth Workshop on Innovative Use of NLP for Building Educational Applications, 2015, pages 207–212,
Generating Reference Texts for Short Answer Scoring Using Graph-based
Summarization
Lakshmi Ramachandran1 and Peter Foltz1,2 1Pearson,2University of Colorado
{lakshmi.ramachandran,peter.foltz}@pearson.com
Abstract
Automated scoring of short answers often in-volves matching a students response against one or more sample reference texts. Each reference text provided contains very spe-cific instances of correct responses and may not cover the variety of possibly correct re-sponses. Finding or hand-creating additional references can be very time consuming and expensive. In order to overcome this problem we propose a technique to generate alterna-tive reference texts by summarizing the con-tent of top-scoring student responses. We use a graph-based cohesion technique that extracts the most representative answers from among the top-scorers. We also use a state-of-the-art extractive summarization tool called MEAD. The extracted set of responses may be used as alternative reference texts to score student re-sponses. We evaluate this approach on short answer data from Semeval 2013’s Joint Stu-dent Response Analysis task.
1 Introduction
Short answer scoring is a critical task in the field of automated student assessment. Short answers con-tain brief responses restricted to specific terms or concepts. There is a great demand for new tech-niques to handle large-scale development of short-answer scoring engines. For example an individual state assessment may involve building scoring algo-rithms for over two hundred prompts (or questions). The past few years have seen a growth in the amount of research involved in developing better features and scoring models that would help improve short answer scoring (Higgins et al., 2014; Leacock and
Table 1: Question text, sample reference and some top-scoring an-swers from a prompt in the ASAP-SAS (2012) competition.
Prompt question: “Explain how pandas in China are similar to koalas in Australia and how they both are different from pythons. Support your response with information from the article.”
Sample reference answer: “Specialists are limited geographi-cally to the area of their exclusive food source. Pythons are differ-ent in both diet or eating habits and habitat from koalas. Gener-alists are favored over speciGener-alists. Adaptability to change. Koalas and pandas are herbivores and pythons are carnivores.”
Some top-scoring student responses: “A panda and a koala are both vegetarians. Pandas eat bamboo, and koalas eat eucalyptus leaves. Pythons are not vegetarians they eat meat, and they kill there pray by strangling them or putting venom into them.” “Pandas and koalas are both endangered animals. They can only be found in certain places where their food supply is. They are different from pythons because they move to a new environment and adapt as well. They be at a loss of food and climate change.”
Chodorow, 2003). The Automated Student Assess-ment Prize (ASAP-SAS (2012)) competition had a short answer scoring component.
Short answer datasets are typically provided with one or more sample human references, which are representative of ideal responses. Student responses that have a high text overlap with these human refer-ences are likely to get a higher score than those that have a poor overlap. However often these sample human references are not representative ofall pos-sible correct responses. For instance consider the question, sample reference and a set of top-scoring student responses for a prompt from the ASAP-SAS (2012) competition in Table 1. The human reference provided does not encompass all possible alternative ways of expressing the correct response.
dent responses to determine their scores. Mitchell et al. (2003) use a mark scheme consisting of a set of acceptable or unacceptable answers. This marking scheme is similar to a sample reference. Each student response is matched with these mark-ing schemes and scored accordmark-ingly. The winner of the ASAP competition spent a lot of time and ef-fort hand-coding regular expressions from the hu-man samples provided, in order to obtain better matches between student responses and references (Tandalla, 2012). Although hand-crafting features might seem feasible for a few prompts, it is not an efficient technique when scoring large datasets con-sisting of thousands of prompts. Hence there is a need to develop automated ways of generating alter-nate references that are more representative of top-scoring student responses.
We use two summarization techniques to identify alternative references from top-scoring student re-sponses for a prompt. Klebanov et al. (2014) use summarization to generate content importance mod-els from student essays. We propose a graph-based cohesion technique, which uses text structure and semantics to extract representative responses. We also use a state-of-the-art summarization technique called MEAD (Radev et al., 2004), which extracts a summary from a collection of top-scoring responses. The novelty of our work lies in the utilization of summarization to the task of identifying suitable ref-erences to improve short-answer scoring.
2 Approach
Top-scoring responses from each prompt or question are summarized to identify alternate reference texts with which student responses could be compared to improve scoring models.
2.1 Graph-based Cohesion Technique
We use an agglomerative clustering technique to group lexico-semantically close responses into clus-ters or topics. The most representative responses are extracted from each of the clusters to form the set of alternate references. Just as in a cohesion-based method only the most well-connected vertices are taken to form the summary (Barzilay and Elhadad, 1997), likewise in our approach responses with the highest similarities within each cluster are selected
as representatives.
Steps involved in generating summaries are:
Generating Word-Order Graphs: Each top-scoring response is first represented as a word-order graph. We use a word-word-order graph represen-tation because it captures structural information in texts. Graph matching makes use of the ordering of words and context information to help identify lexi-cal changes. According to Makatchev and VanLehn (2007) responses classified by human experts into a particular semantic class may be syntactically dif-ferent. Thus word-order graphs are useful to iden-tify representatives from a set of responses that are similar in meaning but may be structurally different. During graph generation, each response is tagged with parts-of-speech (POS) using the Stanford POS tagger (Toutanova et al., 2003). Contiguous subject components such as nouns, prepositions are grouped to form a subject vertex, while contiguous verbs or modals are grouped into a verb vertex and so on for the other POS types. Ordering is maintained with the edges capturing subject—verb, verb—object, subject—adjective or verb—adverb type of informa-tion. Graph generation has been explained in detail in Ramachandran and Gehringer (2012).
Calculating Similarity:In this step similarities be-tween all pairs of top-scoring responses are calcu-lated. Similarities between pairs of responses are used to cluster them and then identify representative responses from each cluster. Similarityis the aver-age of the best vertex and edge matches.
Similarity(A, B) = 1
2(|VA|+1|VB|(
P ∀VA
argmax
∀VB
{sem(VA, VB)}
+P
∀VB argmax
∀VA
{sem(VB, VA)})+
1
|EA|+|EB|(
P ∀EA
argmax
∀EB
{seme(EA, EB)}
+ P
∀EB argmax
∀EA
{seme(EB, EA)}))
(1)
In equation 1VAandVBare the vertices andEA
andEBare the edges of responsesAandB
respec-tively. We identify the best semantic match for every vertex or edge in responseAwith a vertex or edge in responseB respectively (and vice-versa). semis identified using WordNet (Fellbaum, 1998).
Ini-tially every cluster’s similarity is set to0. A cluster’s similarity is the average of the similarity between all pairs of responses it contains.
We rank response pairs based on their similarity (highest to lowest) using merge sort, and assign one response in a pair to the other’s cluster provided it satisfies the condition in Equation 2. The condition ensures that a response (S) that is added to a cluster (C) has high similarity, i.e., is close in meaning and context to that cluster’s responses (SC).
C.clusterSimilarity− X ∀SC∈C
Similarity(S, SC)
|C|
!
≤α (2)
The choice of cluster to which a response is added depends on the cluster’s similarity, i.e., a response is added to the cluster with higher similarity. If both responses (in the pair) have same cluster similari-ties, then the larger cluster is chosen as the target. If cluster similarity and the number of responses are the same, then the target is selected randomly.
Identifying Representatives: In this step the most representative responses from each cluster are iden-tified. The aim is to identify the smallest set of rep-resentatives that cover every other response in the cluster. We use a list heuristic to handle this prob-lem (Avis and Imamura, 2007). We order responses in every cluster based on (a) decreasing order of their average similarity values, and (b) decreasing order of the number of responses they are adjacent to.
Our approach ensures that responses with the highest semantic similarity that cover previously uncovered responses are selected. Representatives from all clusters are grouped together to generate the representative responses for a prompt.
2.2 MEAD
We use MEAD as an alternative summarization ap-proach. Radev et al. (2004) proposed the use an au-tomated multi-document summarization technique called MEAD. MEAD was developed at the Univer-sity of Michigan as a centroid-based summarization approach. MEAD is an extractive summarization approach that relies on three features: position, cen-troid and the length of sentences to identify the sum-mary. MEAD’s classifier computes a score for each sentence in the document using a linear combination of these three features. Sentences are then ranked
based on their scores and the top ranking sentences are extracted to generate summaries. The extraction can be restricted to the top N words to generate a summary of specified length.
In our study each document contains a list of scoring responses from the dataset, i.e., each top-scoring response would constitute a sentence. For our study we use MEAD1 to extract summaries of
length that match the lengths of the summaries gen-erated by the graph-based cohesion technique.
3 Experiment
3.1 Data
Semeval’s Student Response Analysis (SRA) corpus contains short answers from two different sources: Beetle and SciEntsBank (Dzikovska et al., 2013)2.
Beetle contains responses extracted from transcripts of interactions between students and the Beetle II tu-toring system (Dzikovska et al., 2010). The SciEnts-Bank dataset contains short responses to questions collected by Nielsen et al. (2008).
Beetle contains 47 questions and 4380 student re-sponses, and SciEntsBank contains 135 questions and 5509 student responses (Dzikovska et al., 2013). Each dataset is classified as: (1) 5-way, (2) 3-way and (3) 2-3-way. The data in the SRA corpus was annotated as follows for the 5-way classifica-tion: correct: student response that is correct, par-tially correct incomplete: response that is correct but does not contain all the information in the ref-erence text,contradictory:response that contradicts the reference answer,irrelevant:response that is rel-evant to the domain but does not contain information in the reference,non domain: response is not rele-vant to the domain. The 3-way classification con-tains the contradictory, correct and incorrect classes, while the 2-way classification contains correct and incorrect classes.
Dzikovska et al. (2013) provide a summary of the results achieved by teams that participated in this task. Apart from the dataset, the organizing com-mittee also released code for a baseline, which in-cluded lexical overlap measures. These measures
1We use the code for MEAD (version 3.10) available at
http://www.summarization.com/mead/.
2The data is available athttp://www.cs.york.ac.
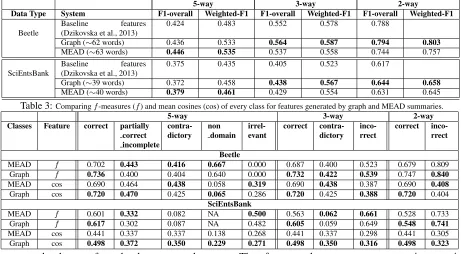
Table 2: Comparing performance of system-generated summaries of top-scoring short answers with the performance of sample reference texts provided for the Semeval dataset.
5-way 3-way 2-way
Data Type System F1-overall Weighted-F1 F1-overall Weighted-F1 F1-overall Weighted-F1
Beetle Baseline(Dzikovska et al., 2013)features 0.424 0.483 0.552 0.578 0.788
Graph (∼62 words) 0.436 0.533 0.564 0.587 0.794 0.803
MEAD (∼63 words) 0.446 0.535 0.537 0.558 0.744 0.757
SciEntsBank Baseline(Dzikovska et al., 2013)features 0.375 0.435 0.405 0.523 0.617
Graph (∼39 words) 0.372 0.458 0.438 0.567 0.644 0.658
[image:4.612.74.535.96.350.2]MEAD (∼40 words) 0.379 0.461 0.429 0.554 0.631 0.645
Table 3:Comparingf-measures (f) and mean cosines (cos) of every class for features generated by graph and MEAD summaries.
5-way 3-way 2-way
Classes Feature correct partially correct incomplete
contra-dictory nondomain irrel-evant correct contra-dictory inco-rrect correct inco-rrect
Beetle
MEAD f 0.702 0.443 0.416 0.667 0.000 0.687 0.400 0.523 0.679 0.809 Graph f 0.736 0.400 0.404 0.640 0.000 0.732 0.422 0.539 0.747 0.840
MEAD cos 0.690 0.464 0.438 0.058 0.319 0.690 0.438 0.387 0.690 0.408
Graph cos 0.720 0.470 0.425 0.065 0.286 0.720 0.425 0.388 0.720 0.404
SciEntsBank
MEAD f 0.601 0.332 0.082 NA 0.500 0.563 0.062 0.661 0.528 0.733 Graph f 0.617 0.302 0.087 NA 0.482 0.605 0.059 0.649 0.548 0.741
MEAD cos 0.441 0.337 0.337 0.138 0.268 0.441 0.337 0.298 0.441 0.305 Graph cos 0.498 0.372 0.350 0.229 0.271 0.498 0.350 0.316 0.498 0.323 compute the degree of overlap between student
re-sponses and sample reference texts and the prompt or question texts. Both human references as well as question texts were provided with the dataset. The lexical overlap measures include: (1) Raw count of the overlaps between student responses and the sam-ple reference and question texts, (2) Cosine similar-ity between the compared texts, (3) Lesk similarsimilar-ity, which is the sum of square of the length of phrasal overlaps between pairs of texts, normalized by their lengths (Pedersen et al., 2002) and (4) f-measure of the overlaps between the compared texts3. These
four features are computed for the sample reference text and the question text, resulting in a total of eight features. We compute these eight features for every system and compare their raw and weighted (by their class distributions)f-measure values.
3.2 Results and Discussion
The graph-based cohesion technique produced sum-maries containing an average of 62 words for Bee-tle and an average of 39 words for SciEntsBank.
3f-measure is the harmonic mean of the precision and
re-call of the degree of overlaps between two texts. Precision is computed as the number of overlaps divided by the length of student response, while recall of overlap is computed as the de-gree of overlap divided by the number of tokens in the human reference text.
Therefore, we chose to extract summaries contain-ing nearly the same number of words uscontain-ing the MEAD summarization tool.
From the results in Table 24 we see that,
com-pared to the baseline approach, the summarization approaches are better at scoring short answers. We also tested the use of all top-scoring student re-sponses as alternate references (i.e. with no sum-marization). These models perform worse than the baseline, producing an averagedecrease in overall f-measure of 14.7% for Beetle and 14.3% for Sci-EntsBank. This suggests the need for a summariza-tion technique. Our results indicate that the summa-rizers produce representative sentences that are more useful for scoring than just the sample reference text. MEAD performs better on the 5-way task while the graph-based cohesion approach performs well on 3-way and 2-3-way classification tasks.
In the case of both the datasets, the performance of the graph-based approach on the “correct” class is higher. We looked at the average cosine sim-ilarity for data from each class with their
corre-4We report results only on the unseen answers test set from
Table 4:Comparing references generated by the summarizers with a sample reference for a prompt from the Beetle dataset.
Sample Reference: “Terminal 1 and the positive terminal are separated by the gap OR Terminal 1 and the posi-tive terminal are not connected. OR Terminal 1 is connected to the nega-tive battery terminal. OR Terminal 1 is not separated from the negative bat-tery terminal. OR Terminal 1 and the positive battery terminal are in differ-ent electrical states”
Graph-based Cohesion: “The terminal is not connected to the positive battery terminal. OR The terminals are not connected. OR The positive bat-tery terminal and terminal 1 are not connected. OR Because there was not direct connection between the positive terminal and bulb terminal 1. OR Ter-minal one is connected to the negative terTer-minal and terminal 1 is separated from the positive terminal by a gap. OR The positive battery terminal is sepa-rated by a gap from terminal 1.”
MEAD: “Positive battery terminal is sepa-rated by a gap from terminal 1. OR Termi-nal 1 is not connected to the positive termi-nal. OR Because there was not direct con-nection between the positive terminal and bulb terminal 1. OR The terminals are not connected. OR Because they are not con-nected. OR Terminal 1 is connected to the negative battery terminal. OR The two earnt connected.”
sponding reference texts (Table 3). Magnitude of the average cosine between student responses and the reference texts for classes such as non domain and partially correct incomplete in Beetle and for non domain, partially correct incomplete, contra-dictory and irrelevant in SciEntsBank are higher in case of the graph-based approach than MEAD. As a result, the graph’s features tend to classify more data points as correct, leaving fewer data points to be classified into the other classes, thus producing lowerf-measures in both datasets.
In the case of 3-way and 2-way classifications, performance on the correct class was higher for the graph-based approach (Table 3). The cosine simi-larity between the correct data and the summaries from the graph-based approach are higher than the cosines between the correct data and MEAD’s sum-maries. The graph-based approach tends to predict more of the correct data points accurately, resulting in an improvement in the graph-based approach’s performance. A similar trend was observed in the case of the 2-way classification.
Sample reference and representatives from the graph-based approach and MEAD for question BULB C VOLTAGE EXPLAIN WHY1 from Bee-tle are listed in Table 4. The samples follow the structure X and Y are<relation>OR X<relation> Y. A correct response such as “The terminals are not connected.” would get a low match with these sam-ples. Both the graph-based approach and MEAD ex-tract references that may be structurally different but have the same meaning.
The team that performed best on the Semeval competition on both the Beetle and SciEntsBank datasets for the unseen answers task (Heilman and Madnani, 2013), used the baseline features (listed above) as part of their models. CoMeT was another team that performed well on Beetle on the unseen answers dataset (Ott et al., 2013). They did not use
the baseline features directly but did use the sample reference text to generate several text overlap mea-sures. Since the best performing models used sam-ple references to generate useful features, the use of representative sentences generated by a summariza-tion approach is likely to help boost the performance of these models. We have not been able to show the improvement to the best models from Semeval since the code for the best models have not been made available. These alternate references also generate improved baselines, thus encouraging teams partici-pating in competitions to produce better models.
4 Conclusion
In this paper we demonstrated that an automated approach to generating alternate references can im-prove the performance of short answer scoring mod-els. Models would benefit a great deal from the use of alternate references that are likely to cover more types of correct responses than the sample. We eval-uated two summarization techniques on two short answer datasets: Beetle and SciEntsBank made available through the Semeval competition on stu-dent response analysis. We showed that references generated from the top-scoring responses by the graph-based cohesion approach and by MEAD per-formed better than the baseline containing the sam-ple reference.
References
ASAP-SAS. 2012. Scoring short answer essays. ASAP short answer scoring competition system description.
http://www.kaggle.com/c/asap-sas/. David Avis and Tomokazu Imamura. 2007. A list
heuris-tic for vertex cover. volume 35, pages 201–204. Else-vier.
Lyle F Bachman, Nathan Carr, Greg Kamei, Mikyung Kim, Michael J Pan, Chris Salvador, and Yasuyo Sawaki. 2002. A reliable approach to automatic as-sessment of short answer free responses. In Proceed-ings of the 19th international conference on Computa-tional linguistics-Volume 2, pages 1–4. Association for Computational Linguistics.
Regina Barzilay and Michael Elhadad. 1997. Using lex-ical chains for text summarization. InIn Proceedings of the ACL Workshop on Intelligent Scalable Text Sum-marization, pages 10–17.
Myroslava O Dzikovska, Johanna D Moore, Natalie Steinhauser, Gwendolyn Campbell, Elaine Farrow, and Charles B Callaway. 2010. Beetle ii: a sys-tem for tutoring and computational linguistics exper-imentation. In Proceedings of the ACL 2010 System Demonstrations, pages 13–18. Association for Com-putational Linguistics.
Myroslava O Dzikovska, Rodney D Nielsen, Chris Brew, Claudia Leacock, Danilo Giampiccolo, Luisa Ben-tivogli, Peter Clark, Ido Dagan, and Hoa T Dang. 2013. Semeval-2013 task 7: The joint student re-sponse analysis and 8th recognizing textual entailment challenge. Technical report, DTIC Document. Christiane Fellbaum. 1998. Wordnet: An electronic
lex-ical database.MIT Press.
Michael Heilman and Nitin Madnani. 2013. ETS: Do-main adaptation and stacking for short answer scoring. In Proceedings of the 2nd joint conference on lexical and computational semantics, volume 2.
Derrick Higgins, Chris Brew, Michael Heilman, Ramon Ziai, Lei Chen, Aoife Cahill, Michael Flor, Nitin Mad-nani, Joel Tetreault, Dan Blanchard, Diane Napoli-tano, Chong Min Lee, and John Blackmore. 2014. Is getting the right answer just about choosing the right words? The role of syntactically-informed features in short answer scoring. arXiv.
Beata Beigman Klebanov, Nitin Madnani, Swapna Soma-sundaran, and Jill Burstein. 2014. Content importance models for scoring writing from sources. In Proceed-ings of the 52nd Annual Meeting of the Association for Computational Linguistics (Volume 2: Short Pa-pers), pages 247–252. Association for Computational Linguistics.
Claudia Leacock and Martin Chodorow. 2003. C-rater: Automated scoring of short-answer questions.
In Computers and the Humanities, volume 37, pages 389–405. Springer.
Maxim Makatchev and Kurt VanLehn. 2007. Combining bayesian networks and formal reasoning for semantic classification of student utterances. InProceedings of the 2007 Conference on Artificial Intelligence in Ed-ucation: Building Technology Rich Learning Contexts That Work, pages 307–314, Amsterdam, The Nether-lands.
Tom Mitchell, Nicola Aldridge, and Peter Broomhead. 2003. Computerised marking of short-answer free-text responses. InManchester IAEA conference. Rodney D Nielsen, Wayne Ward, James H Martin, and
Martha Palmer. 2008. Annotating students’ under-standing of science concepts. InLREC.
Niels Ott, Ramon Ziai, Michael Hahn, and Detmar Meur-ers. 2013. Comet: integrating different levels of lin-guistic modeling for meaning assessment.
Ted Pedersen, Satanjeev Banerjee, and Siddharth Pat-wardhan. 2002. Lesk similarity.http://search. cpan.org/dist/Text-Similarity/lib/ Text/Similarity/Overlaps.pm.
Stephen G Pulman and Jana Z Sukkarieh. 2005. Au-tomatic short answer marking. InProceedings of the second workshop on Building Educational Applica-tions Using NLP, pages 9–16.
Dragomir R Radev, Hongyan Jing, Małgorzata Sty´s, and Daniel Tam. 2004. Centroid-based summarization of multiple documents. Information Processing & Man-agement, 40(6):919–938.
Lakshmi Ramachandran and Edward F. Gehringer. 2012. A word-order based graph representation for relevance identification (poster). Proceedings of the 21st ACM Conference on Information and Knowledge Manage-ment, pages 2327–2330, October.
Luis Tandalla. 2012. Scoring short answer essays. ASAP short answer scoring competition–Luis Tandalla’s approach. https://kaggle2.blob.core. windows.net/competitions/kaggle/ 2959/media/TechnicalMethodsPaper. pdf.