Twitter User Gender Inference Using Combined Analysis
of Text and Image Processing
Shigeyuki Sakaki, Yasuhide Miura, Xiaojun Ma, Keigo Hattori, and Tomoko Ohkuma
Fuji Xerox Co., Ltd. / Japan
6-1, Minatomirai, Nishi-ku, Yokohama-shi, Kanagawa
{sakaki.shigeyuki, yasuhide.miura, xiaojun.ma, keigo.hattori,
ohkuma.tomoko}@fujixerox.co.jp
Abstract
Profile inference of SNS users is valuable for marketing, target advertisement, and opinion polls. Sev-eral studies examining profile inference have been reported to date. Although information of various types is included in SNS, most such studies only use text information. It is expected that incorporating information of other types into text classifiers can provide more accurate profile inference. As de-scribed in this paper, we propose combined method of text processing and image processing to im-prove gender inference accuracy. By applying the simple formula to combine two results derived from a text processor and an image processor, significantly increased accuracy was confirmed.
1
Introduction
Recently, several researches on profile inference of Social Networking Services (SNS) user conducted by analyzing postings have been reported (Rao and Yarowsky, 2010; Han et al., 2013; Makazhanov et al., 2013). User profile information such as gender, age, residential area, and political preference have attracted attention because they are helpful for marketing, target advertisement, TV viewer rate calcu-lations, and opinion polls. The major approach to this subject is building a machine learning classifier trained by text in postings. However, images posted by a user are rarely used in profile inference. Im-ages in postings also include features of user profiles. For example, if a user posts many dessert imag-es, then the user might be female. Therefore, we assumed that highly accurate profile inference will be available by analyzing image information and text information simultaneously.
As described in this paper, we implement gender inference of Japanese Twitter user using text in-formation and image inin-formation. We propose a combined method consisting of text processing and image processing, which accepts tweets as input data and outputs a gender probability score. The combined method comprises of two steps: step 1) two gender probability scores are inferred respec-tively by a text processor and an image processor; step 2) the combined score is calculated by merging two gender scores with an appropriate ratio. This report is the first describing an attempt to apply the combined method of text processing and image processing to profile inference of an SNS user.
This paper is presented as seven sections: section 2 presents a description of prior work; section 3 presents a description of the annotation data prepared for this study; section 4 introduces the proposed method; section 5 explains preliminary experiments for optimizing the combined method parameter; section 6 presents the experimentally obtained result; section 7 summarizes the paper and discusses future work.
2
Prior Work
Many reports have described studies examining gender inference. The conventional approach to this theme is building a machine learning classifier such as Support Vector Machine (SVM) trained by text features (Burger et al., 2011; Liu et al., 2012). Most of these studies specifically examine im-provement of the machine classification methodology rather than expanding features or combining features. Different from these studies, Liu et al. (2013) implemented gender inference with incorpora-tion of a user name into the classifier based on text informaincorpora-tion. However, the expansion of features
This work is licensed under a Creative Commons Attribution 4.0 International License. Page numbers and pro-ceedings footer are added by the organisers. License details: http://creativecommons.org/licenses /by/4.0/
remains in the text field.
A few reports in the literature describe studies of systems that infer the SNS user gender with in-formation aside from the text. Ikeda et al. (2013) leverages the accuracy of profile inference based on a text feature classifier by combining user cluster information. According to their study, the accuracy of classification that deals only with the user cluster is lower than that of the text classifier. The classifier using both text and cluster information of a user outperforms their text classifier. This research shows that information aside from the text is useful to leverage the performance of profile inference based on text and text information is necessary to achieve high accuracy. However, we introduce image infor-mation that is not used by Ikeda et al (2013).
Along with text information and cluster information, images are popular informative elements that are included in SNS postings. An image includes enough information to infer what is printed in itself, and researches to automatically annotate an image with semantic labels are already known (Zhang et al., 2012). Automatic image annotation is a machine learning technique that involves a process by which a computer system automatically assigns semantic labels to a digital image. These studies suc-ceeded in inferences of various objects, such as person, dog, bicycle, chair etc. We supposed that such objects in images posted by a user should be useful clues as to a profile inference of a twitter user. As a matter of fact, gender inference by image information is reported by Ma et al. (2014), which imple-mented gender inference by processing images in tweets. Their study, which ignored text information, exhibited accuracy of less than 70%. It was much lower than most gender inference work using text feature.
From results of these studies, we concluded that gender inference by text and image information invites further study.
3
Proposed Method
Our proposed method for combining text processing and image processing is presented in Figure 1. First, data of 200 tweets of a user are separated into text data and image data. Each of separated data is analyzed using a dedicated processor, a text processor, and an image processor. Both of the processors
Figure 1. Combined method constitution.
text
Gender classifier
Gender probability score of a user
Image
Combined method
Combined gender probability score of a user
Text Processor Image Processor
Gender probability score of a user Object Classifiers
Object probability scores
Consolidation of scores
Food-ma le cla ssifiers
Food-fema le cla ssifiers
Pet-fema le cla ssifiers Toy ma le
cla ssifiers
Food-ma le proba bility score of a n ima ge
Food-fema le proba bility score of a n ima ge
Toy-ma le proba bility score of a n ima ge
Pet-fema le proba bility score of a n ima ge
output a user’s gender probability score, the upper/lower ends of which respectively correspond to male and female labels. At the end of this process, the combined gender probability score is calculated using two probability scores. In this section, details of the two processors and the method of combin-ing their two results are described.
3.1 Text Processing
The text processor is constructed from a text classifier, which accepts text data in tweets and outputs the gender probability score of a user. We defined the gender classifier in the text processor as an SVM binary classification of a male and female. The SVM classifier is trained based on unigram Bag-of-words with a linear kernel. The cost parameter C is set to 1.0. Then LIBSVM (Chang and Lin, 2001) is used as an implementation of SVM. Because words are not divided by spaces in a Japanese sentence, Kuromoji (Atilika, 2011), a morphological analysis program for Japanese, is used to obtain unigrams.
To combine two results from the text processor and the image processor, it is necessary to calculate each result as a probability value. To retrieve probability scores, we used logistic regression. Logistic function converts a distance from a hyper plane to probability scores of 0.0–1.0. The text classifier is a male and female binary classification. Therefore, the upper and lower ends of the probability score respectively correspond to male and female data. If a score is close to 0.0, then the user has high prob-ability of being male. If it is close to 1.0, then a user is probably female.
3.2 Image Processing
We first tried to infer a Twitter user gender directly by a two-class classifier trained by image feature vector calculated by all images posted by a user. However, with some preliminary experiments, we found that this approach does not work well, since the large variation of objects made the classifica-tion difficult with single classifier setting. We, therefore, used the image processing method described by Ma et al. (2014) which uses automatic image annotation classifiers (Zhang et al., 2012) to model human recognition of different gender tendency in images. The method consists of two steps: step 1) annotating images by an image annotation technique at the image level; step 2) consolidating gender scores according to annotation results at the user level.
In the first step, the image labels are defined as the combination of the following two information: the gender tendency in images of a user and the objects that images express. Ma et al. (2014) defined 10 categories of objects in SNS images based on observation on a real dataset. The defined labels are cartoon/illustration, famous person, food, goods, memo/leaflet, outdoor/nature, person, pet, screen-shot/capture, and other. They also indicated that gender tendency in images are coherent with user gender, and set three gender labels, male, female, and unknown, for each object label. As a result, 30 labels constructed from object label and gender label (e.g. “male-person”) are used in this paper, which is described in section 4.2. Then a bag-of-features (BOF) model (Tsai, 2012; Chatfield et al., 2011) is applied to accomplish the image annotation task. We used local descriptors of SIFT (Lowe, 1999) and image features are encoded with a k-mean generated codebook with size of 2000. We ap-plied LLC (Wang et al, 2010) and SPM (Lazebnik et al, 2006) to generating the final presentation of image features. Then, the 30 SVM classifiers are trained based on the features of training images: each classifier is trained per image label among one-versus-rest strategy. The SVM classifier annotates im-ages of a user by computing scores, and logistic function is applied to the outputs of the image classi-fiers in order to obtain probability scores. Each of 30 probability scores shows how an image is close to the decision boundary of a particular label.
In the second step, we integrated the 30 scores of labels assigned to images to yield comprehensive scores which imply a user’s gender. Two methods are suggested for the second step. One is computing the average of all scores output from each classifier for each of the categories of male and female for a user. The other is computing the mean value of only the highest scores of every image for each of the categories of male and female for a user.
3.3 Combined method of Text Processing and Image Processing
pro-cessor and the image propro-cessor. In the function, is set as a ratio of the text score and an image score
to combine two scores appropriately. We introduced as a reliability ratio parameter of the scores by
the text processor and the scores by the image processor.
text image 1
combined Score Score
Score
4
Data
We prepared user annotation data and image annotation data that we used as training data and evalua-tion data. User annotaevalua-tion data are input data for the text processor, whereas image annotaevalua-tion data are for the image processor. As it is required to prepare a huge number of annotated data as a training cor-pus, the data is annotated by Yahoo Crowd Sourcing (Yahoo! Japan, 2013). Yahoo Crowd Sourcing is a Japanese crowd sourcing service similar to Amazon Mechanical Turk (Amazon, 2005). Therefore the annotation process aims to obtain annotation based on human recognition rather than to explore truth about users and images of twitter.
4.1 User Annotation Data
We first collected Japanese Twitter users according to their streaming tweets. We ignored heavy users and Twitter bots. A random sampling of tweets revealed that tweets from heavy users include much information that is not useful for profile inference such as short representations of their actions (e.g. “Going to bed now” and “Just waking up”). A Twitter bot is also classed as an uninformative user be-cause it is a program that automatically generates tweets. During data collection, we filtered out those users by setting conditions shown below in Table 1. Finally, we obtained 3976 Twitter users. We gathered tweets on each user up to 200. By executing the processes above, we obtained tweet data of each user corresponding to the user’s own 200 tweets.
To obtain gender annotation for this large dataset, we used Yahoo! Crowd Sourcing. As shown in Figure 2(a), we set task for every Twitter user: please infer the gender of the user who posted the tweets in the URL below. In this task, after reading 200 tweets of a user, the gender label of male or female was asked of every Twitter user. To guarantee quality reliability, annotation tasks for one Twit-ter user were duplicated 10 times by different workers; then a majority vote of 10 annotations was cal-culated to obtain a gold label.
As a result of the crowd sourcing tasks, 1733 users were reported as male; 2067 users were reported as female. There were 176 users whose votes were split equally between male and female. We
re-Table 1. Filtering conditions used to disqualify heavy users and Twitter bots
User Types Definition for N Criteria
Twitter bots Number of tweets posted from Twitter clients on PC/mobile
by a user
N<150
Heavy Number of Friends or followers of a user N>200
Number of Tweets posted in a day by a user N>10
(a) User annotation task (b) Image annotation task
Figure 2. Annotation tasks in crowd sourcing. http://www.abc.com/defg/index.html
Answer: ○ Male ○ Female Question :
Please infer the gender of the user who posted the tweets in the URL below.
✔
Question 2:
Please choose the word most suitable to express the objects included in the image Answer: ○ Male
○ Female ○ Unknown Question 1:
Please guess the gender of the user who uploaded the image
Answer: ○ Cartoon/Illustration ○ Food
○ Memo/Leaflet ○ Person ○ Screenshot/Capture
○ Famous person ○ Goods ○ Outdoor/Nature ○ Pet ○ Others
✔
[image:4.595.79.507.499.750.2]moved balanced users from the data. The male and female populations of annotation assumed users are 45.6% and 54.4% respectively. This gender proportion tendency is consistent with those reported from an earlier study showing that Twitter participants are 55% female (Heli and Piskorski, 2009; Burger et al., 2011). Finally, we obtained gender annotation data of 3800 users. We divided these data equally between training data and evaluation data: 1900 users for training data and 1900 users for evaluation data.
4.2 Image Annotation Data
We first made a user list including 1523 users. After checking tweets from these users, we extracted 9996 images. Image annotation processes were also executed by Yahoo Crowd Sourcing.
Our image annotation process refers to rules proposed by Ma et al. (2014). As shown in Figure 2(b), a worker is requested to provide responses of two kinds for every image: Q1. Please guess the gender of the user who uploaded the image; Q2. Please choose the word most suitable to express the objects included in the image. The possible responses for Q1 were male, female, and unknown. Those for Q2 were cartoon/illustration, famous person, food, goods, memo/leaflet, outdoor/nature, person, pet, screenshot/capture, and other. It is sometimes difficult to infer a gender of a user solely based on one
image. Therefore, unknown is set for Q1. From those responses we obtained multiple labels for every
image, such as “male-person”. To avoid influence by poor-quality workers, each image was presented to 10 different workers. A summation of 10 annotations was executed to obtain gold label data.
5
Preliminary Experiments
5.1 Image Processing
We compared two consolidation methods, computing the average of all scores and computing the av-erage of the highest scores for 30 object scores. We applied the two method to the training data of the user annotation data, and tested them on the evaluation data. Results show that the accuracy of former method is 60.11. That of the latter is 65.42. The reason the latter method is superior to the former one is probably attributable to noise reduction effects of ignoring low scores.
5.2 Combined method of Text Processing and Image Processing
To estimate the optimal value of , we conducted a preliminary experiment of the combined method
with training data. We first prepared text and image probability scores. The text score is obtained by executing five-fold cross validation of the text processor for training data. We used the probability score derived in section 5.1 as the image score. The accuracies were, respectively, 86.23 and 65.42.
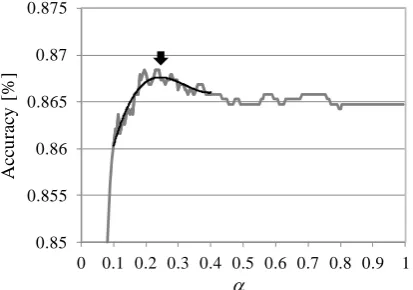
Next, the combined formula was applied to these probability scores with moving from 0 to 1. Figure
3 shows the correlation between accuracy and . To obtain the value of the peak, we executed
poly-nomial fitting to a part of the correlation curve where is 0.1–0.4. By differentiating this function, we
calculated the value of the peak as equal to 0.244 indicated by the arrow in Figure 3. The accuracy
[image:5.595.195.402.589.734.2]reaches 86.73% at the peak, which is 0.50 pt higher than that of the text processor.
Figure 3. Correlation between accuracy and in training data.
(Fitting curve function is 0.95193-0.91292+0.2756+0.8409)
0.85 0.855 0.86 0.865 0.87 0.875
0 0.1 0.2 0.3 0.4 0.5 0.6 0.7 0.8 0.9 1
A
cc
u
ra
cy
[%
]
6
Experimental Results
6.1 Comparing the Accuracies between Three Methods
We executed an evaluation experiment assessing the three methods: text processing, image processing
with a selected consolidation method, and the combined method with optimized (0.235). Each
method is applied to evaluation data including 1900 gender-annotated data. Table 2 presents precision,
recall, F-measure, and accuracy obtained through the evaluation experiments. The text processing
ac-curacy achieves 84.63%, and image processing acac-curacy is 64.21%. The combined method achieves
85.11% accuracy, which is 0.48 pt higher than the text processing accuracy.1 We also confirmed that
both the male and female F-measures become higher than text processing. We concluded that
signifi-cantly increased accuracy obtained using the method combining text processing and image processing.
6.2 Discussion
We expected the optimal value of to be large, since the accuracy of the text processor is explicitly
higher than that of the image processor. However, the actual optimal resulted to the rather small
[image:6.595.77.522.358.593.2]val-ue, 0.244. This small is thought to be caused by a characteristic of the image processor’s gender scores. Figure 4 (a) and (b) show the distributions of the gender scores derived by the text processor and the image processor. The horizontal axis corresponds to a gender score of a user, ranging from 0, highly probable female, to 1, highly probable male. The two distributions are clearly different from
Table 2. Results obtained using text processing, image processing and combined method. (P, precision; R, recall; F, F-measure; Acc., Accuracy)
Male Female Acc.
P R F P R F
Text processing 84.65 82.39 83.50 84.62 86.64 83.50 84.63
Image processing 64.68 66.56 65.60 72.10 62.11 66.74 64.21
Combined method ( = 0.244) 84.57 83.72 84.16 85.49 86.34 85.91 85.11
(a) The distribution of the text processing scores (b) The distribution of the image processing scores
[image:6.595.205.391.613.733.2]Figure 4. The distributions of the probability scores.
Figure 5. The distribution of the “male-person” score of training data of user annotation data.
0 100 200 300 400 500 600 700 800 900 1000
0.1 0.2 0.3 0.4 0.5 0.6 0.7 0.8 0.9 1.0
N u m b er o f u se rs Probability score 0 100 200 300 400 500 600 700 800 900 1000
0.1 0.2 0.3 0.4 0.5 0.6 0.7 0.8 0.9 1.0
N u m b er o f u se rs Probability score 0 1000 2000 3000 4000 5000 6000 7000
0.1 0.2 0.3 0.4 0.5 0.6 0.7 0.8 0.9 1.0
N u m b er o f la b el s Probability score
each other: the variance of the image scores is much smaller than that of the text. From this character-istic, the image scores were needed to be amplified in order to reflect them in the final result. In terms of , this amplification corresponds to a small value.
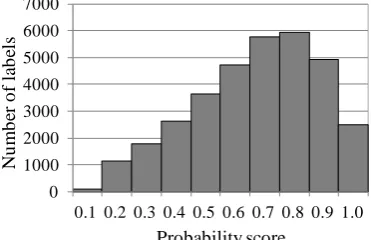
The reason why the variance of the image scores became small is in its calculation process. In the image processor, the gender score of a user is calculated as the mean of the highest object scores ex-tracted from each image. Figure 5 shows a distribution of “male-person” label scores. Though a distri-bution of each object probability scores centres not at 0.5, highest score selections and the averaging of them leads to a mid-range value, in this case 0.5.
Our intuition behind the introduction of was to provide a reliability ratio parameter of the text processor and the image processor. But as a matter of fact, this parameter also worked to calibrate the scale difference between the two probability scores. From this observation, a function that includes a reliability parameter and a calibration parameter separately can be considered as an alternative to the proposed function. Using this kind of function will provide further insights about combining a text processing and image processing.
7
Conclusion
As described herein, we assembled two results retrieved by text and image processors respectively to enhance the Twitter user gender inference. Even though the gender inference accuracy already reached 84.63 solely by the text classifier, we succeeded in improving efficiency further by 0.48 pt. Because the image processing in our method is completely independent from the text processing, this combined method is applicable to the other gender prediction methods, just like those of Burger and Liu (Burger, 2011; Liu, 2013). Reported studies about SNS user profile inference targeted basic attributes such as gender, age, career, residential area, etc. More worthwhile attributes for marketing that directly indi-cate user characteristics are desired to predict, for example, hobbies and lifestyles. Images in tweets are expected to include clues about these profiles aside from gender. As a subject for future work, we will apply our combined method to various profile attributes.
As the combined method in this paper is simple linear consolidation and ignores a capability of ana-lyzing both text and image information at the same time, exploring more suitable combined method is needed. The simplest way to analyze both text and image information simultaneously is early fusion that first creates the large multi-model feature vector constructed by both text and image features and then trains a classifier. Meta classifier which infers final class from the outputs of two modalities is also considerable method for this subject. Applying more sophisticated combined methods is another subject for future work.
References
Amazon. 2005. Amazon Mechanical Turk (2005), Available: http://www.mturk/welcom
Atilika. 2011, Kuromoji. Available: http://www.atilika.org
John D. Burger, John Henderson, Gerorge Kim, Guido Zarrella. 2011. Discriminating Gender on
Twitter, In Proc. of the Conference on Empirical Methods in natural Language Processing
Ken Chatfield, Victor Lempitsky, Andrea Vedaldi, Andrew Zisserman. 2011. The devil is in the
de-tails: an evaluation of recent feature encoding methods, In Proc. of British Machine Vision
Confer-ence 2011
Chih-Chung Chang, Chih-Jen Lin, 2001. LIBSVM: a Library for Support Vector Machines. Available: http://www.csie.ntu.edu.tw/~cjlin/libsvm
Bo Han, Paul Cook, and Timothy Baldwin. 2013. A Stacking-based Approach to Twitter User
Geolo-cation Prediction, In Proc. of the 51st Annual meeting of Association for Computational Linguistics,
pages 7-12
Bill Heli, Mikolaj Jan Piskorski. 2009. New Twitter Research: Men Follow Men and Nobody Tweets,
Kazushi Ikeda, Gen Hattori, Chihiro Ono, Hideki Asoh, Teruo Higashino. 2013. Twitter User
Profil-ing Based on Text and Community MinProfil-ing for Market Analysis, Knowledge Based Systems 51,
pages 35-47.
Svetlana Lazebnik, Cordelia Schmid, Jean Ponce, 2006. Beyond bags of features: Spatial Pyramid
Matching for Recognizing Natural Scene Categories, In Proc. of Computer Vision and Pattern
Recognition 2006, page 2169-2178
Wendy Liu, Faiyaz Al Zamal, Derek Ruths. 2012. Using Social Media to Infer Gender Composition of
Commuter Populations, In Proc. of the International Association for the Advancement of Artificial
Intelligence Conference on Weblogs and Social
Wendy Liu, Derek Ruths. 2013. What’s in a Name? Using First Names as Features for Gender Infer-ence in Twitter, In Symposium on Analyzing Microtext
David G. Lowe. 1999. Object recognition from local scale-invariant features, In Proc. of the
Interna-tional Conference on Computer Vision, pages 1150-1157
Matt Lynley. 2012. Statistics That Reveal Instagram’s Mind-Blowing Success, Available: http://www.businessinsider.com/statistics-that-reveal-instagrams-mind-blowing-success-2012-4
Xiaojun Ma, Yukihiro Tsuboshita, Noriji Kato. 2014. Gender Estimation for SNS User Profiling
Au-tomatic Image Annotation, In Proc. of the 1st International Workshop on Cross-media Analysis for
Social Multimedia
Aibek Makazhanov, Davood Refiei. 2013. Predicting Political Preference of Twitter Users, In Proc. of
the 2013 IEEE/ACM International Conference on Advances in Social Network and Mining, pages 298-305
Alan Mislove, Sune Lehmann, Yong-Yeol Ahn, Jukka-Pekka onnela, J. Hiels Rosenquist. 2011. Un-dersanding the Demographics of Twitter Users, In Proc. of 5th International AAAI Conference on
Weblogs and Social Media, pages 554-557
Delip Rao and David Yarowsky. 2010. Detecting Latent User Properties in Social Media, In Proc. of
the Neural Information Processing Systems Foundation workshop on Machine Learning for Social Networks
Chih-Fong Tsai. 2012. Bag-of-Words Representation in Image Annotation: A Review, International
Scholarly Research Notices Artificial Intelligence, Volume 2012, Article ID 376804, 19 pages
Jinjun Wang, Jinchao Yang, Kai Yu, Fengjun Lv, Thomas Huang, Yihong Gong. 2010.
Locality-constrained linear coding for image classification, In Proc. of Computer Vision and Pattern
Recog-nition 2010, page 626
Yahoo! Japan. 2013. Yahoo Crowd Sourcing. Available: http://crowdsourcing.yahoo.co.jp/
Dengsheng Zhang, Md Monirul Islam, Guojun Lu. 2012. A review on automatic image annotation,