Investigating Context Parameters in Technology Term Recognition
Behrang Q. Zadeh and Siegfried Handschuh∗†∗Insight Centre of Data Analytics National University of Ireland, Galway †Department of Computer Science and Mathematics
University of Passau, Germany
{behrang.qasemizadeh, siegfried.handschuh}@insight-centre.org
Abstract
We propose and evaluate the task of technology term recognition: a method to extract technol-ogy terms at a synchronic level from a corpus of scientific publications. The proposed method is built on the principles of terminology extraction and distributional semantics. It is realized as a regression task in a vector space model. In this method, candidate terms are first extracted from text. Subsequently, using the random indexing technique, the extracted candidate terms are represented as vectors in a Euclidean vector space of reduced dimensionality. These vectors are derived from the frequency of co-occurrences of candidate terms and words in windows of text surrounding candidate terms in the input corpus (context window). The constructed vector space and a set of manually tagged technology terms (reference vectors) in ak-nearest neigh-bours regression framework is then used to identify terms that signify technology concepts. We examine a number of factors that play roles in the performance of the proposed method, i.e. the configuration of context windows, neighborhood size (k) selection, and reference vector size.
1 Introduction
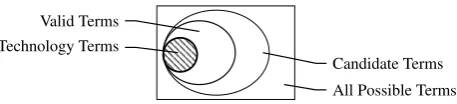
Technology terms and their corresponding concepts are part and parcel of any system that tries to cap-ture competitive technological intelligence (QasemiZadeh, 2010; Newman et al., 2014). We propose a method of technology term recognition (TTR) at a synchronic level, i.e., the identification of terms that correspond to technological concepts from a corpus of scientific publications. TTR can be viewed as a kind of automatic term recognition (ATR) task. The input of ATR is a large collection of documents, i.e. a domain-specific corpus, and the output is a terminological resource. The generated terminological resource embraces terms that signify a wide spectrum of concepts in domain knowledge represented by the input corpus. The extracted terms and their corresponding concepts, however, can be further orga-nized in several categories; each category characterizes a group of ‘similar’ concepts (e.g. technology) in domain knowledge.1 TTR, therefore, goes beyond ATR and targets a subset of terms that characterizes the category of technological concepts in domain knowledge (Figure 1).
Establishing a precise definition of technology—and subsequently finding its corresponding terms—is a fundamental problem studied in philosophy of science. The most simplistic definition of technology, perhaps, can be found in a dictionary. For example, Oxford dictionary defines technology as the ‘appli-cation of scientific knowledge for practical purposes’. As to our understanding, technology terms signal concepts that involve processes—a series of actions taken in order to achieve a particular goal—e.g. as manifested in practical applications of a research. Consequently, technology terms should not be con-fused with other categories of terms, e.g. terms that signify research subjects or problems.2 For example, in computational linguistics literature, both ‘language resource’ and ‘natural language processing’ are
This work is licensed under a Creative Commons Attribution 4.0 International Licence. Page numbers and proceedings footer are added by the organizers. Licence details:http://creativecommons.org/licenses/by/4.0/
1Or, contrariwise, a group of similar concepts can form a category.
2Even though, these category of terms are strongly correlated. For instance, a technology may provide a solution for a research problem and can be defined in the scope of a research subject. Therefore, it is important to note that a research problem or a research subject is not a technology.
Valid Terms Technology Terms
[image:2.595.185.414.60.112.2]Candidate Terms All Possible Terms
Figure 1: A Venn diagram that illustrates relationships between candidate terms, valid terms and tech-nology terms. ATR targets the identification of valid terms amongst candidate terms. TTR, however, targets the identification of technology terms amongst candidate terms, i.e. a subset of valid terms.
Text Candidate Term Extraction Scoring and Ranking Termhood
Unithood
Valid Terms
Figure 2: Prevalent architecture of the terminology mining methods.
valid terms; however, we only recognize the latter as a valid technology term.3 In this example, ‘lan-guage resource’ signals artefacts such as lexicons and corpora. Although the process of creating these artefacts involves several technologies, we do not consider them—and subsequently the term ‘language resource’—as technology.
In the absence of an analytical answer to the question ‘what is technology?’, we suggest exploiting the context of terms in order to identify technology terms among them. We believe that technology terms tend to appear in similar linguistic contexts. By extending Harris’s (1954) distributional hypothesis, we claim that the context of (previously) known technology terms can be modelled and used in order to identify new unknown technology terms. We thus take a distributional approach to the problem of technology term recognition. Consequently, we tie the context of terms to their meaning by quantification of their distributional similarities. We employ vector spaces to model such distributional similarities (Turney and Pantel, 2010). Consequently, the proposed method for TTR is realized as a term classification task in a vector space model (VSM).
The proposed method employs the prevalent mechanism of terminology extraction in the form of a two-step procedure: candidate term extraction followed by term scoring and ranking (Figure 2). Can-didate term extraction deals with the term formation and the extraction of term canCan-didates. We employ a linguistic filtering based on part-of-speech (PoS) tag sequences for the extraction of candidate terms. Subsequent to candidate term extraction, a scoring procedure—which can be seen as a semantic weight-ing mechanism—is employed to indicate how likely it is that a candidate term is a technology term. As suggested in Figure 2, the scoring procedure in ATR usually combines scores that are known astermhood andunithood. Unithood indicates the degree to which a sequence of tokens can be combined to form a complex term (a lexical unit that is made of more than one token). Unithood is, thus, a measure of the syntagmatic relation between the constituents of complex terms: a lexical association measure to identify collocations.4 Termhood, on the other hand, ‘is the degree to which a stable lexical unit is related to some domain-specific concepts’ (Kageura and Umino, 1996). It characterizes aparadigmaticrelation between lexical units—either simple (made of one token) or complex terms—and the communicative context that verbalizes domain-concepts. In this paper, in order to simplify the evaluation framework, we assume that the PoS-based approach to candidate term extraction implicitly characterizes the unithood score. The focus is thus on the termhood measure.
We devise a termhood measure to distinguish technology terms from the set of extracted candidate terms. We assume that the association of a term to a technology concept (i.e. what termhood determines) is a kind of paradigmatic relation that can be characterized using the syntagmatic relations of the term and its co-occurred, surrounding words in a context window (Figure 3). Words appeared in context
win-3Please note that ‘natural language processing’, in its alternative sense, can also signal a research subject as well as a research problem.
[image:2.595.127.481.177.227.2]Information Extraction technology to discover knowledge in text . · · ·
current employing when arise that challenges discuss
· · ·
Information Extraction methods for the offline construction of knowledge · · ·
different using of impact the of picture
· · ·
Information Extraction has been stimulated by the Message Understanding · · ·
of technology the
of development the
on
[image:3.595.95.519.170.217.2]· · ·
Figure 3: Example of a context window of size3that extends around terms: words that are placed in rectangles. In this example, this context-window is shown for the occurrences of the term ‘information extraction’ in three different sentences.
Candidate
Term Vector Space Construction Similarity to Reference Vectors
Random Indexing k-NN Regression
Technology-Class Membership
Figure 4: Method for measuring the association of a candidate term to the category of technology terms.
dows are represented by the elements of the standard basis of a vector space.5The frequency of words in context windows of a candidate term (in the whole corpus) then determines the coordinates of the vector that represent the candidate term. To avoid thecurse of dimensionality, the VSMs are constructed at re-duced dimensionality using the random indexing technique . In this VSM, we characterize the category of technology terms using a set of reference terms, i.e. previously known technology terms. Conse-quently, the proximity of vectors that represent candidate terms to the vectors that represent reference terms determines the association of candidate terms to the category of technology terms. This association is measured using ak-nearest neighbours (k-nn) regression algorithm. Figure 4 illustrates the method.
In the proposed technique, finding context window’s properties that best characterize technology terms is the major research concern that should be investigated. These properties are the size of the co-occurrence region, the position of a term in the context window and the direction in which the neigh-bourhood is extended (see Lenci, 2008). To find the most discriminative context window, we construct several VSMs; each VSM represents a context window of a certain configuration (i.e. size, direction and the word order information). We then examine the discriminative power of context windows by reporting the performance of thek-nn regression algorithm in these VSMs. Furthermore, to examine the role of the number of reference vectors in the performance of the classification task, we repeat these experiments using various numbers of reference vectors. We report the results of similar evaluation methodology, however, using ak-nn voting algorithm in Zadeh and Handschuh (2014b).
In the rest of this paper, we first detail the evaluation framework in Section 2: the employed corpus for the evaluation in Section 2.1, the construction of vector spaces in Section 2.2, the scoring procedure in Section 2.3 and the evaluation methodology in Section 2.4. Subsequently, we report the observed results in Section 3 and conclude in Section 4.
2 Setting the Scene 2.1 Evaluation Corpus
In order to evaluate the proposed method, we employ the ACL anthology reference corpus (ACL ARC) (Bird et al., 2008) and the ACL reference dataset for terminology extraction and classification (AC RD-TEC) (Zadeh and Handschuh, 2014a).6 The ACL ARC has been developed with the aim of providing a platform for benchmarking methods of scholarly document processing. It consists of 10,922 articles that were published between 1965 to 2006 in the domain of computational linguistics. These articles are digitized and enriched with bibliography metadata. The provided resources in the ACL ARC consist of three layers: (a) source publications in portable document format (PDF), (b) automatically extracted text from the articles and (c) bibliographic metadata and citation network. Each of the articles in the collection is assigned to a unique identifier that indicates the source (e.g. journal or conference)
5That is, informally, each dimension of the vector space.
Type Token Sentence Paragraph Section Publication 704,085 36,729,513 1,564,430 510,366 92,935 10,922
Table 1: Summary statistics of the dataset derived from automatic processing of the ACL ARC.
Total# Length = 1 Length = 2 Length = 3 Length = 4 Length = 5 Technology Terms 13,841 759 8,674 3,826 539 43 Valid Terms 22,044 1,503 14,148 5,680 659 54 Invalid Terms 61,758 15,887 33,474 11,016 1,210 171 Total Annotated 83,802 17,390 47,622 16,696 1,869 225
Table 2: Summary statistics of the annotated candidate terms.
and the date (e.g. 1999, 2006, etc.) of publication.
The ACL RD-TEC is a spin-off of the ACL ARC corpus. It further enriches the ACL ARC metadata using automatic and manual annotations. The ACL RD-TEC employed the SectLabel module of Luong et al.’s (2010) ParsCit tool for the automatic identification of logical text sections in ACL ARC’s raw text files. The resulting segmented text units are cleansed using a set of heuristics; for instance, broken words and text segments are joined, footnotes and captions are removed, and sections are organised into paragraphs. Text sections are further segmented into PoS-tagged sentences and each linguistically well-defined unit, e.g. types (i.e. PoS-tagged and lemmatized words), sentences, paragraphs and (sub)sections, is assigned to a unique identifier. These text units are stored and presented in inverted index files, in a tab-separated format. Hence, text units can be easily traced back to the contexts and, eventually, publications that they appeared in. Table 1 shows the statistics of text segments in the dataset.
The ACL RD-TEC consists of manual annotations that can be used for the evaluation of ATR and term classification tasks. In its current release, more than 80,000 lexical units7are annotated as either valid or invalid terms. For a given lexical formt, iftrefers to a significant concept in the computational linguistics domain, it is annotated as valid.8 Examples of valid terms are ‘natural language’ and ‘terminology’. In addition, valid terms are classified as those that can signal a technology concept. Technology terms indicate a method or a process that is employed to accomplish a task; examples of these terms are ‘parsing’ and ‘information retrieval’, and more delicate terms such as ‘linear interpolation’.
Similar to the valid terms, terms that are annotated as technology terms do not exclusively belong to this class. For example, ‘computational linguistics’ is a lexical form that can be classified as a technology term, e.g., in ‘· · ·promising area of application ofcomputational linguisticstechniques· · ·’. However, it can also signal other concepts such as a scientific discipline as well as a community, e.g.,
in ‘· · ·theoretical work incomputational linguistics· · ·’ and ‘· · ·pursued by thecomputational
linguis-ticscommunity· · ·’, respectively.
As reported in Zadeh and Handschuh (2014a), the observed agreement between 4 participants in the manual annotation of technology terms from a small set of randomly selected candidate terms is0.828; the obtained Cohen’s kappa coefficient for inter annotator agreement is0.627. Table 2 shows the current statistics of the annotated terms.
2.2 Construction of Vector Space Models using Random Indexing
We employ random indexing (RI) for the construction of the VSMs (Kanerva et al., 2000). For a corpus of a relatively small size, the context of terms can be represented and efficiently examined with the help of conventional vector space construction methods. The vector space is first constructed and then it may be followed by a dimensionality reduction technique. However, as the corpus grows and the number of elements that are employed for context definition increases, due to the high dimensionality of the vector space (orders of millions), these algorithms may suffer from low computational performance. RI is an approach that alleviates this problem by combining the construction of a vector space and the dimension reduction process. RI is based on normal random projection. It thus guarantees that
the relative Euclidean distance between vectors, as well as their cosine similarity, in the original high-dimensional vector space is preserved in the vector space that is constructed at a reduced high-dimensionality. The vector space construction is a two-step procedure: construction of (a)index vectorsfollowed by the construction of (b)context vectors.
In the first step, each context element (i.e. a PoS-tagged word in a context window) is assignedexactly to oneindex vector. Index vectors are high-dimensional randomly generated vectors, in which most of the elements are set to 0 and only a few to1and−1.9 Once an index vector is generated and assigned to a context element, this information is stored so that it can be retrieved and used for later analysis. In the second step, the construction ofcontext vectors, each candidate term is assigned to a vector of which all elements are zero. This context vector has the same dimension as the index vectors. For each co-occurrence of a candidate term (represented by the context vector~vti) and a context element (represented by the index vector ~rwj) in the corpus, the context vector for the candidate term is accumulated by the index vector of the context element, i.e. ~vti = ~vti +~rwj. The corpus is scanned for all the co-occurrences of candidate terms and context elements and the context vectors are updated to reflect these co-occurrences. The result is a VSM that is constructed directly in the reduced dimensionality and represents candidate terms using the defined context.
For instance, in the example given in Figure 3, the term ‘information extraction’ is assigned to a context vector. If a context window of size 3 that extends in both directions of candidate terms and discards word order information is employed, then each unique word in the rectangles, e.g. has, current, technology, the, been, etc., is assigned to a randomly generated index vector. The context vector is then obtained by the accumulation of these index vectors. If the word order information is encoded, then the appearance of each word at a certain position in the context window must be assigned to a unique index vector. As a result, in the given example in Figure 3, the word ‘technology’ in the first sentence (position 1 after target term) and the third sentence (position 2 before the target term) is assigned to two different index vectors, each uniquely represents the word ‘technology’ at these positions.
In order to employ random indexing, two parameters must be decided: the dimensionality of the VSM and the number of non-zero elements. As described in Zadeh and Handschuh (2014c), using the provided proofs in Li et al. (2006), it can be verified that the dimensionality of RI-constructed VSMs is determined independently of the number of context elements n(i.e. the original dimensionality of the vector space). It is, however, determined by the probability and the maximum expected amount of distortions in pairwise distances and the number of context vectors in the model (in logarithmic scale). The number of non-zero elements, on the other hand, is decided by the number of context elements and the sparseness of the VSM at the original high dimension (α) as O(√αn). Accordingly, in the reported experiment in this paper, we set the dimension of RI-constructed VSMs to1800, which is large enough to make sure that the distances are preserved in the constructed VSMs. In our experimental setup using the contexts that are described in Section 2.4.1, the estimated non-reduced, original dimension of the vector space is between700,000and7million;10hence, we set 8 elements of index vectors to±1.
2.3 Term Scoring Method:k-Nearest Neighbours Regression
We employ a standardk-nn regression method to assign scores to the extracted candidate terms. In this framework, context vectors that represent candidate terms are compared to those that represent a set of reference termsRs. Rsconsists of both technology and non-technology terms that are manually tagged
prior to the similarity measurement task. We employ the cosine similarity. For each candidate term t, terms in Rs are sorted in descending order by their cosine similarity to t. We calculate the sum of
the similarity of valid technology terms to t in the topk terms of this sorted list and consider it as a measurement of the technology-term class membership fort. As described later in Section 2.4.2, the
9This distribution of zero and±1elements in index vectors this leads to a Gaussian asymptotic distribution and consequently a Gaussian random projection matrix (see Zadeh and Handschuh, 2014c, for further explanation).
#TermTotal #TermTechnology Average Length f(Sentence) f(Paragraph) f(Section) f(Document)
3,490 1,596 2.037 1,696,201 1,264,616 870,574 346,000
Table 3: Summary statistics of the reference terms Rs. f(x) denotes the accumulative frequency of
occurrences of all the terms inRsin text segments of typex.
neighbourhood sizekis defined relative to the size ofRs.
As stated earlier, candidate terms are extracted from the ACL ARC corpus using a part-of-speech-based filtering technique. In this method, any sequence of tokens in the corpus that conforms to one of the predefined part-of-speech tag sequences is considered as a term candidate. By employing 31 different patterns of length 1 to 5, we extract1.3million candidate terms.11 Using thek-nn regression described above, the technology-term class membership is calculated for all the candidate terms.
2.3.1 Reference Term Formation
Prior to the k-nn regression task, we extract all the candidate terms which ended or collocated with the words ‘technology’ and ‘technique’ (in their lemmatized form). Examples of the extracted terms are ‘unsupervised text categorization’, ‘basic estimation’, ‘bi-directional bottom-up’ and ‘boolean keyword’. These terms are then manually annotated as technology and non-technology terms. For example, in the list of terms given above, only ‘unsupervised text categorization’ is annotated as a technology term. The process resulted in a set of reference termsRs consisting of 3490 terms of which 1596 are annotated
as technology terms (i.e. positive examples). The accumulative frequency of the occurrences of the extracted reference terms in the corpus are given in Table 3.
2.4 Evaluation Methodology
In the reported evaluation framework, the procedure described in Section 2.2 is performed to construct several vector spaces of various context configurations, which are described in Section 2.4.1. The de-scribed procedure for term scoring in Section 2.3 is then employed to assign scores to the extracted candidate terms in all the constructed vector spaces. In each experiment, candidate terms are sorted in descending order by their assigned scores. The proportion of technology terms in the list of the topn terms (we start with 250 terms) is reported for the comparison of the performance of the evaluated con-text configurations. We further investigate the role of the neighbourhood size selectionkas well as the number of reference termsRsin the performance of the scoring task.
2.4.1 Evaluated Context Parameters
In the reported evaluation, the terms’ contexts are defined by the frequency of distinct PoS-tagged words that co-occurred with terms in a text window of limited size. We evaluate context windows that are configured with three parameters: direction, size and order.
The first parameter distinguishes context windows according to the direction in which they are ex-panded to collect the co-occurrence counts. The context window of a term is exex-panded (a) to the left-hand side of the term to count the co-occurrence counts of the term with its preceding words in each sentence of the corpus, (b) to the right-hand side to collect co-occurrences with the succeeding words or (c) around the term, i.e. in both left and right directions. The context windows are also configured by their size, i.e. the extent of terms’ neighbourhood for counting the co-occurrences. As stated in Sahlgren (2008), an optimum size of a context window can only be found through experiments. However, he also suggests that if the goal is to capture a paradigmatic relation (such as the one proposed here), then narrow context windows outperform wide context windows. As a result, in our experiments we limit the size of context windowswto1 ≤w ≤ 5. For the context windows that expand around terms, we extend the context region symmetrically in both directions. As stated earlier, Figure 3 illustrates a context window of size 3 that extends around terms.
Some research suggests that the sequential order of words expresses information about the grammati-cal behaviour of words and, therefore, the inclusion of this information in a distributional model enhances
the performance. We investigate the impact of word order information on the performance of the sug-gested task. Capturing word order information requires distinguishing the location of words in context windows. To attain this goal in the random indexing technique, as stated earlier in Section 2.2, the ap-pearance of the same word in different positions in a context window is recognized by assigning the word to several index vectors, each index vector denotes the appearance of the word in certain position. Alternatively, the order of words (i.e. the position of a word in a context window) can be captured by shuffling their index vectors via a permutation function (Sahlgren et al., 2008).12In our implementation, a circular shift function serves as the permutation function. Accordingly, ifm is the number of tokens after/before a target term and a word in a context window, then the index vector of the word is shiftedm times circularly to the right/left before its accumulation to the target term’s context vector.
2.4.2 Evaluated Parameters ofk-Nearest Neighbours Regression
In addition to different configurations of context windows, we investigate the role of two other parame-ters in the performance of the proposedk-nn-based method: the neighbourhood sizekand the number of reference vectors |Rs|. The performance ofk-nn is largely dependent on the value of k: a small
value forkleads to over-fitting, while a large neighbourhood estimation may reduce the discriminatory power of the classifier. The optimumkis subject to the number of reference vectors and the underlying probability distribution of target instances in the vector space. The underlying probability distribution is unknown and difficult to estimate. Therefore, the optimal value ofkis usually obtained by an experi-mental method (Yang, 1999). Yang also suggests that the performance of thek-nn algorithm is relatively stable for a large range ofkvalues. Accordingly, we perform an empirical assessment by inspecting the output of the proposed method with respect to various values ofkthat are defined in relation to|Rs|. The
main objective of our experiment, however, is to examine whether the best-performing context configu-ration can be distinguished irrespective of the value ofk. Accordingly, we report the performance of the scoring procedure whenk=bpRsc, forp∈ {0.001,0.005,0.01,0.1,0.2}.
Building reference vectors Rs is laborious; it entails a manual annotation of terms. It requires
a domain expert to provide a list of representative technology terms (positive examples) and non-technology terms (negative examples) from the corpus that is being analyzed.13 As a result, a R
s of
small size is often more desirable than a large one. In k-nn, a small Rs is also desirable from the
computational complexity point of view. However, using a large set of reference vectors often yields higher performance. As a result, the choice of the number of reference vectors |Rs| is a trade-off
between efficiency and performance. We thus compare the performance of the method for values of
|Rs| ∈ {100,200,300,600,1100,1600,3200,3490}. In each experiment, we made sure that the created
Rshas a balanced number of positive and negative examples; however, the terms are chosen randomly.
3 Observed Evaluation Results
Table 4 reports the observed results in the first set of experiments. We start to score all the candidate terms using the complete set of reference vectors, i.e. |Rs|= 3490. We perform the experiments for all
the possible configurations of context windows, as described in Section 2.4. Each of these experiments are repeated for k = bp|Rs|c, forp ∈ {0.001,0.005,0.01,0.1,0.2}. In these experiments, therefore,
the assessed values ofk are {3,17,34,349,698}. Table 4a and 4b shows the observed results in the constructed VSMs when the word order information is excluded and included, respectively. In both tables, columns show the observed proportion of technology terms in the top 250terms in the list of candidate terms that are weighted using the proposed method; thus, the closer a number is to 1, the higher the performance. We suggest Frantzi et al.’s (1998)c-value score—a general ATR algorithm— for the baseline measure. Thec-value score of a term is measured by its frequency in the corpus that is normalized by its length and the frequency of its occurrences in other longer terms as a nested term. In our experiment, the proportion of technology terms in the top 250 terms in the list of candidate terms that are weighted by thec-value score is0.252.
12Assuming that shuffling of index vectors is equivalent to generating a new one.
Context Value ofpink=bp|Rs|c=bp·3400c Type Size 0.001 0.005 0.01 0.10 0.20
Left
1 0.264 0.592 0.596 0.580 0.536 2 0.132 0.688 0.664 0.644 0.556 3 0.376 0.688 0.696 0.592 0.512 4 0.524 0.692 0.656 0.616 0.536 5 0.636 0.660 0.660 0.580 0.504
Right
1 0.124 0.440 0.512 0.224 0.284 2 0.628 0.688 0.288 0.380 0.360 3 0.684 0.496 0.440 0.380 0.380 4 0.596 0.664 0.340 0.456 0.412 5 0.708 0.632 0.672 0.452 0.436
Ar
ound
1 0.440 0.748 0.744 0.608 0.616 2 0.716 0.836 0.848 0.764 0.700 3 0.760 0.840 0.816 0.696 0.664 4 0.160 0.800 0.788 0.672 0.660 5 0.144 0.748 0.740 0.660 0.660
(a) No Word Order Information
Value ofpink=bp|Rs|c=bp·3400c
0.001 0.005 0.01 0.10 0.20
0.264 0.592 0.596 0.580 0.536 0.128 0.660 0.644 0.588 0.524 0.344 0.676 0.652 0.544 0.448 0.400 0.648 0.664 0.524 0.436 0.448 0.632 0.640 0.488 0.408 0.124 0.440 0.512 0.224 0.284 0.696 0.736 0.788 0.316 0.368 0.720 0.388 0.688 0.304 0.328 0.580 0.376 0.600 0.324 0.328 0.768 0.384 0.552 0.328 0.328 0.376 0.768 0.804 0.704 0.624 0.796 0.836 0.824 0.644 0.608 0.760 0.828 0.808 0.636 0.572 0.784 0.808 0.776 0.612 0.540 0.784 0.808 0.756 0.580 0.516
[image:8.595.87.515.308.418.2](b) Encoded Word Order Information
Table 4: The observed results from the performed evaluations. The number columns show the proportion of technology terms in the top 250 terms for various values ofk.
10−3 0.1 0.2 0.4
0.6 0.8
p
Tt Tc
w= 1
10−3 0.1 0.2 0.4
0.6 0.8
p w= 2
10−3 0.1 0.2 0.4
0.6 0.8
p w= 3
10−3 0.1 0.2 0.4
0.6 0.8
p w= 4
10−3 0.1 0.2 0.4
0.6 0.8
p w= 5
Around Left Right RightQ LeftQ AroundQ
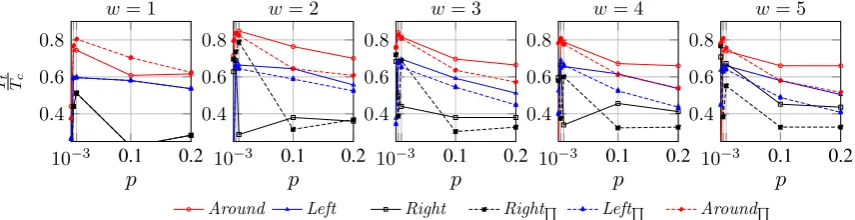
Figure 5: The performance of various context configurations over various neighbourhood sizes ofk =
bp|Rs|c. |TTct|denotes the proportion of technology terms in the top 250 terms that are sorted by their
assigned scores. Qdenotes context types that encode word order information. The minimum value of
|Tt
Tc|axis is set to0.252, i.e. our baseline. The baseline is the proportion of technology terms in the top 250terms in the list of candidate terms that are weighted using thec-value technique.
As shown in Figure 5, weighting terms in the VSMs that are built using context windows that extend in both directions of candidate terms (i.e.aroundcandidate terms) outperforms VSMs constructed by other types of context windows. In addition, as can also be verified in Table 4, the results from narrow context windows (1 ≤ w ≤ 3) are more desirable than those from wide context windows (w ≥ 3). However, in contrast to our previous experiments, in which we employed an unweightedk-nnvoting classification framework (Zadeh and Handschuh, 2014b), encoding word order information in the constructed VSMs does not necessarily improve the results. It is important to note that for different values ofk, although the overall performance of the TTR method changes, the relative performance of the employed context windows with respect to each other is, nearly, constant. Therefore, we conclude that the best-performing context type, thus VSM, can be decided independently of the value ofk: a result similar to that reported in Zadeh and Handschuh (2014b) for an unweightedk-nn voting classification.
3.1 Inspecting the Effect of Reference Vector Size
We are interested in studying the effect of reference vector size, i.e. |Rs|, on the overall performance
of the technology term recognition task. In this set of experiments, we limit our evaluation to the best-performing context window in the previous evaluation task, i.e. the context window that extendsaround candidate terms. We repeat the scoring process for|Rs| ∈ {100,200,300,600,1600,3490}. Similar to
the neighbourhood size(k)
Value ofpink=bp|Rs|c w k=1 0.001 0.005 0.01 0.10 0.20
|
Rs
|
=
100
1 0.194 0.194 0.194 0.194 0.458 0.482
2 0.228 0.228 0.228 0.228 0.466 0.490
3 0.276 0.276 0.276 0.276 0.440 0.472
4 0.076 0.076 0.076 0.076 0.470 0.488
5 0.016 0.016 0.016 0.016 0.486 0.448
|
Rs
|
=
300
1 0.352 0.352 0.352 0.428 0.538 0.526
2 0.390 0.390 0.390 0.492 0.646 0.638
3 0.450 0.450 0.450 0.532 0.592 0.566
4 0.020 0.020 0.020 0.382 0.584 0.590
5 0.034 0.034 0.034 0.004 0.586 0.592
|
Rs
|
=
1600
1 0.958 0.958 0.484 0.670 0.590 0.542
2 0.958 0.958 0.718 0.710 0.660 0.612
3 0.958 0.958 0.674 0.702 0.592 0.574
4 0.216 0.216 0.616 0.676 0.590 0.546
5 0.502 0.502 0.368 0.570 0.566 0.552
the neighbourhood size(k)
Value ofpink=bp|Rs|c w k=1 0.001 0.005 0.01 0.10 0.20
|
Rs
|
=
200
1 0.322 0.322 0.322 0.348 0.516 0.480
2 0.304 0.304 0.304 0.414 0.598 0.570
3 0.378 0.378 0.378 0.466 0.504 0.468
4 0.024 0.024 0.024 0.242 0.510 0.462
5 0.040 0.040 0.040 0.012 0.516 0.472
|
Rs
|
=
600
1 0.678 0.678 0.426 0.514 0.556 0.526
2 0.632 0.632 0.556 0.568 0.658 0.608
3 0.652 0.652 0.534 0.488 0.604 0.550
4 0.040 0.040 0.006 0.476 0.522 0.536
5 0.088 0.088 0.014 0.234 0.526 0.530
|
Rs
|
=
3490
1 0.956 0.362 0.670 0.666 0.546 0.526
2 0.956 0.624 0.722 0.734 0.608 0.586
3 0.956 0.628 0.716 0.692 0.574 0.534
4 0.992 0.118 0.698 0.682 0.550 0.528
[image:9.595.75.526.60.265.2]5 0.992 0.124 0.646 0.654 0.548 0.534
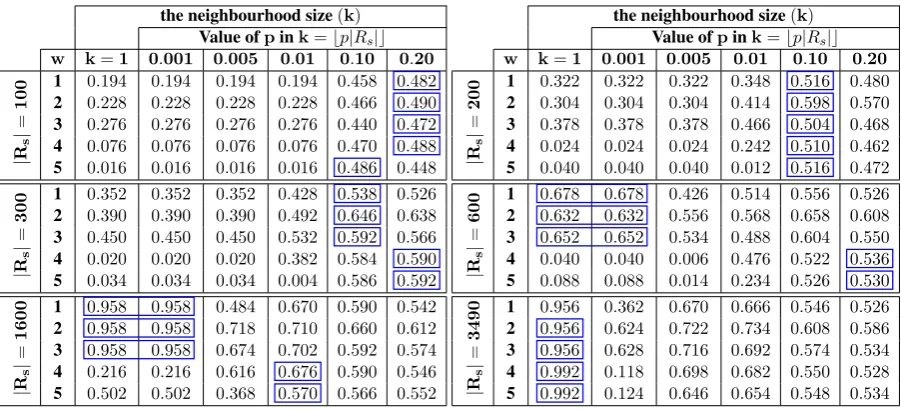
Table 5: The observed results, i.e. the proportion of technology terms in the list of top 500candidate terms, for various sizes of the reference vectors set (|Rs|) and the neighbourhood size (k) for the context
window that extends around the terms;wdenotes the size of context window.
size of the reference vectors (|Rs|), i.e.k=bp|Rs|c, forp∈ {0.001,0.005,0.01,0.1,0.2}. In addition,
we report the results for to the nearest-neighbour algorithm, i.e. whenk = 1. For |Rs| < 1000 and
p = 0.001that results tok =b0.001|Rs|c= 0, we setk= 1. In these cases, thus, the reported results
fork=bp|Rs|cis equivalent to the results reported fork= 1.
Table 5 reports the observed results: the proportion of technology terms in the top 500 terms in the list of candidate terms. First, these results suggest that the optimum value of p ink = bp|Rs|c, and
thusk, depends on|Rs|. If|Rs|is small, a larger neighborhood performs better than a smaller
neighbor-hood. Inversely, if|Rs|is large enough, a small neighbourhood shows higher performance than a large
neighborhood. Second, a small neighbourhood is sensitive to the size of context windoww(and perhaps the presence of noise), specifically when |Rs| is small. As an example, for|Rs| = 600 andk = 1,
if w ≥ 4, then the performance drops sharply. Therefore, the performance of large neighbourhoods can be more stable than the performance of small neighbourhoods. Lastly, when |Rs|reaches 1600 (a
certain threshold), there is no significant increase in the performance of the algorithm. In this case, the nearest-neighbour algorithm outperforms thek-nn method. We suggest that the obtained results from the nearest-neighbour method can be used as a heuristic-based strategy for the selection of the number of vectors in the|R|. Accordingly, one can stop adding new vectors toRs when the obtained results from
the nearest-neighbour method are above a certain threshold.
4 Conclusion
In this paper, we proposed a corpus-based, distributional method for the recognition of technology terms from a corpus of scientific publications. The method is established as ak-nn regression task in a Eu-clidean vector space, in which vectors are compared by their cosine similarity. This vector space repre-sents the co-occurrence frequencies of candidate terms and words in a context window. We examined a number of factors that play roles in the performance of the proposed method.
the reference vector size. We also reported an initial experiment that assessed the effect of the reference vector size on the performance of the system.
We performed our evaluations on the ACL ARC corpus. Apart from the proposed methodology and reported experiments, another outcome of the performed experiment is a relatively large set of annotated technology terms, i.e. the ACL RD-TEC. The annotated terms in the ACL RD-TEC can be easily mapped into the ACL ARC documents, thus, into a chronological order and in a citation network. As a result, the annotations resulting from the experiments reported in this paper can be used in tasks other than technology term recognition, e.g. citation analysis and technology forecasting.
The reported experiment can be extended in several ways. In this paper, we focused on the extraction of technology terms at the corpus level. It would be helpful to investigate the best-performing context configurations when the co-occurrences are collected from communicative contexts of other sizes than corpus, e.g. at a document level, similar to automatic keyphrase extraction tasks. It is also interesting to compare the performance of the k-nn instance-based algorithm with other learning techniques such as support vector machines. Last but not least, we are interested in re-evaluating the proposed method using metrics other than the topnterms look-up in the sorted weighted list of terms. A comparison of the evaluation metrics could be an attractive research avenue.
Acknowledgements
We thank the anonymous reviewers. This publication has emanated from research conducted with the financial support of Science Foundation Ireland under Grant Number SFI/12/RC/2289.
References
Steven Bird, Robert Dale, Bonnie Dorr, Bryan Gibson, Mark Joseph, Min-Yen Kan, Dongwon Lee, Brett Powley, Dragomir Radev, and Yee Fan Tan. 2008. The ACL anthology reference corpus: a reference dataset for bibliographic research in computational linguistics. InLREC’08. Marrakech, Morocco.
Stefan Evert. 2004. The Statistics of Word Cooccurrences Word Pairs and Collocations. Ph.D. thesis, Institut f¨ur maschinelle Sprachverarbeitung, Universit¨at Stuttgart.
KaterinaT. Frantzi, Sophia Ananiadou, and Junichi Tsujii. 1998. Thec-value/nc-value method of automatic recognition for multi-word terms. InResearch and Advanced Technology for Digital Libraries, volume 1513 ofLNCS, pages 585–604. Zellig S. Harris. 1954. Distributional structure.Word, The Journal of the International Linguistic Association, 10:146–162. Kyo Kageura and Bin Umino. 1996. Methods of automatic term recognition: A review.Terminology, 3.2 (1996):259–289. Pentti Kanerva, Jan Kristoferson, and Anders Holst. 2000. Random indexing of text samples for latent semantic analysis. In
Proceedings of the 22nd Annual Conference of the Cognitive Science Society, pages 103–6. Erlbaum.
Alessandro Lenci. 2008. Distributional semantics in linguistic and cognitive research.From context to meaning: Distributional models of the lexicon in linguistics and cognitive science, special issue of the Italian Journal of Linguistics, 20/1:1–31. Ping Li, Trevor J. Hastie, and Kenneth W. Church. 2006. Very sparse random projections. InProceedings of the 12th ACM
SIGKDD International Conference on Knowledge Discovery and Data Mining, KDD ’06, pages 287–296. ACM, NY, USA. Minh-Thang Luong, Thuy Dung Nguyen, and Min-Yen Kan. 2010. Logical structure recovery in scholarly articles with rich
document features. IJDLS, 1(4):1–23.
Nils C. Newman, Alan L. Porter, David Newman, Cherie Courseault Trumbach, and Stephanie D. Bolan. 2014. Comparing methods to extract technical content for technological intelligence. JET-M, 32(0):97 – 109.
Behrang QasemiZadeh. 2010. Towards technology structure mining from text by linguistics analysis. DERI technical report, National University of Ireland, Galway.
Magnus Sahlgren. 2008. The distributional hypothesis.Italian Journal of Linguistics, 20:33–54.
Magnus Sahlgren, Anders Holst, and Pentti Kanerva. 2008. Permutations as a means to encode order in word space. In V. Sloutsky, B. Love, and K. Mcrae, editors,Proceedings of the 30th Annual Conference of the Cognitive Science Society, pages 1300–1305. Cognitive Science Society, Austin, TX.
Peter D. Turney and Patrick Pantel. 2010. From frequency to meaning: vector space models of semantics. J. Artif. Int. Res., 37(1):141–188.
Yiming Yang. 1999. An evaluation of statistical approaches to text categorization.Inf. Retr., 1(1-2):69–90.
Behrang Q. Zadeh and Siegfried Handschuh. 2014a. The ACL RD-TEC: a dataset for benchmarking terminology extraction and classification in computational linguistics. InColing 2014 CompuTerm 2014. Dublin, Ireland.
Behrang Q. Zadeh and Siegfried Handschuh. 2014b. Evaluation of technology term recognition with random indexing. In
LREC’14. European Language Resources Association (ELRA), Reykjavik, Iceland.