http://www.scirp.org/journal/as ISSN Online: 2156-8561
ISSN Print: 2156-8553
DOI: 10.4236/as.2017.88059 Aug. 18, 2017 801 Agricultural Sciences
Optimizing Nutrient Use Efficiency and Returns
from Soybean Production under Smallholders
in Three Agro-Ecologies of Malawi
Moses Munthali
1*, Patson Nalivata
2, Wilkson Makumba
3, Emmanuel Mbewe
2, Hastings Manase
2,
George Oduor
4, Martin Macharia
4, Kaizzi Kayuki
51Chitedze Agricultural Research Station, Lilongwe, Malawi
2Lilongwe University of Agriculture and Natural Resources, Bunda Campus, Lilongwe, Malawi 3Department of Agricultural Research Services, Lilongwe, Malawi
4CAB International Africa, Nairobi, Kenya
5National Agricultural Research Laboratories, Kampala, Uganda
Abstract
Field trials were conducted to determine the economically optimum fertilizer rates for soybean production and for optimizing net profits in Dedza, Li-longwe and Salima Districts of Malawi. The effects of PK fertilizer rates on rain use efficiency (RUE), harvest index, agronomic use efficiency of phos-phorous (AEP) and potassium (AEK), and value cost ratio (VCR) were eva-luated. The applied diagnostic PK fertilizer rates significantly improved soy-bean grain yields, harvest index, rainwater use efficiency, AEP, AEK and re-turns to fertilizer use expressed as value cost ratio (VCR). However, the results differed significantly (P < 0.01) among the three agro-ecological zones. The VCR values indicated that the most economical and profitable fertilizer rate was 7.5 kg/ha P in Salima, Dedza and Lilongwe. The lowest economical and profitable NP fertilizer rate was 22.5 kg/ha P plus 20 kg/ha K for Dedza and Lilongwe and 15 kg/ha P plus 30 kg/ha K for Salima District. All the VCR values obtained from applying different PK fertilizer nutrient rates were above two implying that all the applied fertilizer rates had a good value of returns to adequately cover against any risks associated with using fertilizers at small- scale under smallholder farms with inadequate financial resources. The results also presented different available NP fertilizer application rate options for maximizing profits for the financially constrained smallholder farmers.
Keywords
Soybean, Net Returns, Economically Optimum Rates, Agronomic Use
How to cite this paper: Munthali, M., Nalivata, P., Makumba, W., Mbewe, E., Manase, H., Oduor, G., Macharia, M. and Kayuki, K. (2017) Optimizing Nutrient Use Efficiency and Returns from Soybean Pro-duction under Smallholders in Three Agro- Ecologies of Malawi. Agricultural Sciences, 8, 801-815.
https://doi.org/10.4236/as.2017.88059 Received: July 13, 2017
Accepted: August 15, 2017 Published: August 18, 2017 Copyright © 2017 by authors and Scientific Research Publishing Inc. This work is licensed under the Creative Commons Attribution International License (CC BY 4.0).
DOI: 10.4236/as.2017.88059 802 Agricultural Sciences
Efficiency of Phosphorous and Potassium, Nutrient Combination, Value Cost Ratio
1. Introduction
Soybean (Glycine max (L.) Merr.) is one of the most important crops grown in Malawi and the crop is well adapted for production in almost all agro-ecological zones of the country. It is a source of food and income for most farmers in the country [1]. In addition, it provides many advantages in sustainable cropping systems [2], including an ability to fix atmospheric nitrogen (N2) via symbiotic N2 fixation and, hence, alleviates the need to apply large amounts of nitrogen fertilizer [3] Although soybean crop is an important crop, its production under smallholder farms is still low with yields of 40% less (800 kg/ha) on average against the potential yield of 2000 - 2500 kg/ha [4]. Research studies on improv-ing soybean crop production have concentrated mainly on breedimprov-ing work which has led to the release of high yielding improved soybean varieties. The current low grain yields of soybean under smallholder farms are due to a number of production challenges or constraints that include primarily poor soil fertility.
Currently, in Malawi there have been no economically recommended opti-mum fertilizer rates for soybean grain yield production in different agro-eco- logical zones. Existing fertilizer recommendations also focus mainly on food se-curity crops such as maize and soybean has been neglected. Since soybean can fix nitrogen from the atmosphere through symbiotic relationship with rhizo-bium bacteria, it was assumed that soybean does not require much fertilizer for grain yield production. This means that there has been very little replacement of the nutrients such as P, K and micro-nutrients mined from the soil (i.e. removed through harvest). This has led to negative balance of the soil nutrient between what crops uptake from the soil and what is put back into the soil [5].
Soil fertility status for the country shows that Malawi soils are highly wea-thered and low in OM, N, P, K and other micronutrients [6]. Consequently, there has been decrease in crop yield including soybean under farmers’ field conditions. This calls for a need to use fertilizers to replace the depleted soil nu-trients and to reverse the negative nutrient balance in the soil. Soybean has been mostly cultivated in the country without use of application of chemical fertilizers except use rhizobium inoculants to enhance nitrogen fixation. As such most critical nutrients such as P, K and micro-nutrients have never been supplied to soybean production to achieve optimum grain yields.
Work done by many researchers has shown non soybean grain yield response to applied N [7][8][9]. In Zambia and Nigeria there has been a mean soybean grain yield response of less than 100 and 30 kg/ha respectively due to applied N
DOI: 10.4236/as.2017.88059 803 Agricultural Sciences
of 840 kg/ha and 60 kg/ha was reported by applying 15 kg/ha P and 10 kg/ha K in Uganda [11]. While in Zambia, Ethiopia, Nigeria, Ghana and Guinea Savanna of Nigeria, there were 400, 260, 570 and 260 kg/ha grain yield increase respec-tively in response to applied 15 kg/ha P [7][12][13]. In Nigeria there was also a positive soybean yield response of 200 kg/ha and 100 kg/ha due to application of Zn and B respectively [7]. However, in Malawi there has been not much research work done looking at optimizing soybean grain yield response due to application of different fertilizer elements and rates.
DOI: 10.4236/as.2017.88059 804 Agricultural Sciences
2. Materials and Methods
2.1. Study Sites
The Field trials were conducted both on-station and on-farm in Salima, Li-longwe and Dedza districts located in central region of Malawi. Salima District is located in the lake shore agro-ecological zone which lies between 200 to 700 m above sea level having semi-arid climate with monthly rainfall range from 0 to 339 mm, and mean monthly minimum and maximum temperatures range from 16˚C to 22˚C and 26˚C to 33˚C. The land is generally flat to gently undulating, with deep Fluvisols in the valleys and the shore lands of Lake Malawi. Lilongwe district is located in the mid-elevation which is between 760 and 1300 m above sea having a sub humid climate with monthly rainfall range of 1 to 221 mm; and minimum and maximum mean temperatures range of 8˚C to 17˚C and 24˚C to 30˚C, respectively [15]. The zone has predominantly shallow latosols in escarp-ments; deep well drained latosols in the plateau and poorly drained sand and clay soils in the valleys. Other important soil groups include Ferrasols, Luvisols, Lixisols Lithic and Leptosols [16].
Dedza District is located in the highlands with altitude of greater than 1300 m above sea level having a sub-humid climate with annual rainfall range of >1000 mm and minimum and maximum mean temperatures range of 9˚C to 16˚C and 19˚C to 25˚C, respectively. The analysed initial data for the physical and chemi-cal properties of the soil for the three study districts are given in Table 1.
2.2. Treatments and Experimental Designs
[image:4.595.209.538.514.585.2]The trials were established both on-station and on-farm for 3 years during 2013 to 2016 crop growing seasons. There were 11 different fertilizer treatments of P and K as sole elements or in combination of different rates. For on-station trials treatment combinations in Table 2 were arranged in a randomized complete
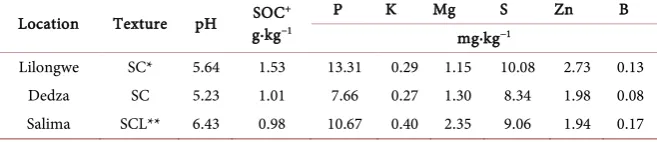
Table 1. Soil analytical data for the three trial sites in Malawi.
Location Texture pH SOCg·kg−1+
P K Mg S Zn B mg·kg−1
Lilongwe SC* 5.64 1.53 13.31 0.29 1.15 10.08 2.73 0.13 Dedza SC 5.23 1.01 7.66 0.27 1.30 8.34 1.98 0.08 Salima SCL** 6.43 0.98 10.67 0.40 2.35 9.06 1.94 0.17
*SC = Sandy Clay; **SCL = Sandy Clay Loam; +SOC = Soil Organic Carbon.
Table 2. Nutrient rates combinations for different fertilizer treatments applied.
Nutrient Combinations (kg/ha)
0K + P 20K + P 15P + K Diagnostic
0 0 0 15P, 20K, 15S, 2.5Zn, 10Mg, 0.5B 7.5 7.5 10
[image:4.595.208.538.629.716.2]DOI: 10.4236/as.2017.88059 805 Agricultural Sciences
block design with three replications. In Table 2, the first column means that on-ly the amounts of P rates (kg/ha) were applied alone; the second column means P rates were applied in combination with 20 kg/ha K; third column means that the amount of K rates were applied in combination with 15 kg/ha P while for the last column of diagnostic means 15 kg/ha P was applied in combination with 20 kg/ha K, 15 kg/ha S, 2.5 kg/ha Zn, 10kg/ha Mg and 0.5 kg/ha B.
For the on-farm trials, there were 5 replicates and each farm with all the treatments was regarded as a single replication.
The plots consisted of 6 ridges of each measuring 6 m long and spaced at 0.6 m. The soybean seeds were planted on the ridges one seed per planting station spaced at 15 cm apart. All the trial plots were surrounded with 4 border rows to control the external sources of variations. The soybean plants were harvested from a net plot of 4 ridges each 4 m long.
2.3. Data Collection
2.3.1. Soil DataInitial bulk soil samples were collected from the sites before land preparation. Soil samples were taken from 8 points across the field along each of the blocks (replicates). The samples were air dried, sieved using a 2 mm sieve and analyzed for particle size distribution, pH, organic carbon (OC), total N, exchangeable bases, exchangeable K, Ca, Mg and Na. All soil analyses were done by the soil laboratory ICRAF in Nairobi, Kenya.
2.3.2. Crop Data
The soybean grain yield data was collected by harvesting plants from a net plot of two central ridges of five meters long. Then 100 seeds were dried in an oven at 70˚C - 80˚C for 24 hours for moisture content determination. In calculating the soybean grain yield the moisture content was adjusted to 12.5˚C. Thereafter, soybean grain yield for each plot was converted to kg/ha. From the same net plot, the other data collected included total plant biomass per hectare and plant stand count at harvest. The other collected data was the cost of inputs, crop commodity prices, rainfall and etc. The collected data was used to calculate sev-eral variables that included: harvest index (HI), changes in yield variables, rain use efficiency (RUE), agronomic efficiency of P (AEP) and K (AEK), economi-cally optimum rates (EOR), value cost ratio (VCR) and economieconomi-cally optimal rates (EOR) were calculated using Microsoft excel. The following were the formulas used: 1) HI = Y/B where Y is the total grain yield per hectare and B is the total biomass per hectare; 2) AEX = Y/N where AEX is agronomic efficiency of X and X is either K or P; Y is the total grain yield per hectare and N is amount of either P or K applied per hectare; 3) RUE = Y/R where Y is the total grain yield per hectare and R is amount of rain received during the period of crop production [17].
2.4. Statistical Analysis
DOI: 10.4236/as.2017.88059 806 Agricultural Sciences
different levels of PK by site-year and combinations. The effect of P and K ferti-lizer and their interactions were the primary focus of the analysis. The changes or differences in yield variables were considered significant when P ≤ 0.05. Post-hoc comparisons of means were done using Dunnett’s test at P value = 0.05.
When significant effects of P rate by K rate did not occur, asymptotic regres-sion was fitted to the yield data in order to determine response to N. The asymptotic function is given as yield (Mg·ha−1) y = a − bcN, where a is soybean yield at the plateau (i.e. expected maximum), b is the amplitude (the gain in soybean yield for applied nutrients), c is a curvature coefficient and N is the nu-trient rate applied. The regression analyses for N rate effects included treatments with and without P separately. Then EORs were calculated using the OFRA ferti-lizer optimization tool developed by University of Nebraska, Lincoln in USA.
Rain use efficiency (RUE) which is the ratio of grain yield to seasonal total rainfall was calculated and used as proxy for water use efficiency (WUE). RUE has been suggested as a robust indicator of determining the crop productivity and land degradation in areas with limited moistures [18]. Therefore, RUE was used in this study as a metric for evaluating WUE.
Nutrient use efficiency by the soybean crop was assessed focusing on the agronomic efficiency of P (AEP) at fixed K rates and agronomic efficiency of K (AEK) at fixed P levels. AEP was calculated as a ratio of the increased crop out-put to the amount of P applied. AEK was calculated in the same manner as AEP.
Returns to fertilizer use were assessed using the value-cost ratio (VCR) be-cause it is commonly used when evaluating the profitability of fertilizer use, es-pecially when there unavailable data on full production costs. Hence, VCR was calculated as a ratio of value of increased crop output to the cost of fertilizer ap-plied. A VCR ≥ 2 means a 100% return on the use of money spent in buying fer-tilizer and is adequate to guarantee investing in ferfer-tilizer [19]. Therefore, in this analysis VCR ≥ 2 was considered as a reasonable critical value for assessing the risk associated with use of fertilizers at the small scale of smallholder farms.
All analyses were done using the Statistix 10 (Analytical Software. Tallahas-see).
3. Results and Discussion
3.1. Soybean Grain Yield and Harvest Index
DOI: 10.4236/as.2017.88059 807 Agricultural Sciences
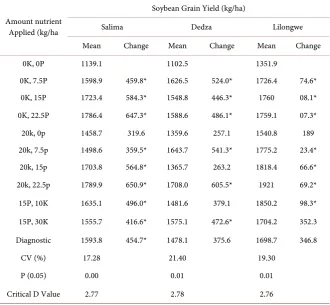
Table 3. Soybean grain yield and change in grain yield relative to the control (Change) due to application of different fertilizer rates at Salima, Dedza and Lilongwe.
Amount nutrient Applied (kg/ha
Soybean Grain Yield (kg/ha)
Salima Dedza Lilongwe Mean Change Mean Change Mean Change 0K, 0P 1139.1 1102.5 1351.9
0K, 7.5P 1598.9 459.8* 1626.5 524.0* 1726.4 74.6* 0K, 15P 1723.4 584.3* 1548.8 446.3* 1760 08.1* 0K, 22.5P 1786.4 647.3* 1588.6 486.1* 1759.1 07.3* 20k, 0p 1458.7 319.6 1359.6 257.1 1540.8 189 20k, 7.5p 1498.6 359.5* 1643.7 541.3* 1775.2 23.4* 20k, 15p 1703.8 564.8* 1365.7 263.2 1818.4 66.6* 20k, 22.5p 1789.9 650.9* 1708.0 605.5* 1921 69.2* 15P, 10K 1635.1 496.0* 1481.6 379.1 1850.2 98.3* 15P, 30K 1555.7 416.6* 1575.1 472.6* 1704.2 352.3 Diagnostic 1593.8 454.7* 1478.1 375.6 1698.7 346.8
CV (%) 17.28 21.40 19.30 P (0.05) 0.00 0.01 0.01 Critical D Value 2.77 2.78 2.76
Diagnostic: This consists of 15p, 20K, 15S, 2.5Zn, 10Mg, 0.5B. Values of Change followed by *show that there were significant mean yield differences among the treatments and changes from the control according to Dunnett’s test.
was applied with the yield difference of 651 kg/ha, 606 kg/ha and 491 kg/ha spectively. This means the rate of gave the optimum soybean grain yield re-sponse to applied fertilizers. The results are similar to what other researchers found in Uganda where the amount of 15 kg /ha P and 20 kg/ha K gave high in-crease in soybean yield [10] while in Nigeria only application of P contributed towards yield increase and not K [12]. The response of soybean to P application was due to low soil levels of P (Table 1) while the non-response to K in Dedza was due to low pH of the soil (Table 1).
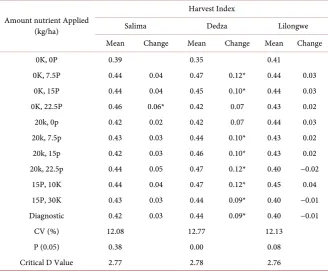
The results on the soybean harvest index for the three districts are given in
Table 4. Harvest index did not significantly differ with treatment except on in
DOI: 10.4236/as.2017.88059 808 Agricultural Sciences
Table 4. Variation in harvest index and change relative to the control (Change) due to application of fertilizers.
Amount nutrient Applied (kg/ha)
Harvest Index
Salima Dedza Lilongwe Mean Change Mean Change Mean Change 0K, 0P 0.39 0.35 0.41
0K, 7.5P 0.44 0.04 0.47 0.12* 0.44 0.03 0K, 15P 0.44 0.04 0.45 0.10* 0.44 0.03 0K, 22.5P 0.46 0.06* 0.42 0.07 0.43 0.02 20k, 0p 0.42 0.02 0.42 0.07 0.44 0.03 20k, 7.5p 0.43 0.03 0.44 0.10* 0.43 0.02 20k, 15p 0.42 0.03 0.46 0.10* 0.43 0.02 20k, 22.5p 0.44 0.05 0.47 0.12* 0.40 −0.02
15P, 10K 0.44 0.04 0.47 0.12* 0.45 0.04 15P, 30K 0.43 0.03 0.44 0.09* 0.40 −0.01 Diagnostic 0.42 0.03 0.44 0.09* 0.40 −0.01
CV (%) 12.08 12.77 12.13 P (0.05) 0.38 0.00 0.08 Critical D Value 2.77 2.78 2.76
Values of Change followed by *show that there were significant mean yield differences among the treat-ments and changes from the control according to Dunnett’s test.
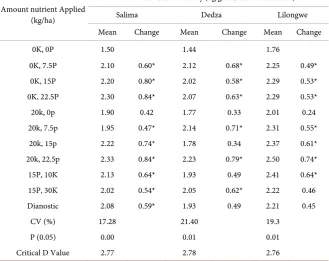
3.2. Rain Use Efficiency by Soybean
Rain use efficiency (RUE) results as affected by responses of soybean to different nutrient rate applications are given in Table 5. The results indicate that there were significant differences in RUE with application of different nutrient rates in all the three districts. There was an increase in RUE by soybean crops with an increase in nutrient application among the treatments as compared with the control in all the three sites. The highest values of RUE obtained in the P rate of 22.5 kg/ha, and 20 kg/ha P plus 22.5 kg/ha K in Salima, 15 kg P/ha plus 10 kg/ha K in Dedza and 20 kg/ha P plus 22.5 kg/ha K in Lilongwe. This represents a 54%, 34% and 42% increase over the control in Salima, Dedza and Lilongwe, respec-tively. The increase in RUE was due to enhanced metabolic activities by the sup-plied nutrients to the soybean crop.
3.3. Agronomic Use Efficiency of Phosphorous and Potassium in
Soybean
DOI: 10.4236/as.2017.88059 809 Agricultural Sciences
Table 5. Effect of nutrient application to soybean crop on rain use efficiency (RUE) and change in RUE relative to the control (Change).
Amount nutrient Applied (kg/ha)
Rainwater Use Efficiency (kg grain/mL of rain water) Salima Dedza Lilongwe Mean Change Mean Change Mean Change 0K, 0P 1.50 1.44 1.76
0K, 7.5P 2.10 0.60* 2.12 0.68* 2.25 0.49* 0K, 15P 2.20 0.80* 2.02 0.58* 2.29 0.53* 0K, 22.5P 2.30 0.84* 2.07 0.63* 2.29 0.53* 20k, 0p 1.90 0.42 1.77 0.33 2.01 0.24 20k, 7.5p 1.95 0.47* 2.14 0.71* 2.31 0.55* 20k, 15p 2.22 0.74* 1.78 0.34 2.37 0.61* 20k, 22.5p 2.33 0.84* 2.23 0.79* 2.50 0.74* 15P, 10K 2.13 0.64* 1.93 0.49 2.41 0.64* 15P, 30K 2.02 0.54* 2.05 0.62* 2.22 0.46 Dianostic 2.08 0.59* 1.93 0.49 2.21 0.45
CV (%) 17.28 21.40 19.3 P (0.05) 0.00 0.01 0.01 Critical D Value 2.77 2.78 2.76
Values of Change followed by *show that there were significant mean yield differences among the treat-ments and changes from the control according to Dunnett’s test.
Table 6. Agronomic use efficiency of phosphorous (AEP) and changes in AEP relative to the control (Change) in soybean.
Applied P (kg/ha)
Agronomic Use Efficiency of Phosphorous (kg grain/kg P) Salima Dedza Lilongwe Mean Change Mean Change Mean Change 7.5 213.18 216.86 57.84
15 133.01 −80.17* 103.25 −113.61* 32.91 −24.93* 22.5 79.39 −133.79* 70.6 −146.26* 21.52 −36.33* CV (%) 21.11 24.63 66.17
P (0.05) 0.00 0.00 0.01 Critical D Value 2.38 2.42 2.36
Values of Change followed by *show that there were significant mean yield differences among the treat-ments and changes from the control according to Dunnett’s test.
grain/kg P in Salima, Dedza and Lilongwe respectively. However, with increas-ing amount of P rate from 7.5 kg/ha to 22.5 kg P/ha, the AEP started to decrease at all sites as indicated by the negative soybean yield differences (Table 4).
[image:9.595.207.539.451.589.2]DOI: 10.4236/as.2017.88059 810 Agricultural Sciences
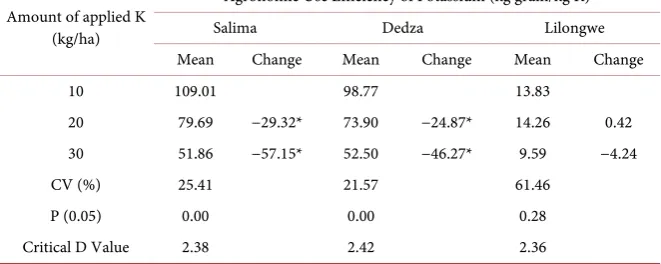
Table 7. Agronomic use efficiency of potassium (AEK) and changes in AEK relative to the control (Change) in soybean.
Amount of applied K (kg/ha)
Agronomic Use Efficiency of Potassium (kg grain/kg K) Salima Dedza Lilongwe Mean Change Mean Change Mean Change 10 109.01 98.77 13.83
20 79.69 −29.32* 73.90 −24.87* 14.26 0.42 30 51.86 −57.15* 52.50 −46.27* 9.59 −4.24 CV (%) 25.41 21.57 61.46
P (0.05) 0.00 0.00 0.28 Critical D Value 2.38 2.42 2.36
Values of Change followed by *show that there were significant mean yield differences among the treat-ments and changes from the control according to Dunnett’s test.
Lilongwe. The AEK decreased with an increased in the amount of K rates ap-plied. The highest AEK was obtained in Salima and Dedza districts when the rate of applied K was 10 kg/ha and in Lilongwe when the rate of applied K was 20 kg/ha. However, the AEK values at optimum rates were 10 times higher in Sali-ma and Dedza than those of Lilongwe. The differences could be ascribed to the variations in climatic and soil factors among the three agro-ecological zones. Although the highest AEK in Lilongwe was obtained when 20 kg K/ha were ap-plied, the increase in AEK was almost the same with the one obtained when 10 kg K/ha was applied in Lilongwe.
3.4. Return to Fertilizer Use
DOI: 10.4236/as.2017.88059 811 Agricultural Sciences
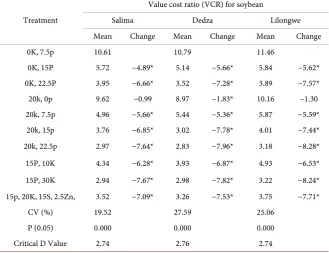
Table 8. Value cost ratio (VCR) for soybean grain yields.
Treatment
Value cost ratio (VCR) for soybean
Salima Dedza Lilongwe Mean Change Mean Change Mean Change 0K, 7.5p 10.61 10.79 11.46
0K, 15P 5.72 −4.89* 5.14 −5.66* 5.84 −5.62* 0K, 22.5P 3.95 −6.66* 3.52 −7.28* 3.89 −7.57* 20k, 0p 9.62 −0.99 8.97 −1.83* 10.16 −1.30 20k, 7.5p 4.96 −5.66* 5.44 −5.36* 5.87 −5.59* 20k, 15p 3.76 −6.85* 3.02 −7.78* 4.01 −7.44* 20k, 22.5p 2.97 −7.64* 2.83 −7.96* 3.18 −8.28* 15P, 10K 4.34 −6.28* 3.93 −6.87* 4.93 −6.53* 15P, 30K 2.94 −7.67* 2.98 −7.82* 3.22 −8.24* 15p, 20K, 15S, 2.5Zn, 3.52 −7.09* 3.26 −7.53* 3.75 −7.71*
CV (%) 19.52 27.59 25.06 P (0.05) 0.000 0.000 0.000 Critical D Value 2.74 2.76 2.74
Values of Change followed by *show that there were significant mean yield differences among the treat-ments and changes from the control according to Dunnett’s test.
vidually or both with other nutrients on the most economical and profitable nu-trient rates that a farmer can choose to apply.
3.5. Economically Optimum Fertilizer Rates for Soybean in
Three Agro-Ecological Zones
Table 9 gives the results of the soybean grain yield responses to P and K
DOI: 10.4236/as.2017.88059 812 Agricultural Sciences
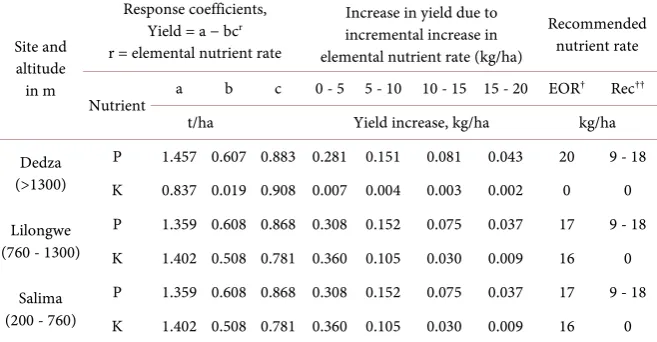
Table 9. Curves of response, expected increase in yields (t/ha) for nutrients, and OFRA economically optimal rate (EOR) in maximizing profit per unit area comparing with re-cent (REC) recommendations P2O5 = P × 2.29; K2O = K × 1.2. The response in some functions was zero for lacking response or information.
Site and altitude
in m
Response coefficients, Yield = a − bcr
r = elemental nutrient rate
Increase in yield due to incremental increase in elemental nutrient rate (kg/ha)
Recommended nutrient rate
Nutrient a b c 0 - 5 5 - 10 10 - 15 15 - 20 EOR
† Rec††
t/ha Yield increase, kg/ha kg/ha Dedza
(>1300)
P 1.457 0.607 0.883 0.281 0.151 0.081 0.043 20 9 - 18 K 0.837 0.019 0.908 0.007 0.004 0.003 0.002 0 0 Lilongwe
(760 - 1300)
P 1.359 0.608 0.868 0.308 0.152 0.075 0.037 17 9 - 18 K 1.402 0.508 0.781 0.360 0.105 0.030 0.009 16 0 Salima
(200 - 760)
P 1.359 0.608 0.868 0.308 0.152 0.075 0.037 17 9 - 18 K 1.402 0.508 0.781 0.360 0.105 0.030 0.009 16 0
††[12]. †EOR was calculated based on the buying price of MK 23,000 for 50 kg NPS fertilizer and MK 25,000 for 50 kg KCl and TSP. The selling price of MK 350/kg grain soybean.
Soybean responses to applied P and K at different sites and across different seasons followed a typical curvilinear to plateau in Salima, Dedza and Lilongwe districts. There was a steep increase in soybean grain yield with an increase in low rates of applied P and K, followed by a lower rate of increase at higher rates of applied P and K, until reaching a plateau in the curve. The results indicate that for the financially able farmers they would usually want to continue apply-ing nutrient until to the point where the value of incremental soybean grain yield is becoming the same with the cost of adding incremental rate of nutrient. While for the financially constrained or limited smallholder farmers, they should try to apply nutrient rates in region where there is still increase in grain yield of soybean.
3.6. Net Returns with Relation to Applied Monitory Nutrient Value
DOI: 10.4236/as.2017.88059 813 Agricultural Sciences
Figure 1. The net returns of investing in nutrient use in soybean for Highlands AEZ in Malawi (>1300 masl). The buying price of 50 kg NPS fertilizer was MK 23,000 and MK 25,000 for KCl and TSP. The selling price for soybean was MK 350/kg grain.
consider first using the nutrient combination that will be giving the most profit. The trend of these results is similar to what was reported in Uganda [10], Tan-zania [21], Kenya [20] and Malawi [22]. Therefore, Kaizzi and his colleagues
[10] are suggesting that the farmers who do not have adequate financial re-sources should be taking advantage of the available chances of profits depending on their affordability. Then hopefully in return they can allocate some of the gained profits to more fertilizer use and slowly move from being constrained fi-nancially and eventually apply adequate optimum nutrients rates to all soybean land for maximum profit gain per unit area [5].
4. Conclusion
DOI: 10.4236/as.2017.88059 814 Agricultural Sciences
Acknowledgements
We thank AGRA for funding of the OFRA project from which this research data was generated. We also thank CABI for their support of write-shop to finalize this manuscript. We also thank Prof. Charles Wortmann for his valuable com-ments during the implementation of the field trials.
References
[1] Franke, A.C., Branda, van den G.J. and Giller, K.E. (2014) Which Farmers Benefit Most from Sustainable Intensification? An Ex-Ante Impact Assessment of Expand-ing Grain Legume Production in Malawi. European Journal of Agronomy, 58, 28-38. https://doi.org/10.1016/j.eja.2014.04.002
[2] Sinclair, T.R. and Vadez, V. (2012) The Future of Grain Legumes in Cropping Sys-tems. Crop Pasture, 63, 501-512. https://doi.org/10.1071/CP12128
[3] Sinclair, T.R., Marrou, H., Soltani, A., Vadez, V. and Chandolu, K.C. (2014) Soy-bean Production Potential in Africa. Global Food Security, 3, 31-40.
https://doi.org/10.1016/j.gfs.2013.12.001
[4] Kabambe, V., Katunga, L., Kapewa, T. and Ngwira, A.R. (2008) Screening Legumes for Integrated Management of Witchweeds (Alectravogelii and Strigaasiatica) in Malawi. African Journal of Agricultural Research, 3, 708-715.
[5] Kaizzi, K.C., Mohammed, B.M. and Maman, N. (2017) Fertilizer Use Optimization: Principles and Approach. In: Wortmann, C.S. and Keith, S., Eds., Fertilizer Use Op-timization in Sub-Saharan Africa,CABI, Nairobi, 9-17.
[6] Munthali M.W. (2007) Integrated Soil Fertility Management Technologies: A Counteract to Existing Milestone in Obtaining Achievable Economical Crop Yields in Cultivated Lands of Poor Smallholder Farmers in Malawi. In: Bationo, A., Was-wa, B., Kihara J. and Kimetu, J., Eds., Advances in Integrated Soil Fertility Manage-ment in sub-Saharan Africa: Challenges and Opportunities, Springer, Dordrecht, 531-536. https://doi.org/10.1007/978-1-4020-5760-1_50
[7] Tarfa, B.D., Maman, N., Ouattara, K. and Wortmann, C. (2017) Groundnut and Soybean Response to Nutrient Application in West Africa. Agronomy Journal.
https://doi.org/10.2134/agronj2017.03.0132
[8] Musiyiwa, K., Mpeperekia, S. and Giller, K.E. (2005) Symbiotic Effectiveness and Host Ranges of Indigenous Rhizobia Nodulating Promiscuous Soybean Varieties in Zimbabwean Soils. Soil Biology and Biochemistry, 37, 1169-1176.
https://doi.org/10.1016/j.soilbio.2004.12.004
[9] Wortmann, C.S., Shapiro, C.A., Ferguson, R. and Mainz, M. (2012) Irrigated Soy-bean Has a Small Response to Nitrogen Applied during Early Reproductive Growth. Crop Management.
http://www.plantmanagementnetwork.org/sub/cm/research/2012/nitrogen/
[10] Giller, K.E. and Dashiell, K.E. (2006) Glycine max (L.) Merr. In: Brink, M. and Be-lay, G., Eds., Plant Resources of Tropical Africa 1. Cereals and Pulses, PROTA Foundation, Wageningen, Netherlands/Backhuys Publishers, Leiden, Netherlands/ CTA, Wageningen, the Netherlands, 76-82.
DOI: 10.4236/as.2017.88059 815 Agricultural Sciences
[12] Chiezey, U.F. (2013) Field Performance of Soybean (Glycine max (L) Merill) with Farmyard Manure and Inorganic P Fertilizers in the Sub-Humid Savanna of Nige-ria. Journal of Agricultural Science, 5, 10. https://doi.org/10.5539/jas.v5n10p46
[13] Kumaga, F.K. and Ofori, K. (2004) Response of Soybean to Bradirhizobia Inocula-tion and Phosphorus ApplicaInocula-tion. International Journal of Agriculture and Biology, 6, 324-327.
[14] Kanyama-Phiri, G.Y., Snapp, S.S., Kamanga, B., and Wellard, K. (2000) Towards Integrated Soil Fertility Management in Malawi: Incorporating Participatory Ap-proaches in Agricultural Research. Managing Africa’s Soils No. 11. IIED, UK.
http://www.iied.org/drylands
[15] Peel, M.C., Finlayson, B.L. and Mcmahon, T.A. (2007) Updated World Map of the Koppen-Geiger Climate Classification. Hydrology and Earth System Sciences, 11, 1633-1644.https://doi.org/10.5194/hess-11-1633-2007
[16] Jones, A., Breuning-Madsen, H., Brossard, M., Dampha, A., Deckers, J., Dewitte, O., Hallett, S., Jones, R., Kilasara, M., Le Roux, P., Micheli, E., Montanarella, L., Spaar-garen, O., Tahar, G., Thiombiano, L., Van Ranst, E., Yemefack, M. and Zougmore, R., Eds. (2013) Soil Atlas of Africa. European Commission, Luxembourg, 176. [17] Kihara, J., Huising, J., Nziguheba, G., Waswa, B.S., Njoroge, S., Kabambe, V.,
Iwua-for, E., Kibunja, C., Esilaba, A.O. and Coulibaly, A. (2016) Maize Response to Ma-cronutrients and Potential for Profitability in Sub-Saharan Africa. Nutrient Cycling in Agroecosystems, 105, 171.https://doi.org/10.1007/s10705-015-9717-2
[18] Sileshi, G.W., Debusho, L.K. and Akinnifesi, F.K. (2012) Can Integration of Legume Trees Increase Yield Stability in Rainfed Maize Cropping Systems in Southern Afri-ca? Agronomy Journal, 104, 1392-1398.https://doi.org/10.2134/agronj2012.0063
[19] Kamanga B.C.G., Whitbread, A., Wall, P., Waddington, S.R., Almekinders, C. and Giller, K.E. (2010) Farmer Evaluation of Phosphorus Fertilizer Application to An-nual Legumes in Chisepo, Central Malawi. African Journal of Agricultural Research, 5, 668-680.
[20] Kibunja Catherine, N., Ndungu-Magiroi, K.W., Wamae, D.K., Mwangi, T.J., Nafu-ma, L. (Deceased), Koech, M.N., Ademba,J. and Kitonyo, E.M. (2017) Optimizing Fertilizer Use within the Context of Integrated Soil Fertility Management in Kenya. In: Wortmann, C.S. and Keith, S., Eds., Fertilizer Use Optimization in Sub-Saharan Africa, CABI, Nairobi, 82-99.
[21] Senkoro, C., Ley, J.G., Marandu, A.E., Wortmann, C.S., Mzimbiri, M., Msaky, J., Umbwe, R. and Lyim, S.D. (2017) Optimizing Fertilizer Use within the Context of Integrated Soil Fertility Management in Tanzania. In: Wortmann, C.S. and Keith, S., Eds., Fertilizer Use Optimization in Sub-Saharan Africa, CABI, Nairobi, 176-191.
https://doi.org/10.1079/9781786392046.0176
[22] Nalivata, P., Kibunja, C., Mutegi, J., Tetteh, F., Tarfa, B., Dicko, M.K., Ouattara, K., Cyamweshi, R.A., Nouri, M.K., Bayu, W. and Wortmann, C.S. (2017) Integrated Soil Fertility Management in Sub-Saharan Africa. In: Wortmann, C.S. and Keith, S., Eds., Fertilizer Use Optimization in Sub-Saharan Africa, CABI, Nairobi, 25-38.
https://doi.org/10.1079/9781786392046.0025
Submit or recommend next manuscript to SCIRP and we will provide best service for you:
Accepting pre-submission inquiries through Email, Facebook, LinkedIn, Twitter, etc. A wide selection of journals (inclusive of 9 subjects, more than 200 journals)
Providing 24-hour high-quality service User-friendly online submission system Fair and swift peer-review system
Efficient typesetting and proofreading procedure
Display of the result of downloads and visits, as well as the number of cited articles Maximum dissemination of your research work
Submit your manuscript at: http://papersubmission.scirp.org/