ISSN Online: 2162-2086 ISSN Print: 2162-2078
Forecasting Hotel Prices in Selected Middle
East and North Africa Region (MENA) Cities
with New Forecasting Tools
Mohammed Al Shehhi, Andreas Karathanasopoulos
*Dubai Business School, University of Dubai, Dubai, UAE
Abstract
The purpose of this paper is to understand the potential of traditional and non-traditional statistical techniques to predict dynamic hotel room prices. Four forecast models were employed: the simple moving average, the autore-gressive integrated moving average (ARIMA), the radial basis function (RBF), and the support vector machine (SVM). This research is based on an empiri-cal study of data obtained from the company Smith Travel Research (STR). The economic predictors were obtained from other reliable sources such as the World Bank and the World Tourism Organization. This study agreed with existing literature on the ability of machine learning to predict hotel room prices precisely. Given the complexity of the hotel industry, the effect of ex-ternal economic predictors was tested in the model. The challenge lay in dealing with the mixed frequencies observed in the collected data. This re-search is designed to add an innovative approach to the existing literature on machine learning in the hotel industry in the Middle East and North Africa (MENA) region. Some of the machine learning techniques used in this study constitute a contribution to the research conducted in this region. This creates a bridge between many academic disciplines such as computer science, eco-nomics, and marketing. Small hotel operators should benefit from this re-search when setting strategies as well as in using the model to set their relative room prices.
Keywords
Hotel Forecasting, Analytics, Machine Learning
1. Introduction
According to the World Tourism Organization, tourism is considered a sector of
How to cite this paper: Al Shehhi, M. and Karathanasopoulos, A. (2018) Forecasting Hotel Prices in Selected Middle East and North Africa Region (MENA) Cities with New Forecasting Tools. Theoretical Eco-nomics Letters, 8, 1623-1638.
https://doi.org/10.4236/tel.2018.89104
Received: May 2, 2018 Accepted: June 12, 2018 Published: June 15, 2018 Copyright © 2018 by authors and Scientific Research Publishing Inc. This work is licensed under the Creative Commons Attribution International License (CC BY 4.0).
http://creativecommons.org/licenses/by/4.0/ Open Access
hope. Tourism accounts for 10% of world GDP. It contributes to world societies by promoting cultures, as well as by adding more jobs to the economy. In 2016, 1.2 billion tourists were recorded worldwide and this number is expected to grow to 1.8 billion (50% growth) by 2030 [1]. This research paper focuses on one aspect of the tourism and hospitality sector, which is accommodation and, more specifically, hotels. Practitioners as well as researchers have been motivated to study the dynamic prices of hotel rooms and understand the determinants of these changes and, accordingly, be able to forecast prices more effectively. Akm [2], Drew et al. [3], Hassani et al. [4], Padhi and Aggarwal [5], Yang et al. [6], Youn and Gu [7], Jovanovic et al. [8], Uysal [9], and Magnini et al. [10] have all forecasted hotel or tourism demand using neural networks jointly with support vector analysis, the autoregressive integrated moving average (ARIMA), logistic regression, fuzzy goal programming, and decision trees.
This study introduces a novel approach to hospitality forecasting in this re-gion and more specifically to hotel rooms’ average daily rates (ADR) based on eight major cities in the Middle East and North Africa (MENA) region. These methods include linear models (simple moving average and ARIMA) and non-linear models (radial basis function (RBF) and the support vector machine (SVM). Research on hotels and advanced machine learning forecasting tech-niques is very limited in this region. This study adds to the literature in this field.
The rest of the paper is organized as follows: the second section reviews the historical literature on Tourism and Hospitality studies and the different models used for forecasting; the third section covers the problem definition and research objective of this study; the fourth section highlights the conceptual framework which would provide good visuals for the study objective and hypothesis; the fifth is the methodology section which covers the data collection part, a detailed data analysis, a list of the key variables and the models used in the research; the sixth section covers the statistical performance evaluation and measures which were employed to select the best model. Finally, a conclusion section covers a summary of the study outcomes and provides recommendation for future studies.
2. Literature Review
In the tourism and hospitality industry, it is very important to understand the variables affecting demand and eventually the performance of the industry (or a particular hotel or restaurant). In the past, managers and decision-makers relied on simple forms of data analysis (simple linear regression or multiple regression) to investigate the influence of those variables. More recently, big data analytics has unlocked the potential for studying complex business situations to under-stand the correlation between variables or causes and eventually forecast per-formance. Machine learning techniques have made it possible to analyze tens or hundreds (even thousands) of data variables that are either stored or live-streamed to help shape a time bound decision-making process.
Hospitality and tourism studies using machine learning to predict demand have gained momentum lately. Simple neural networks (NN) (or artificial neural
networks (ANN)) have been the most-used machine learning technique. Philips et al. [11], Pattie and Snyder [12], Govers et al. [13], and Law [14] have all used NN or ANN to forecast tourism or hotel demand using historical tourists’ arrival data or room occupancy data. Some researchers have combined neural networks with other ML techniques, either to pick the best model or to improve the per-formance of the model.
Others have explored different machine learning techniques as well. Vu et al. [15], Tkaczynski et al. [16], Toral et al. [17], Dolnicar and Leisch [18], Brochado et al. [19], and Geetha et al. [20] have used clustering while dealing with market or customer segmentations and consumer behaviors. Hadavandi et al. [21], Yu and Schwartz [22] and Sohrabi et al. [23] have used fuzzy systems to predict ho-tel demand using arrival data. Fuzzy systems are also widely used in planning and decision-making in retail and banking. Li and Sun [24] used support vectors to predict firm failure using financial and non-financial data, while Chen and Wang [25] used the support vector technique to forecast the demand. Pantano et al. [26] used tourist attraction characteristics and the random forest method to predict tourist response, while Shapoval et al. [27] used inbound visitors num-bers and the decision tree technique to develop effective destination marketing. Rong et al. [28], Xiang et al. [29], Li et al. [30], Yang et al. [31], Guo et al. [32], Versichele et al. [33], Sun et al. [34], Athanasopoulos et al., [35], Schwartz and Hiemstra [36], Yang et al. [37], Tussyadiah and Wang [38], Pereira [39], Liu et al. [40], Lim et al. [41], Wu et al. [42], Zhang and Zhang [43], and Chiu et al. [44] have all introduced new “unconventional” variables while studying hospi-tality performance. The results are evidence that machine learning techniques are extremely powerful in enhancing the accuracy of analysis and prediction. With a very globalized industry such as the hospitality and tourism industry, machine learning has indeed proven its potential.
3. Problem Definition and Research Objective
Prior studies have focused mostly on tourism demand in countries, that is, at the macro level. Tourism arrivals have been extensively used as a forecasting com-ponent and most of the studies are country-specific. Macroeconomic factors take longer time to respond to changes of what is known as the lag effect. On the other hand, firm specific microeconomic factors which represent the fundamen-tal factor model are much faster to respond to changes and are in the control of the hotel managers/owners. They often lead to significant characterization of the dependent variable under investigation [45]. The objective of this study is to firstly combine macro and micro elements while studying dynamic hotel prices. Several cities from the MENA region, which, it is assumed, go through the same economic effects, are included in the study. In addition, this study explores the benefits of using machine learning techniques in forecasting.
4. Research Framework and Proposed Hypotheses
Hotel practitioners have used inventory planning and pricing as major inputs in
their revenue management systems, which has led to successful hotel perfor-mance [39]. Lee [46] found while measuring hotel room rates that prices were affected by both internal (hotel-specific) and external (economic) factors.
Driven by literature findings, hotel attributes have a direct effect on hotel performance. This leads to the first hypothesis:
H1: Big data on hotels leads to better price prediction.
Moreover, various economic factors were investigated in hotel performance studies. This has led to the inclusion of economic factors as a moderating effect to be tested in this study:
H2: Economic factors moderate the relation between hotels’ attributes and hotel room pricing.
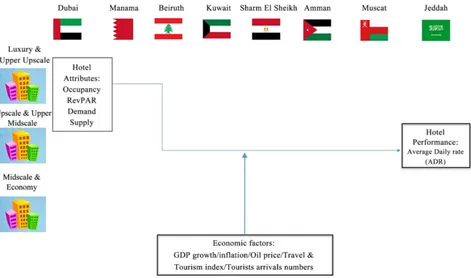
The following diagram (Figure 1) provides a visual representation of the study direction.
5. Methodology
Data collection and analysis [image:4.595.64.535.430.708.2]The daily hotel data used in this research paper came from STR and covered eight cities in the MENA region (at our request): Dubai, Jeddah, Manama, Mus-cat, Kuwait, Beirut, Amman, and Sharm El Sheikh. The hotels were split into three categories (Luxury and Upper Upscale Class, Upscale and Upper Midscale Class, Midscale and Economy Class). However, due to some missing data and the need for uniform analysis across all eight cities, it was decided to deal only with the Luxury and Upper Upscale class since data were available for this class
Figure 1. Hotel performance determinants in selected MENA cities.
for all cities. The sample contained 2800 observations of daily room sales cover-ing the period between January 2010 and August 2017. The data set was split in the following way (Table 1).
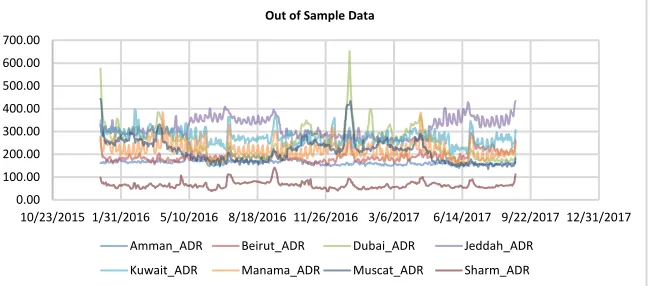
The data split is done to test the models’ performance in predicting unknown observations (test data is part of unsupervised learning) after determining all network/model parameters using the training data.
Economic variables were obtained from other credible sources such as the World Bank, the World Tourism Organization, the World Economic Forum and the US Energy Information Administration. The only challenge was that most of these data had different frequencies (monthly, yearly, and once every two years). To deal with different frequencies, international tourist arrival data were con-verted to daily rates by dividing the annual rate by 365, while country-level an-nual GDP growth percentage rate, inflation rate (average consumer prices), oil price (WTI and Brent), and index data on each country’s business environment, safety and security, health and hygiene, human resources, and labor market were all converted to daily rates by maintaining the same rate throughout the year. The aim was to use these variables and measures to gain insight into the deter-minants of hotel room prices that would help us, and eventually deci-sion-makers, to predict these prices with more accuracy. Innovative ways of handling mixed data frequencies could be an opportunity for future research. This study would also be a good piece of research to validate the hotel perfor-mance determinants (HPD) model suggested by Assaf et al. [47]. The table be-low (Table 2) represents a list of the variables found in the literature that we uti-lized in our study based on data availability/accessibility.
6. Models in the Research
This research is based on predicting dynamic hotel room prices based on the se-lection of the best forecasting model. These models are linear (simple moving average and ARIMA) and non-linear (RBF and SVM) in form. The goal is to compare the above-mentioned models using the model performance measures to determine the best model or a combination of them.
6.1. Time Series Forecast
Using ADR values from the years, time series forecast would help in predicting the future ADR of hotels based on historical data. The main goal is to find a model with a better fit for the data, hence reducing the noise or error. The mod-els that we used are the simple moving average and the Box–Jenkins ARIMA model. These models are widely used in tourism and hospitality research.
6.2. Simple Moving Average
The simple moving average method uses the average of previous n-periods as a forecast value [59].
ARIMA
Table 1. Data sample.
Period Total Observation Start Date End Date Total data set 2800 1-Jan-10 31-Aug-17
[image:6.595.63.534.113.740.2]Training set 2191 1-Jan-10 31-Dec-15 Test set (out of sample) 609 1-Jan-16 31-Aug-17
Table 2. Summary table of variables used in tourism and hospitality literature.
Variables found in the literature Main area of study Source Hotel performance determinants (HPD) framework:
§ General economic conditions: tax rate, gross domestic product growth, exchange rate, fuel price, disposable income.
§ Safety and stability: number of natural disasters, crime rate
§ Market supply and demand: number of other accommodation providers, number of competing hotel rooms, performance of the overall hotel industry, domestic tourist arrivals per capita, international tourist arrival per capita.
§ Regulation and support: T & T government expenditure, transparency of government policies, fairness in government spending, visa requirements.
§ Quality of infrastructure: quality of air transport infrastructure, quality of port infrastructure, quality of road infrastructure.
§ Labor skills and training: ease of hiring foreign labor, quality of the educational system.
Hotel performance [47]
PESTELIR model:
§ Political conditions: regional and local policies supporting website development, public subsidies for ICT implementation, tourism promotion.
§ Economic conditions: macro- and microeconomic trends determining business investments: economic cycles, changing origins of most tourists, development of new destinations.
§ Socio-demographic conditions: changes in consumption habits, new customer needs, new market segments.
§ Technological conditions: technology-related innovations allowing the offer of new hotel products and services or improvements in productive processes.
§ Ecological conditions: pollution, environmental policies regulating protected areas.
§ Legal conditions: legislation regarding construction, legislation for protection of personal data, legislation for protection of personal data.
§ Infrastructure conditions: changes in tourism infrastructure (airports, convention centers, new communication infrastructures).
§ Human resource conditions: basic features of the workforce to be accessed by hotels and other tourism organizations: training, motivation, languages.
Hotel performance [48]
§ Nominal exchange rate § Relative prices
§ World GDP per capita Tourism demand [49] § The national growth effect
§ The industrial mix effect
§ The competitive share effect Tourism growth [50] Hotel location Hotel profitability [51]
§ Direct expenditure § Output effects § Income effects § Value added § Import effects § Product taxes effects
Tourism demand [52]
Oil price shocks prices and economic Tourism sector, oil growth [53]
Continued
GDP growth Tourism industry performance [54]
INFORGE model: § GDP § Tax revenues § Employment effect
Tourism demand [55]
§ Industry and consumer confidence indicator § Hotel and restaurant turnover
§ Real GDP § Relative prices
Tourism demand [56]
Growth model and some economic variables: § Investment in physical capital
§ Human capital
§ Openness of the economy § Economic freedom § Tourism development
Tourism and economic growth [57]
§ Foreign exchange § Tax revenues § Population income § Employment rate
§ Infrastructure improvement
Economic performance [58]
§ Average daily rate (ADR) § Occupancy
§ RevPAR § Demand § Supply
Hotel performance STR
ARIMA (p, d, q) consists of the autoregressive AR(p), the moving average MA(q) and (d), which represents the order of differencing used to achieve sta-tionarity. ARIMA is one of the models most widely used to forecast with time series data [60].
1 1 2
ˆyt= +µ φyt− +…+φpyt−p− ∂q t qe− −…− ∂ et q− (1)
6.3. Machine Learning Models
6.3.1. RBF
RBF is one of the most widely used neural network techniques. Used for classifi-cation as well as regression, the RBF model is a feed-forward neural network that is based on three layers: input, hidden and output [61]. RBF models gained in-terest due to their advantage in achieving faster convergence with fewer errors while also being reliable (Moradkhani et al., 2004) [62].
( )
exp 2t 2 2x C f x
σ
− −
=
(2)
where C represents the center and represents the width of the neuron or the ra-dius (Wei, 2012) [61].
6.3.2. SVM/SVR
SVM was introduced by Vapnik in the early 1990s. SVM is a statistical technique used widely for classification and more recently for regression (support vector regression (SVR)). Unlike other models, SVM aims to minimize the generalized error (structural risk minimization). When visualized, SVM works to maximize a hyperplane that separates two classes (or more). SVR is another version of SVM that was proposed by Drucker, Burges, Kaufman, Smola, and Vapnik [63]. SVM could also work in higher dimensions if a kernel function is applied, which allows SVM to solve non-linear equations [25].
( )
,( )
f x =ω φ x b+ (3)
7. Data Analysis
As a first step, we ran a descriptive statistics analysis for the data which high-lights the mean, max, min and standard deviation of the variables used in the study. The data used in this study represents daily observations obtained from STR which provided insights of the internal or microeconomic factors used by the industry to study the hospitality sector. Other macro-economic factors, which appeared also in several studies within the tourism and hospitality field; were obtained from different sources such as the world bank the World Tourism Organization, the World Economic Forum and the US Energy Information Ad-ministration. However, those factors where country based since capturing them at city level and on daily basis was impossible and out of the scope of this study. The table blow (Table 3) provides a summary of the descriptive statistics for significant variables generated from Dubai Luxury upper data which was pro-duced using IBM SPSS:
With skewness that is close to zero and less than 1 for most variables, this in-dicated that though we are dealing with very dynamic environment, yet data is normally distributed with means around zero.
Using documented steps in literature for each proposed model in this study, the data was then used in each model to produce the forecasts and to carry fur-ther analysis. The aim is to compare models and choose the best model for ADR prediction (or perhaps a combination of models) based on
1
1 n ˆ
t t
t
MAD y y
n =
=
∑
− ,1
ˆ
1 n 100%
t t
t t
y y MAPE
n = y
−
=
∑
∗ ,(
)
21
1 n ˆ
t t
t
RMSE y y
n =
=
∑ ∑
− ,and
(
)
21
1 n ˆ
t t
t
MSE y y
n =
=
∑
−performance criteria.
As a first step in the time series analysis, the data were plotted to check
ly for any seasonal trends throughout the year (refer to Figure 2 for ADR). The aim was to regulate this seasonality or make the data stationary in order to be able to explain the data using the autoregressive model, ARIMA. Many of these cities showed acceptable stationarity in data while some (i.e. Jeddah) showed some increasing trends over a number of years, which necessitated some treat-ment of the data to make the mean constant. As a result, and to maintain un-iformity, first-order differencing for all cities’ data was considered to make those data stationary following the 1970 Box-Jenkins method (see Figure 3) [64].
After dealing with stationarity, AIC and BIC tests were employed. A different combination of ARIMA models for each city was tested and based on the tests criteria the best model was selected for data analysis.
8. Statistical Performance
The following table (Table 4) represents the result of the models’ performance measures for each city as a measure of forecasting accuracy.
8.1. Conventional Techniques
[image:9.595.212.539.371.499.2]By employing the ARIMA and simple moving average techniques to forecast future room rates, the study found that the simple moving average performed poorly
Figure 2. Average daily rates for Luxury and Upper Upscale hotels in selected cities in the MENA region (StataSE13).
Figure 3. D1 of average daily rates for Luxury and Upper Upscale hotels in selected cities in the MENA region (StataSE 13).
0.00 200.00 400.00 600.00 800.00
7/6/2009 11/18/2010 4/1/2012 8/14/2013 12/27/2014 5/10/2016 9/22/2017 2/4/2019
Hotel Average Daily Rate (ADR) for selected MENA cities
Amman_ADR Beirut_ADR Dubai_ADR Jeddah_ADR
Kuwait_ADR Manama_ADR Muscat_ADR Sharm_ADR
0.00 100.00 200.00 300.00 400.00 500.00 600.00 700.00
10/23/2015 1/31/2016 5/10/2016 8/18/2016 11/26/2016 3/6/2017 6/14/2017 9/22/2017 12/31/2017
Out of Sample Data
Amman_ADR Beirut_ADR Dubai_ADR Jeddah_ADR
Kuwait_ADR Manama_ADR Muscat_ADR Sharm_ADR
[image:9.595.212.537.549.692.2]Table 3. Descriptive statistics for Dubai Luxury & upper sample data.
Descriptive Statistics
N Minimum Maximum Mean Std. Deviation Skewness Kurtosis ADR 2800 154.98 683.45 275.23 74.56 0.830 1.530 WeekDay 2800 1.00 7.00 4.00 2.00 0.000 −1.250 Occupancy 2800 36.10 98.27 75.73 12.91 −1.114 1.055
RevPar 2800 58.35 668.45 214.79 83.49 0.598 1.126 Demand 2800 9973.53 39681.71 24739.01 6055.69 −0.165 −0.599 Inflation Rate Avg.
Consumer Prices 2800 0.70 4.10 1.72 1.08 1.181 0.341 Oil WTI 2800 26.19 115.39 76.22 23.49 −0.364 −1.373 Oil Brent 2800 26.01 128.14 83.49 28.46 −0.273 −1.488
Business
Environment 2800 5.14 5.90 5.47 0.32 0.480 −1.557 Safety and
Security 2800 5.13 6.60 5.66 0.69 0.634 −1.592 Health and
Hygiene 2800 4.88 5.40 5.09 0.19 0.164 −1.442 Human Resources
and Labour
Market 2800 5.15 5.65 5.47 0.22 −0.625 −1.565 ICT Readiness 2800 4.00 6.10 5.10 0.72 −0.511 −1.062
Table 4. Performance for all cities.
Amman Kuwait
Forecast ARIMA Simple Average RBF SVM Forecast ARIMA Simple Average RBF SVM MAD 0.0547 0.0675 0.0392 0.0351 MAD 0.0653 0.0772 0.0423 0.0412
MSE 0.0531 0.06873 0.0345 0.0443 MSE 0.0865 0.0976 0.0652 0.0612 RMSE 156.34% 181.77% 142.67% 123.45% RMSE 189.61% 187.56% 155.41% 123.71% MAPE 0.029 0.0376 0.0287 0.0221 MAPE 0.0433 0.0541 0.0412 0.0421
Beirut Manama
MAD 0.0623 0.7123 0.0543 0.0459 MAD 0.0765 0.0843 0.0663 0.0431 MSE 0.0588 0.0741 0.342 0.0312 MSE 0.0234 0.0386 0.0123 0.0201 RMSE 146.98% 156.72% 145.97% 123.91% RMSE 205.54% 286.34% 190.75% 103.65% MAPE 0.0345 0.0441 0.0296 0.0257 MAPE 0.0551 0.0589 0.0421 0.0382
Dubai Muscat
MAD 0.0435 0.0534 0.0356 0.0345 MAD 0.0543 0.0567 0.0435 0.0421 MSE 0.0653 0.0851 0.0552 0.0433 MSE 0.0786 0.0854 0.0321 0.0211 RMSE 204.87% 234.76% 201.76% 197.61% RMSE 167.42% 151.62% 123.98% 124.23% MAPE 0.0345 0.0521 0.0289 0.0222 MAPE 0.0421 0.0444 0.0315 0.0301
[image:10.595.212.538.437.743.2]Continued
Jeddah Sharm
MAD 0.0734 0.0842 0.0612 0.0544 MAD 0.0324 0.0652 0.0321 0.0201 MSE 0.0652 0.0765 0.0423 0.0324 MSE 0.0477 0.0578 0.0212 0.02 RMSE 276.66% 323.54% 202.87% 198.76% RMSE 167.23% 178.55% 129.21% 117.54% MAPE 0.0665 0.0885 0.0665 0.0602 MAPE 0.0213 0.0541 0.0345 0.0123
according to the performance measures, while ARIMA was a significantly better predictor. From the above table, it appears that Amman, Dubai, and Sharm El-Shaikh have the lowest errors in models compared to other cities, while Manama produced the highest errors. Overall, ARIMA performed better than the simple moving average method in term of forecasting accuracy using con-ventional techniques.
8.2. Innovative Techniques
One of the contributions of this paper is the use of innovative machine learning tools to forecast room prices. Both RBF and SVM were utilized for prediction, which resulted in significant improvements in performance. The inclusion of external economic factors could also be one reason why these models outper-formed the conventional models.
When comparing the forecasting accuracy of different models and for the eight different cities, it was found that SVM and RBF performed better than ARIMA or the simple moving average. The results show the machine learning technique’s superiority in prediction compared to conventional forecasting models.
9. Conclusions
The use of innovative tools in hotel performance forecasting would help re-searchers as well as practitioners in planning effectively. Hotel internal attributes positively affect hotel performance and more specifically prices. External eco-nomic factors moderate the relationship between the hotel attributes and hotel performance.
The main objective of the study was to predict hotel room prices using new tools. The study shows that SVM is the leading model in “luxury and upscale” hotel room price forecasting, followed by RBF and then ARIMA, while the sim-ple moving average is found in this study to be the inferior model.
Machine learning is insufficiently studied in the hotel and tourism sector in the MENA region, and this study adds to the academic literature. Due to their abundance and rapid development in recent years, future studies could explore other machine learning and artificial intelligence models and compare their performance against traditional models. Other performance measures such as precision and speed of returning results could be used for model evaluation as well. Given the dynamic environment within the tourism and hospitality sector,
policy makers and hotel operators could use these tools to maintain their stra-tegic lead. SVM model or a combination of forecasting models can be utilized to forecast short-term and long-term market direction based on the model strength.
References
[1] WTO. (2016) 2016 Annual Report.
[2] Akm, M. (2015) A Novel Approach to Model Selection in Tourism Demand Mod-eling. Tourism Management,48, 64-72.
https://doi.org/10.1016/j.tourman.2014.11.004
[3] Drew, J.H., Mani, D., Betz, A.L. and Datta, P. (2001) Targeting Customers with Sta-tistical and Data-Mining Techniques. Journal of Service Research,3, 205-219. https://doi.org/10.1177/109467050133002
[4] Hassani, H., et al. (2017) Forecasting Accuracy Evaluation of Tourist Arrivals. An-nals of Tourism Research,63, 112-127. https://doi.org/10.1016/j.annals.2017.01.008 [5] Padhi, S.S. and Aggarwal, V. (2011) Competitive Revenue Management for Fixing Quota and Price of Hotel Commodities under Uncertainty. International Journal of Hospitality Management,30, 725-734. https://doi.org/10.1016/j.ijhm.2010.12.007 [6] Yang, Y., Tang, J., Luo, H. and Law, R. (2015) Hotel Location Evaluation: A
Com-bination of Machine Learning Tools and Web GIS. International Journal of Hospi-tality Management,47, 14-24. https://doi.org/10.1016/j.ijhm.2015.02.008
[7] Youn, H. and Gu, Z. (2010) Predicting Korean Lodging Firm Failures: An Artificial Neural Network Model along with a Logistic Regression Model. International Jour-nal of Hospitality Management,29, 120-127.
https://doi.org/10.1016/j.ijhm.2009.06.007
[8] Ovanovic, J., Krivokapic, Z. and Vujovic, A. (2013) Evaluation of Environmental Impacts Using Backpropagation Neural Network. Kybernetes,42, 698-710.
[9] Uysal, M. (2004) Advancement in Computing: Implications for Tourism and Hos-pitality. Scandinavian Journal of Hospitality and Tourism,4, 208-224.
https://doi.org/10.1080/15022250410003834
[10] Magnini, V.P., Honeycutt Jr., E.D. and Hodge, S.K. (2003) Data Mining for Hotel Firms: Use and Limitations. Cornell Hotel and Restaurant Administration
Quarter-ly. https://doi.org/10.1016/S0010-8804(03)90022-X
[11] Philips, P., Zigan, K., Silva, M.M.S. and Schegg, R. (2015) The Interactive Effects of Online Reviews on the Determinants of Swiss Hotel Performance: A Neural Net-work Analysis. Tourism Management,50, 130-141.
https://doi.org/10.1016/j.tourman.2015.01.028
[12] Pattie, D.C. and Snyder, J. (1996) Using a Neural Network to Forecast Visitor Beha-vior. Annals of Tourism Research,23, 151-164.
https://doi.org/10.1016/0160-7383(95)00052-6
[13] Govers, R., Go, F.M. and Kumar, K. (2007) Virtual Destination Image: A New Measurement Approach. Annals of Tourism Research,34, 977-997.
https://doi.org/10.1016/j.annals.2007.06.001
[14] Law, R. (1998) Room Occupancy Rate Forecasting: A Neural Network Approach. International Journal of Contemporary Hospitality Management,10, 234-239.
https://doi.org/10.1108/09596119810232301
[15] Vu, H.Q., Li, G., Law, R. and Ye, B.H. (2015) Exploring the Travel Behaviors of In-bound Tourists to Hong Kong Using Geotagged Photos. Tourism Management,46,
222-232. https://doi.org/10.1016/j.tourman.2014.07.003
[16] Tkaczynski, A., Rundle-Thiele, S. and Beaumont, N. (2010) Destination Segmenta-tion: A Recommended Two-Step Approach. JournalofTravelResearch, 49, 139-152. https://doi.org/10.1177/0047287509336470
[17] Toral, S.L., Martinez-Torres, M.R. and Gonzalez-Rodrigues, M.R. (2017) Identifica-tion of the Unique Attributes of Tourist DestinaIdentifica-tions from Online Reviews. Journal ofTravelResearch, 1-12.
[18] Dolnicar, S. and Leisch, F. (2004) Segmenting Markets by Bagged Clustering. Aus-tralasianMarketingJournal, 12, 51-65.
https://doi.org/10.1016/S1441-3582(04)70088-9
[19] Brochado, A., Troilo, M. and Shah, A. (2017) Airbnb Customer Experience: Evi-dence of Convergence across Three Countries. Annals of TourismResearch, 63, 210-212.
[20] Geetha, M., Singha, P. and Sinha, S. (2017) Relationship between Customer Senti-ment and Online Customer Ratings for Hotel—An Empirical Analysis. Tourism Management, 61, 43-54. https://doi.org/10.1016/j.tourman.2016.12.022
[21] Hadavandi, E., Ghanbari, A., Shahanaghi, K. and Abbasian-Naghneh, S. (2011) Tourist Arrival Forecasting by Evolutionary Fuzzy Systems. TourismManagement, 32, 1196-1203. https://doi.org/10.1016/j.tourman.2010.09.015
[22] Yu, G. and Schwartz, Z. (2006) Forecasting Short Time-Series Tourism Demand with Artificial Intelligence Models. JournalofTravelResearch, 45, 194-203. https://doi.org/10.1177/0047287506291594
[23] Sohrabi, B., Vanani, I.R., Tahmasebipur, K. and Fazli, S. (2012) An Exploratory Analysis of Hotel Selection Factors: A Comprehensive Survey of Tehran Hotels. In-ternationalJournalofHospitalityManagement, 31, 96-106.
https://doi.org/10.1016/j.ijhm.2011.06.002
[24] Li, H. and Sun, J. (2012) Forecasting Business Failure: The Use of Near-est-Neighbour Support Vectors and Correcting Imbalanced Samples—Evidence from the Chinese Hotel Industry. TourismManagement, 33, 622-634.
https://doi.org/10.1016/j.tourman.2011.07.004
[25] Chen, K.-Y. and Wang, C.-H. (2007) Support Vector Regression with Genetic Algo-rithms in Forecasting Tourism Demand. TourismManagement, 28, 215-226. https://doi.org/10.1016/j.tourman.2005.12.018
[26] Pantano, E., Priporas, C.-V. and Stylos, N. (2017) “You Will Like It!” Using Open Data to Predict Tourists’ Response to a Tourist Attraction. TourismManagement, 60, 430-438. https://doi.org/10.1016/j.tourman.2016.12.020
[27] Shapoval, V., Wang, M.C., Hara, T. and Shioya, H. (2017) Data Mining in Tourism Data Analysis: Inbound Visitors to Japan. JournalofTravelResearch, 57, 310-323 [28] Rong, J., Vu, H.Q., Law, R. and Li, G. (2012) A Behavioral Analysis of Web Shares
and Browsers in Hong Kong Using Targeted Association Rule Mining. Tourism Management, 33, 731-740. https://doi.org/10.1016/j.tourman.2011.08.006
[29] Xiang, Z., Du, Q., Ma, Y. and Fan, W. (2017) A Comparative Analysis of Major On-line Review Platforms: Implications of Social Media Analytics in Hospitality and Tourism. TourismManagement, 58, 51-65.
https://doi.org/10.1016/j.tourman.2016.10.001
[30] Li, G., Law, R., Vu, H.Q. and Rong, J. (2013) Discovering the Hotel Selection Prefe-rences of Hong Kong Inbound Travelers Using the Choquet Integral. Tourism Management, 36, 321-330. https://doi.org/10.1016/j.tourman.2012.10.017
[31] Yang, X., Pan, B., Evans, J.A. and Lv, B. (2015) Forecasting Chinese Tourist with Search Engine Data. TourismManagement, 46, 386-397.
https://doi.org/10.1016/j.tourman.2014.07.019
[32] Guo, Y., Barnes, S.J. and Jia, Q. (2017) Mining Meaning from Online Ratings and Reviews: Tourist Satisfaction Analysis Using Latent Dirichlet Allocation. Tourism Management, 59, 467-483. https://doi.org/10.1016/j.tourman.2016.09.009
[33] Versichele, M., et al. (2014) Pattern Mining in Tourist Attraction Visits through Association Rule Learning on Bluetooth Tracking Data: A Case Study of Ghent, Belgium. TourismManagement, 44, 67-81.
https://doi.org/10.1016/j.tourman.2014.02.009
[34] Sun, X., et al. (2016) Using a Grey-Markov Model Optimized by Cuckoo Search Algorithm to Forecast the Annual Foreign Tourist Arrival to China. Tourism Man-agement, 52, 369-379. https://doi.org/10.1016/j.tourman.2015.07.005
[35] Athanasopoulos, G., Song, H. and Sun, J.A. (2017) Bagging in Tourism Demand Modeling and Forecasting. JournalofTravelResearch, 57, 52-68.
[36] Schwartz, Z. and Hiemstra, S. (2015) Improving the Accuracy of Hotel Reservations Forecasting: Curves Similarity Approach. JournalofTravelResearch, 36, 3-14. [37] Yang, Y., Pan, B. and Song, H. (2014) Predicting Hotel Demand Using Destination
Marketing Organization’s Web Traffic Data. Journal of Travel Research, 53, 433-447. https://doi.org/10.1177/0047287513500391
[38] Tussyadiah, I.P. and Wang, D. (2014) Tourists’ Attitudes toward Proactive Smart-phone Systems. JournalofTravelResearch, 55, 493-508.
[39] Pereira, L.N. (2016) An Introduction to Help Forecasting Methods for Hotel Reve-nue Management. InternationalJournalofHospitalityManagement, 58, 12-23. https://doi.org/10.1016/j.ijhm.2016.07.003
[40] Liu, S., etal. (2012) Analyzing Changes in Hotel Customers’ Expectations by Trip Mode. InternationalJournalofHospitalityManagement, 34, 359-371.
[41] Morosan, C. and DeFranco, A. (2015) Disclosing Personal Information via Hotel Apps: A Privacy Calculus Perspective. International Journal of Hospitality Man-agement, 47, 120-130. https://doi.org/10.1016/j.ijhm.2015.03.008
[42] Wu, D.C., Song, H. and Shen, S. (2017) New Developments in Tourism and Hotel Demand Modeling and Forecasting. InternationalJournalofContemporary Hospi-talityManagement, 29, 507-529. https://doi.org/10.1108/IJCHM-05-2015-0249 [43] Zhang, C. and Zhang, J. (2014) Analysing Chinese Citizens’ Intentions of Outbound
Travel: A Machine Learning Approach. CurrentIssuesinTourism, 17, 592-609. https://doi.org/10.1080/13683500.2013.768606
[44] Chiu, C., Chiu, N.-H., Sung, R.-J. and Hsieh, P.-Y. (2013) Opinion Mining of Hotel Customer Generated Contents in Chinese Weblogs. CurrentIssuesinTourism, 18, 477-495.
[45] Fama, E.F. and French, K.R. (1992) The Cross-Section of Expected Stock Returns. TheJournalofFinance, 2, 427-465.
https://doi.org/10.1111/j.1540-6261.1992.tb04398.x
[46] Lee, C.G. (2011) The Determinants of Hotel Room Rates: Another Visit with Sin-gapore’s Data. InternationalJournalofHospitalityManagement, 30, 756-758. https://doi.org/10.1016/j.ijhm.2010.09.010
[47] Assaf, A.G., Josiassen, A., Woo, L., Agbola, F.W. and Tsionas, M. (2017) Destina-tion Characteristics That Drive Hotel Performance: A State-of-the-Art Global Analysis. TourismManagement, 60, 270-279.
https://doi.org/10.1016/j.tourman.2016.12.010
[48] Fernández, J.I.P., Cala, A.S. and Domecq, C.F. (2011) Critical External Factors Be-hind Hotels’ Investments in Innovation and Technology in Emerging Urban Desti-nations. TourismEconomics, 17, 339-357. https://doi.org/10.5367/te.2011.0033 [49] Martins, L.F., Gan, Y. and Ferreira-Lopes, A. (2017) An Empirical Analysis of the
Influence of Macroeconomic Determinants on World Tourism Demand. Tourism Management, 61, 248-260. https://doi.org/10.1016/j.tourman.2017.01.008
[50] Dogru, T. and Sirakaya-Turk, E. (2017) Engines of Tourism’s Growth: An Examina-tion of Efficacy of Shift-Share Regression Analysis in South Carolina. Tourism Management, 58, 205-214. https://doi.org/10.1016/j.tourman.2016.10.021
[51] Lado-Sestayo, R., Otero-Gonzalez, L., Vivel-Bua, M. and Martorell-Cunill, O. (2016) Impact of Location on Profitability in the Spanish Hotel Sector. Tourism Management, 52, 405-415. https://doi.org/10.1016/j.tourman.2015.07.011
[52] Hanly, P.A. (2012) Measuring the Economic Contribution of the International As-sociation Conference Market: An Irish Case Study. Tourism Management, 33, 1574-1582. https://doi.org/10.1016/j.tourman.2011.12.010
[53] Chatziantoniou, I., Filis, G., Eeckels, B. and Apostolakis, A. (2013) Oil Prices, Tour-ism Income and Economic Growth: A Structural VAR Approach for European Me-diterranean Countries. TourismManagement, 36, 331-341.
https://doi.org/10.1016/j.tourman.2012.10.012
[54] Tang, C.-H. and Jang, S. (2009) The Tourism-Economy Causality in the United States: A Sub-Industry Level Examination. TourismManagement, 30, 553-558. https://doi.org/10.1016/j.tourman.2008.09.009
[55] Ahlert, G. (2008) Estimating the Economic Impact of an Increase in Inbound Tour-ism on the German Economy Using TSA Results. JournalofTravelResearch, 47, 225-234. https://doi.org/10.1177/0047287508321197
[56] Smeral, E. (2009) The Impact of the Financial and Economic Crisis on European Tourism. JournalofTravelResearch, 48, 3-13.
https://doi.org/10.1177/0047287509336332
[57] Seetanah, B. (2011) Assessing the Dynamic Economic Impact of Tourism for Island Economies. AnnalsofTourismResearch, 38, 291-308.
https://doi.org/10.1016/j.annals.2010.08.009
[58] Pratt, S. (2015) The Economic Impact of Tourism in SIDS. AnnalsofTourism Re-search, 52, 148-160.
[59] Burger, C., Dohnal, M., Kathrada, M. and Law, R. (2001) A Practitioner’s Guide to Time-Series Methods for Tourism Demand—A Case Study of Durban, South Afri-ca. TourismManagement, 22, 403-409.
https://doi.org/10.1016/S0261-5177(00)00068-6
[60] Galavi, H., Mirzaei, M., Shui, L.T. and Valizadeh, N. (2013) Klang River-Level Fo-recasting Using ARIMA and ANFIS Models. Journal—AmericanWaterWorks As-sociation, 105, E496-E506. https://doi.org/10.5942/jawwa.2013.105.0106
[61] Wei, C.-C. (2012) RBF Neural Networks Combined with Principal Component Analysis Applied to Quantitative Precipitation Forecast for a Reservoir Watershed during Typhoon Periods. JournalofHydrometeorology, 13, 722-734.
https://doi.org/10.1175/JHM-D-11-03.1
[62] Moradkhani, H., Hsu, K.-L., Gupta, H.V. and Sorooshian, S. (2004) Improved Streamflow Forecasting Using Self-Organizing Radial Basis Function Artificial Neural Networks. JournalofHydrology, 295, 246-262.
https://doi.org/10.1016/j.jhydrol.2004.03.027
[63] Pan, Y., Xiao, Z., Wang, X. and Yang, D. (2017) A Multiple Support Vector Ma-chine Approach to Stock Index Forecasting with Mixed Frequency Sampling. Knowledge-BasedSystems, 122, 90-102.
https://doi.org/10.1016/j.knosys.2017.01.033
[64] Chatfield, C. (1995) The Analysis of Time Series: An Introduction. Chapman & Hall/CRC, Bath.