Tadashi Iwamoto1, Yoshiyuki Takata1, Nobutaka Kitamura2,Daichi Hasebe1, Tadaharu Kobayashi1*, Chikara Saito1
1Division of Reconstructive Surgery for Oral and Maxillofacial Region, Department of Tissue Regeneration and Reconstruction, Graduate School of Medical and Dental Sciences, Niigata University, Niigata, Japan
2Division of Information Science and Biostatistics, Department of Imformatics and Pharmaceutics, Course for Community Disease Control, Graduate School of Medical and Dental Sciences, Niigata University, Niigata, Japan
Email: *tadaharu@dent.niigata-u.ac.jp
Received 30 May 2012; revised 5 July 2012; accepted 15 July 2012
ABSTRACT
Objectives: The aim of this study was to identify in- dependent prognostic predictors of the efficacy of oral appliance (OA) therapy for obstructive sleep ap- nea syndrome (OSAS). Materials and methods: The subjects consisted of 89 patients (77 males and 12 fe- males) in whom OSAS had been treated with an OA. The mean age of the subjects was 52.4 years (range: 20 to 78 years) and mean body mass index (BMI) was 23.9 kg/m2 (range: 17.3 to 32.2 kg/m2). Lateral cepha- lograms were taken and 15 angle, 15 distance and 5 area measurements were calculated by means of a computerized program. Overnight polysomnography (PSG) was performed before treatment and several months after titration of OA therapy. OA therapy was considered effective if the apnea-hypopnea index several months after titration was under 15 events/h and was reduced to at least 50% of that before treat-ment. The examined data such as patient age, sex, BMI, data from cephalometric analyses, Epworth sleepiness scale, and data for pretreatment PSG were analyzed statistically, and multivariate logistic re-gression analysis was performed to clarify predictive variables for treatment outcome. Results: LFH (OR = 0.350; p = 0.035) and McN-A (OR = 0.276; p = 0.057) were selected as independent predictors from the ex-planatory variables. The predictive accuracy of the calculated logistic regression model was 74.2%. Con-clusion: This results show that OA therapy for OSAS is more effective in patients with large anteroposte-rior diameter of the maxilla and large lower facial height.
Keywords:Obstructive Sleep Apnea Syndrome; Oral
Appliance Therapy; Predictors of Response
1. INTRODUCTION
Obstructive sleep apnea syndrome (OSAS) is a poten- tially life-threatening disorder caused by repetitive nar- rowing and occlusion of the upper airway during sleep, and it has been associated with loud snoring and apnea. OSAS is considered to be a risk factor for hypertension, ischemic myocardial diseases and cerebral vascular dis- eases [1,2], and it is also considered to be a cause of traf- fic accidents due to sleepiness in the daytime [3,4].
Recently, conservative treatments such as nasal con- tinuous positive airway pressure (NCPAP) and oral ap- pliance (OA) therapy have been used as primary treat- ment for OSAS. NCPAP has become the prime choice because of its safety and effectiveness, though therapeu- tic compliance is not high because of the sense of in- compatibility of the device used in this therapy and dif- ficulty in handling the device. Reports on OA therapy as an alternative to NCPAP began to appear in the 1980s. Crossoverstudies comparing OA therapy and NCPAP [5-9] have generally shownOA therapy to be less effective (15% - 55% therapeutic success rates)than NCPAP. Ac-cording to clinical guidelines for the treatment of snoring and obstructive sleep apnea with an OA advocated by the American Sleep Disorders Association [10], OA therapy is indicated for treatment of patients with primary snor-ing or mild OSAS. OA therapy may also be indicated for treatment of patients with moderate or severe OSAS who refuse NCPAP treatment. OA therapy is probably per- ceived as being less intrusive and less disruptive to personallife than NCPAP [11-14]. Severity of OSAS is considered to be one of prognostic predictors of OSAS in patients receiving OA therapy, but other variables such as skeletal pattern, age and degree of obesity also affect treatment outcomes. The aim of this study was to iden-tify independent prognostic predictors of the efficacy of OA therapy for OSAS.
2. SUBJECTS AND METHODS
2.1. Subjects
The medical records of patients in whom OSAS had been treated with an OA in the Clinic for Snoring and Ob- structive Sleep Apnea of the Department of Oral and Maxillofacial Surgery, Niigata University Medical and Dental Hospital were reviewed and a retrospective cohort study was performed. The subjects consisted of 89 pa- tients (77 males and 12 females) with complete set of data. The mean age of the subjects was 52.4 years (range: 20 to 78 years), and mean body mass index (BMI) was 23.9 kg/m2 (range: 17.3 to 32.2 kg/m2). All patients gave informed consent to the OA therapy and the study was conducted in accordance with the Helsinki Declaration.
2.2. Oral Appliance (OA)
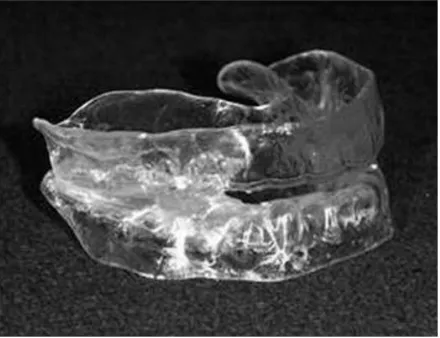
In our clinic, a mono-block type mandibular advance- ment device (Figure 1) has been used for OA therapy in
patients with mild OSAS and in patients with moderate or severe OSAS who could not continue the NCPAP. Patients were first examined to confirm that they did not have many missing teeth, advanced periodontitis or symptoms of temporomandibular disorder. The appliance was initially fabricated at 50% - 70% of the patient’s maximal protrusive position of the mandible and titrated to the position where the patient or bed partner noticed a subjective improvement and there were no side effects such as temporomandibular symptoms or tooth pain.
2.3. Epworth Sleepiness Scale
Subjective excessive daytime sleepiness was screened by the Epworth sleepiness scale (ESS) [15], which is a self- administered questionnaire with eight items.
2.4. Cephalometric Analyses
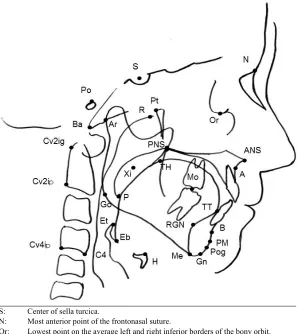
Lateral cephalograms of the subjects were taken with the Frankfort horizontal plane (FH plane) parallel to the floor and with the patient in a centric occlusion. The cephalograms were traced to identify landmarks of hard and soft tissues (Figure 2). The measuring points were
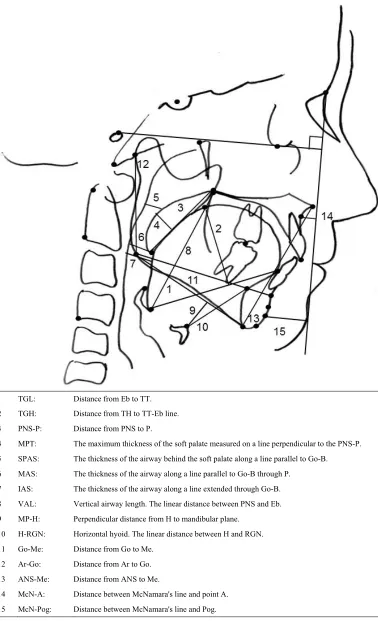
digitized as two-dimensional coordinate values to calcu- late 15 angles (Figure 3), 15 distances (Figure 4) and 5
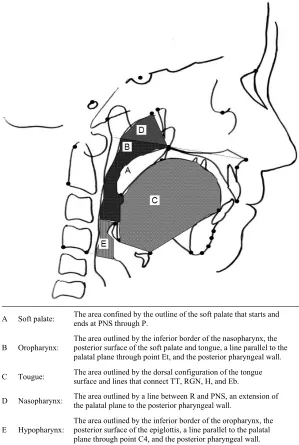
area measurements (Figure 5) by means of a computer-
ized program (CephaloMetrics A to Z Ver.12; YASU- NAGA Computer Systems Co., Inc., Fukui).
2.5. Arterial Oxygen Saturation with Pulse Oximetry Inspection When Sleeping
Arterial oxygen saturation was measured overnight with pulse oximetry before treatment and several months after titration of OA therapy, and lowest SpO2 during the
measurement period and CT90 (cumulative percentage time at SpO2 below 90% during the measurement period) were calculated.
2.6. Overnight Polysomnography
Overnight polysomnography (PSG) was performed be- fore treatment and several months after titration of OA therapy, and apnea-hypopnea index (AHI: sums of counts of apnea and hypopnea per hour of sleep) and arousal index (number of spontaneous arousals multiplied by number of hours of sleep) were calculated. This exami-nation was conducted in our hospital or cooperating me- dical institutions.
2.7. Criteria of Effectiveness
OA therapy was considered effective if AHI several months after titration was under 15 events/h and was reduced to at least 50% of that before treatment.
2.8. Statistical Analysis
Data including patient age, sex, BMI, and results of cephalometric analyses, ESS and pretreatment PSG were analyzed statistically and multivariate logistic regression analysis was performed to clarify independent prognostic predictors of the efficacy of OA therapy for OSAS.
[image:2.595.314.534.537.706.2]The medians of relevant variables were set to cut-off values, and the variables were assigned to two groups. Odds ratios (ORs) were calculated to evaluate associa- tions between the variables and the therapeutic effect, and univariate analysis was performed. The extent of inter- correlation among the variables was considered by Spearman’s rank correlation coefficient, and valuables without high intercorrelation were selected. Explanatory variables were extracted by performing logistic regression analysis using the stepwise procedure, and the forecast
S: Center of sella turcica.
N: Most anterior point of the frontonasal suture.
Or: Lowest point on the average left and right inferior borders of the bony orbit.
Po: Highest point on the superior surface of soft tissue of the external auditory meatus.
Pt: Pterygoid point.
R: Root of pharynx.
Ba: Midpoint of the anterior border of the foramen magnum.
Ar: Intersection between the external contour of the cranial base and the dorsal contour of the condylar head or neck.
Xi: Geometric center of the ramus of the mandible.
ANS: Apex of the anterior nasal spine.
PNS: Intersection between the nasal floor and the posterior contour of the maxilla.
A: Most posterior point on the anterior contour of the upper alveolar process.
B: Most posterior point on the anterior contour of the lower alveolar process.
PM: Protuberance menti.
Pog: Most anterior point of the contour of the chin.
Gn: Point on the chin determined by bisecting the angle formed by the facial and mandibular planes.
Me: Most inferior point on the mandibular symphysis.
Go: Most posterior-inferior point on the convexity of the angle of the mandible.
H: Most anterior-superior point on the body of the hyoid bone.
Eb: Most anterior-inferior point of the epiglottic fold.
Et: Tip of the epiglottis, the most superior point of the epiglottis.
P: Lowest point of the soft palate.
TT: Most anterior point of the tip of the tongue.
TH: Farthest point on the tongue dorsum from the TT-Eb line.
Mo: First molar contact point.
C4: Fourth cervical vertebra, the most anterior inferior point of it.
Cv2ig: Tangent point at the superior, posterior extremity of the odontoid process of the second cervical vertebra.
[image:3.595.150.447.86.420.2]Cv2ip: Most inferior-posterior point on the corpus of the second cervical vertebrae. Cv4ip: Most inferior-posterior point on the corpus of the fourth cervical vertebra.
① SNA: Angle between line S-N and line N-A.
② SNB: Angle between line S-N and line N-B.
③ ANB: Difference between SNA and SNB.
④ SNpog: Angle between line S-N and line N-Pog.
⑤ LFH: Angle between line ANS-Xi and line PM-Xi.
⑥ SN-PP: Angle between line S-N and palatal plane.
⑦ SN-OP: Angle between line S-N and occlusal plane.
⑧ SN-MP: Angle between line S-N and mandibular plane.
⑨ Y-axis: Angle between FH plane and line S-Gn.
⑩ Facial axis: Angle between line Ba-N plane and line Pt-Gn.
⑪ Gonial angle: Angle between ramus plane and mandibular plane.
⑫ Facial angle: Angle between FH plane and facial plane.
⑬ MP: Angle between FH plane and mandibular plane.
⑭ OPT/NSL: Angle between OPT (line through Cv2ig and Cv2ip) and NSL (line N-S).
[image:4.595.92.502.81.515.2]⑮ CVT/NSL: Angle between CVT (line through Cv2ig and Cv4ip) and NSL (line N-S).
1 TGL: Distance from Eb to TT.
2 TGH: Distance from TH to TT-Eb line.
3 PNS-P: Distance from PNS to P.
4 MPT: The maximum thickness of the soft palate measured on a line perpendicular to the PNS-P.
5 SPAS: The thickness of the airway behind the soft palate along a line parallel to Go-B.
6 MAS: The thickness of the airway along a line parallel to Go-B through P.
7 IAS: The thickness of the airway along a line extended through Go-B.
8 VAL: Vertical airway length. The linear distance between PNS and Eb.
9 MP-H: Perpendicular distance from H to mandibular plane.
10 H-RGN: Horizontal hyoid. The linear distance between H and RGN.
11 Go-Me: Distance from Go to Me.
12 Ar-Go: Distance from Ar to Go.
13 ANS-Me: Distance from ANS to Me.
14 McN-A: Distance between McNamara's line and point A.
15 McN-Pog: Distance between McNamara's line and Pog.
[image:5.595.109.487.84.705.2](McNamara’s line: a line drawn perpendicular to the FH from Nasion)
A Soft palate: The area confined by the outline of the soft palate that starts and ends at PNS through P.
B Oropharynx:
The area outlined by the inferior border of the nasopharynx, the posterior surface of the soft palate and tongue, a line parallel to the palatal plane through point Et, and the posterior pharyngeal wall.
C Tougue: The area outlined by the dorsal configuration of the tongue surface and lines that connect TT, RGN, H, and Eb.
D Nasopharynx: The area outlined by a line between R and PNS, an extension of the palatal plane to the posterior pharyngeal wall.
[image:6.595.147.446.85.530.2]E Hypopharynx: The area outlined by the inferior border of the oropharynx, the posterior surface of the epiglottis, a line parallel to the palatal plane through point C4, and the posterior pharyngeal wall.
Figure 5. Cephalometric variables of area measurements.
equation of the efficacy of OA therapy was also calcu- lated. All statistical analysis was carried out with SPSS for Windows, version 11.0 (SPSS Inc., Chicago, USA).
and non-responder group were 21.0 events/h (range: 5.3 to 67.5 events/h) and 20.3 events/h (range: 7.2 to 43.7 events/h), respectively. There were no statistically sig- nificant differences in age, BMI and AHI before treat- ment between the two groups. After OA titration, the mean AHI value in the responder group decreased to 4.9 events/h (range: 0.2 to 10.9 events/h), which was signifi- cantly smaller than the value of 16.9 events/h (range: 7.4 to 41.6 events/h) in the non-responder group by the Mann-Whitney test (p < 0.001) (Table 1).
3. RESULTS
OA therapy was effective for 59 patients (50 males and 9 females) who constituted the responder group. The mean age of the responder group was 51.4 years (range: 20 to 78 years), and that of the non-responder group (27 males and 3 females) was 54.4 years (range: 25 to 73 years). The mean BMI values of the responder group and non-responder group were 24.4 kg/m2 (range: 18.1 to 32.2 kg/m2) and 24.0 kg/m2 (range: 17.3 to 31.5 kg/m2), re- spectively. The mean AHI values of the responder group
Firstly, there were statistically significant differences in Facial Angle and McN-A between the two groups by univariate analysis (Tables 2-6). LFH and McN-A were
Gender (M/F) 50/9 27/3
Age (years) (range) 51.4 (20 - 78) 54.8 (35 - 73) NS
BMI (kg/m2) (range) 24.4 (18.1 - 32.2) 24.0 (17.3 - 31.5) NS
Pre-AHI (/hr) (range) 21.0 (5.3 - 67.5) 20.0 (7.2 - 43.7) NS
Post-AHI (/hr) (range) 4.9 (0.2 - 10.9) 16.6 (7.4 - 41.6) **
Values are expressed as means. NS: not significant; **
[image:7.595.57.540.101.198.2]p < 0.001.
Table 2. Associations between physiological parameters and outcomes of OA therapy.
Responder Non-responder OR 95%CI p-value
Gender male 50 27 0/62 0.15 - 2.47 0.744
female 9 3
Age 52.5> 29 16 0.85 0.35 - 2.04 0.709
≥52.5 30 14
BMI 23.9> 31 16 0.97 0.40 - 2.34 0.944
≥23.9 28 14
[image:7.595.58.540.360.724.2]OR: odds ratio; CI: confidence interval.
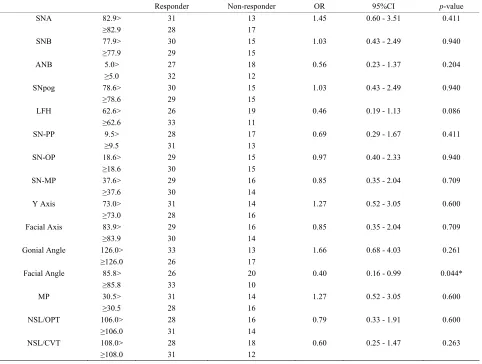
Table 3. Associations between cephalometric angular variables and outcomes of OA therapy.
Responder Non-responder OR 95%CI p-value
SNA 82.9> 31 13 1.45 0.60 - 3.51 0.411
≥82.9 28 17
SNB 77.9> 30 15 1.03 0.43 - 2.49 0.940
≥77.9 29 15
ANB 5.0> 27 18 0.56 0.23 - 1.37 0.204
≥5.0 32 12
SNpog 78.6> 30 15 1.03 0.43 - 2.49 0.940
≥78.6 29 15
LFH 62.6> 26 19 0.46 0.19 - 1.13 0.086
≥62.6 33 11
SN-PP 9.5> 28 17 0.69 0.29 - 1.67 0.411
≥9.5 31 13
SN-OP 18.6> 29 15 0.97 0.40 - 2.33 0.940
≥18.6 30 15
SN-MP 37.6> 29 16 0.85 0.35 - 2.04 0.709
≥37.6 30 14
Y Axis 73.0> 31 14 1.27 0.52 - 3.05 0.600
≥73.0 28 16
Facial Axis 83.9> 29 16 0.85 0.35 - 2.04 0.709
≥83.9 30 14
Gonial Angle 126.0> 33 13 1.66 0.68 - 4.03 0.261
≥126.0 26 17
Facial Angle 85.8> 26 20 0.40 0.16 - 0.99 0.044*
≥85.8 33 10
MP 30.5> 31 14 1.27 0.52 - 3.05 0.600
≥30.5 28 16
NSL/OPT 106.0> 28 16 0.79 0.33 - 1.91 0.600
≥106.0 31 14
NSL/CVT 108.0> 28 18 0.60 0.25 - 1.47 0.263
≥108.0 31 12
OR: odds ratio, CI: confidence interval; *
Responder Non-responder OR 95%CI p-value
TGL 79.9> 27 17 0.65 0.27 - 1.56 0.331
≥79.9 32 13
TGH 43.3> 32 13 1.55 0.64 - 3.76 0.331
≥43.3 27 17
PNS-P 41.0> 29 15 0.97 0.40 - 2.33 0.940
≥41.0 30 15
MPT 10.7> 26 17 0.60 0.25 - 1.46 0.261
≥10.7 33 13
SPAS 8.3> 28 17 0.69 0.26 - 1.67 0.411
≥8.3 31 13
MAS 10.8> 28 17 0.69 0.29 - 1.67 0.411
≥10.8 31 13
IAS 12.9> 26 18 0.53 0.22 - 1.28 0.155
≥12.9 33 12
VAL 76.7> 30 15 1.03 0.43 - 2.49 0.940
≥76.7 29 15
MP-H 19.5> 32 12 1.78 0.73 - 4.34 0.204
≥19.5 27 18
H-RGN 40.4> 30 15 1.03 0.43 - 2.49 0.940
≥40.4 29 15
Go-Me 73.5> 27 18 0.56 0.23 - 1.37 0.204
≥73.5 32 12
Ar-Go 53.6> 29 15 1.03 0.43 - 2.49 0.940
≥53.6 30 15
ANS-Me 78.2> 29 16 0.85 0.35 - 2.04 0.709
≥78.2 30 14
McN-A 0.2> 24 20 0.34 0.14 - 0.86 0.020*
≥0.2 35 10
McN-Pog 9.0> 28 19 0.52 0.21 - 1.29 0.156
≥9.0 31 11
OR: odds ratio, CI: confidence interval; *
[image:8.595.59.542.101.529.2]p < 0.05.
Table 5. Associations between cephalometric area variables and outcomes of OA therapy.
Responder Non-responder OR 95%CI p-value
Soft palate A 3.1> 29 17 0.74 0.31 - 1.79 0.502
≥3.1 30 13
Oropharynx 7.6> 27 18 0.56 0.23 - 1.37 0.204
≥7.6 32 12
Tongue A 34.2> 27 17 0.65 0.27 - 1.56 0.331
≥34.2 32 13
Nasopharynx 2.8> 28 17 0.69 0.29 - 1.67 0.411
≥2.8 31 13
Hypopharynx 2.5> 26 18 0.53 0.22 - 1.28 0.155
≥2.5 33 12
[image:8.595.57.540.567.722.2]Lowest 85.0> 30 20 0.52 0.21 - 1.29 0.155
≥85.0 29 10
CT90 1.4> 34 13 1.78 0.73 - 4.32 0.202
≥1.4 25 17
Arousal 22.8> 32 13 1.55 0.64 - 3.76 0.331
≥22.8 27 17
ESS 12> 31 19 0.64 0.26 - 1.58 0.332
≥12 28 11
[image:9.595.56.540.100.254.2]OR: odds ratio; CI: confidence interval.
Table 7. Independent predictors of response to OA therapy selected by multiple stepwise logistic regression analysis.
Variables OR 95%CI p-value
LFH 0.35 0.13 - 0.93 0.035*
McN-A 0.28 0.10 - 0.73 0.010*
OR: odds ratio; CI: confidence interval; *
p < 0.05.
efficacy of OA therapy by multivariate stepwise logistic regression analysis (likelihood ratio test) (Table 7), and
the following forecast equation was obtained:
p = 1/ (1+ exp – (0.405 – 1.050 × LFH – 1.289 ×
McN-A)).
The positive reaction predictive value was 78.2% and the negative reaction predictive value was 68.4%. Over- all predictive value for OA therapy was 74.2%.
4. DISCUSSION
The prevalence of OSAS in Japanese is probably about 2% and the prevalence of snoring in Japanese is about 13% [16]. Factors that cause obstruction of the upper airway include anatomical factors and functional factors, and anatomical factors such as obesity and craniofacial deformity are thought to play a major role [17-19]. In our previous studies [20,21], obesity rate in the population of Japanese OSAS patients was lower than that in the population of westem OSAS patients and a large number of Japanese OSAS patients had short mandibular body and/or mandibular retrusion. Therefore, Japanese people are thought to be a race in which OSAS can develop eas- ily due to skeletal factors.
In the recent treatment strategy for OSAS, conserva- tive treatments such as NCPAP or OA therapy have been used as the primary treatment. OA therapy may be a first-line choice in treatment of patients withmild OSAS [10] and may also be considered in patients with moderate or severe OSAS who could not continue the NCPAP. A mandibular advancement device was reported
to have a more potent effect for OSAS than other types of OA. This device maintains the anterior position of the mandible during sleep and prevents oropharyngeal airway obstruction indirectly by moving the suprahyoid and genioglossal muscles anteriorly [22]. It was suggested that forward and inferior displacement of the mandible decreases the gravitational effect of the tongue in the supine position [23] and enlarges the velopharynx by stretching the palatoglossal and palatopharyngeal arches [24,25]. In our clinic, a mono-block type mandibular ad- vancement device has been used because the device is simple and economical.
Research data concerning OA therapy have been accu- mulating over the past decade, but the characteristics of patients who would benefit from OA therapy have not been determined sufficiently. Efficacy rates of OA therapy for OSAS in previous studies have varied from 50% to 80% depending on the definition of success [26-29]. In the present study, OA therapy was effective for 73.7% of the patients when responders were defined as patients showing at least 50% reduction in AHI compared with that before treatment and an AHI < 15 events/h when using an OA. Because of this limitation in effectiveness, researchers have tried to determine whether pretreatment parameters can predict outcomes of OA therapy. Although some authors could not identify cephalometric variables as prognostic predictors of the efficacy of OA therapy for OSAS [27,30], others reported correlations between outcomes of OA therapy and cephalometric variables [31-39]. Eveloff et al. [31] found a significantly
smaller mandible-hyoid bone distance in responders to OA therapy than in nonresponders and they also reported that AHI after OA titration could be predicted by base- line AHI and four cephalometric variables(SNA, poste- rior airway space, mandibular-hyoid distance, and poste- rior facial height). Mehta et al. [36] formulated a con-
[image:9.595.56.287.303.343.2]lometric variables. Liu et al. [37] used percentage change
in AHI to classify subjects into good, moderate, and poor responder groups and they reported that OA therapy is more effective in younger and less obese patients with long maxilla, small oropharynx, smaller overjet, less erupted maxillary molars, and large ratio of vertical air- way length to cross-sectional area of the soft palate. Marklund et al. [34] reported that reduction of AHI using
an OA is associated with normal mandibular plane angle and small anterior lower anterior facial height. Skinner et al. [40] reported that increased mandibular-hyoid distance
is the only cephalometric variable associated with a good clinical outcome of OA therapy. Hoekema et al. [38]
reported that the outcome of OA therapy was favorable, especially in less obese patients with mild sleep apnea and mandibular retrognathism. Andrew [39] reported that larger SNMP, which is the angle between the cranial base and the mandibular plane, was the only cephalomet- ric variable related to the efficacy of OA therapy. In the present study, multivariate logistic regression analysis demonstrated that wider LFH and larger McN-A were independent prognostic predictors for clinical outcomes of OA therapy. These results indicate that OA therapy is more effective in patients with large anteroposterior di- ameter of the maxilla and large lower facial height. Al- though there are some conflicting reports on prognostic predictors of OA therapy [37], we think that the oro- pharyngeal airway and tongue space may not be enlarged effectively by the use of an OA in patients with small anteroposterior diameter of the maxilla and small lower facial height.
This study had several limitations. A lateral cephalogram is a two-dimensional representation of three-dimensional structures, which was obtained in an awake state and an upright position, but this imaging technique has the ad- vantages of low cost, convenience, stability and minimal radiation compared to three-dimensional (3D) imaging using MRI or CT. However, analyses of 3D imagings may be needed to make accurate assessments of three- dimensional maxillofacial morphology and oropharyn- geal airway space. Moreover, neuromuscular functional analysis may be needed to clarify functional factors. Even so, the positive reaction predictive value of the prediction formula in this study was 78.2%, which ex- ceeded the true response rate, and the negative reaction predictive value was 66.7%, which exceeded the true invalid coefficient. The overall predictive value for OA therapy was 74.2%, which is of sufficient accuracy for clinical use.
5. CONCLUSION
The results of this study suggested that nonresponders have small anteroposterior diameter of the maxilla and
small lower facial height and that the independent prog- nostic predictors of the efficacy of OA therapy for OSAS are LFH and McN-A of cephalometric measurements. The overall predictive value for OA therapy by multi- variate logistic regression analysis was 74.2%, which is of sufficient accuracy for clinical use.
REFERENCES
[1] Bixler, E.O., Vgontzas, A.N., Lin, H.-M., et al. (2000)
Association of hypertension and sleep-disordered breathing.
Archives of Internal Medicine, 160, 2289-2295. doi:10.1001/archinte.160.15.2289
[2] Kieiy, J.L. and McNicholas, W.T. (2000) Cardiovascular risk factors in patients with obstructive sleep apnoea syndrome. European Respiratory Journal, 16, 128-133. doi:10.1034/j.1399-3003.2000.16a23.x
[3] Findley, L.J., Unverzagt, M.E. and Suratt, P.M. (1988) Automobile accidents involving patients with obstructive sleep apnea. The American Review of Respiratory Disease,
138, 337-340.
[4] Strohl, K., Bonnie, R., Findly, L., et al. (1994) Sleep
apnea, sleepiness, and driving risk. American Journal of Respiratory and Critical Care Medicine, 150, 1463-1473.
[5] Clark, G.T., Blumenfeld, I., Yoffe, N., et al. (1996) A
crossover study comparing the efficacy of continuous positive airway pressure with anterior mandibular position- ing devices on patients with obstructive sleep apnea. Chest,
109, 1477-1483. doi:10.1378/chest.109.6.1477
[6] Ferguson, K.A., Ono, T., Lowe, A.A., et al. (1996) A
randomized crossover study of an oral appliance vs nasal- continuous positive airway pressure in the treatment of mild-moderate obstructive sleep apnea. Chest, 109, 1269-
1275. doi:10.1378/chest.109.5.1269
[7] Ferguson, K.A., Ono, T., Lowe, A.A., et al. (1997) A
short-term controlled trial of an adjustable oral appliance for the treatment of mild to moderate obstructive sleep apnoea. Thorax, 52, 362-368. doi:10.1136/thx.52.4.362
[8] Randerath, W.J., Heise, M., Hinz, R., et al. (2002) An
individually adjustable oral appliance vs continuous positive airway pressure in mild-to-moderate obstructive sleep apnea syndrome. Chest, 122, 569-575.
doi:10.1378/chest.122.2.569
[9] Tan, Y.K., L’Estrange, P.R., Luo, Y.-M., et al. (2002) Mandibular advancement splints and continuous positive airway pressure in patients with obstructive sleep apnoea: A randomized cross-over trial. European Journal of Ortho- dontics, 24, 239-249. doi:10.1093/ejo/24.3.239
[10] American Sleep Disorders Association (1995) Practice parameters for the treatment of snoring and obstructive sleep apnea with oral appliances. Sleep, 18, 511-513. [11] Krieger, J. (1998) New frontiers in the management of
obstructive sleep apnoea syndrome. Monaldi Archives for Chest Disease, 53, 515-519.
[12] Schmidt-Nowara, W., Lowe, A., Wiegand, L., et al. (1995)
[14] Dort, L.C., Hadjuk, E. and Remmers, J.E. (2006) Man- dibular advancement and obstructive sleep apnoea: A method for determining effective mandibular protrusion.
The European Respiratory Journal, 27, 1003-1009. [15] Johns, M.W. (1991) A new method for measuring
day-time sleepiness: The Epworth sleepiness scale. Sleep, 14,
540-545.
[16] Ohta, Y., Kawakami, Y., Takishima, T., et al. (1993) Sleep-
disordered breathing in Japan: An overview. The Japa- nese Journal of Thoracic Diseases, 31, 12-18.
[17] Pracharktam, N., Nelson, S., Hans, M.G., et al. (1996)
Cephalometric assessment in obstructive sleep apnea.
American Journal of Orthodontics and Dentofacial Or-thopedics, 109, 410-419.
doi:10.1016/S0889-5406(96)70123-3
[18] Lowe, A.A., Ono, T., Ferguson, K.A., et al. (1996)
Cephalometric comparisons of craniofacial and upper airway structure by skeletal subtype and gender in pa-tients with obstructive sleep apnea. American Journal of Orthodontics and Dentofacial Orthopedics, 110, 653-664. doi:10.1016/S0889-5406(96)80043-6
[19] Baik, U.B., Suzuki, M., Ikeda, K., et al. (2002) Relation-ship Between cephalometric characteristics and obstruc-tive site in obstrucobstruc-tive sleep apnea syndrome. The Angle Orthodontist, 72, 124-134.
[20] Ohdaira, F., Nakamura, K., Nakayama, H., et al. (2007) Demographic characteristics of 3659 Japanese patients with obstructive sleep apnea-hypopnea syndrome diag-nosed by full polysomnography: Associations with ap-nea-hypopnea index. Sleep and Breathing, 11, 93-101. doi:10.1007/s11325-006-0087-5
[21] Ishiguro, K., Kobayashi, T., Kitamura, N., et al. (2009)
Relationship between severity of sleep-disordered breath- ing and craniofacial morphology in Japanese male patients.
Oral Surgery, Oral Medicine, Oral Pathology, Oral Ra-diology and Endodontics, 107, 343-349.
doi:10.1016/j.tripleo.2008.08.021
[22] Tegelberg, A., Wilhelmsson, B., Walker-Engström, M.L.,
et al. (1992) Effects and adverse events of a dental appli-
ance for treatment of obstructive sleep apnoea. Swedish Dental Journal, 23, 117-126.
[23] Liu, Y.H., Zeng, X.L., Fu, M.K., et al. (2000) Effects of a
mandibular repositioner on obstructive sleep apnea. A- merican Journal of Orthodontics and Dentofacial Ortho- pedics, 118, 248-256.
doi:10.1067/mod.2000.104831
[24] Isono, S., Tanaka, A., Sho, Y., et al. (1995) Advancement
of the mandible improves velopharyngeal airway patency.
Journal of Applied Physiology, 79, 2132-2138.
[25] Ryan, C.F., Love, L.L., Peat, D., et al. (1999) Mandibular
advancement oral appliance therapy for obstructive sleep apnoea: Effect on awake calibre of the velopharynx.
Thorax, 54, 972-977. doi:10.1136/thx.54.11.972
obstructive sleep apnea. Sleep, 19, 794-800.
[28] Rose, E., Staats, R., Virchow, C., et al. (2002) A compa-
rative study of two mandibular advancement appliances for the treatment of obstructive sleep apnoea. European Journal of Orthodontics, 24, 191-198.
doi:10.1093/ejo/24.2.191
[29] Pancer, J., Al-Faifi, S., Al-Faifi, M., et al. (1999) Evalua-
tion of variable mandibular advancement appliance for treatment of snoring and sleep apnea. Chest, 116, 1511-
1518. doi:10.1378/chest.116.6.1511
[30] Ferguson, K.A., Ono, T., Lowe, A.A., et al. (1997) A
short term controlled trial of an adjustable oral appliance for the treatment of mild to moderate obstructive sleep apnoea. Thorax, 52, 362-368.
doi:10.1136/thx.52.4.362
[31] Eveloff, S.E., Rosenberg, C.L., Carlisle, C.C., et al. (1994)
Efficacy of a Herbst mandibular advancement device in obstructive sleep apnea. American Journal of Respiratory and Critical Care Medicine, 149, 905-909.
[32] Yoshida, K. (1994) Prosthetic therapy for sleep apnea syndrome. Journal of Prosthetic Dentistry, 72, 296-302.
doi:10.1016/0022-3913(94)90343-3
[33] Mayer, G. and Meier-Ewert, K. (1995) Cephalometric pre- dictors for orthopaedic mandibular advancement in obstruc- tive sleep apnoea. European Journal of Orthodontics, 17,
35-43.
[34] Marklund, M., Franklin, K.A., Stenlund, H., et al. (1998)
Mandibular morphology and the efficacy of a mandibular advancement device in patients with sleep apnoea. Euro- pean Journal of Oral Sciences, 106, 914-921.
doi:10.1046/j.0909-8836.1998.eos106503.x
[35] Rose, E., Lehner, M., Staats, R., et al. (2002) Cepha-
lometric analysis in patients with obstructive aleep apnea. Part 2: Prognostic value in treatment with a mandibular advancement device. Journal of Orofacial Orthopedics,
63, 315-324. doi:10.1007/s00056-002-0058-9
[36] Mehta, A., Qian, J., Petocz, P., et al. (2001) A randomized,
controlled study of a mandibular advancement splint for obstructive sleep apnea. American Journal of Respiratory and Critical Care Medicine, 163, 1457-1461.
[37] Liu, Y., Lowe, A.A., Fleetham, J.A., et al. (2001) Ce-
phalometric and physiologic predictors of the efficacy of an adjustable oral appliance for treating obstructive sleep apnea. American Journal of Orthodontics and Dentofa-cial Orthopedics, 120, 639-647.
doi:10.1067/mod.2001.118782
[38] Hoekema, A., Doff, M.H.J., De Bont, L.G.M., et al. (2007)
Predictors of obstructive sleep apnea-hypopnea treatment outcome. Journal of Dental Research, 86, 1181-1186. doi:10.1177/154405910708601208
[40] Skinner, M.A., Robertson, C.J., Kingshott, R.N., et al.
(2002) The efficacy of a mandibular advancement splint


![ECG_-C.1B[1].pdf](data:image/gif;base64,R0lGODlhAQABAIAAAP///wAAACH5BAEAAAAALAAAAAABAAEAAAICRAEAOw==)