Bioremediation of lead by lead-resistant microorganisms,
isolated from industrial sample
Sabyasachi Chatterjee*, Anindita Mukherjee, Agniswar Sarkar, Pranab Roy Department of Biotechnology, The University of Burdwan, Burdwan, India
Email: *sabsach@rediffmail.com
Received 8 February 2012; revised 22 March 2012; accepted 12 April 2012
ABSTRACT
Lead contamination in water is a widespread problem throughout the world and results from industrial use and processing of lead ore. Bio-availability of lead can be hazardous for children and causes mental retarda- tion. The use of lead free petrol is one measure to check this pollution, but this heavy metal is also pre- sent in industrial effluents and need to be removed before these effluents are discharged to natural land or water and as well as to the environment. Using bioremediation, bacteria could render lead non- bioavailable would provide an alternative option for detoxifying this contaminant in the environment. The property of some species of bacteria and algae, to ex-tract metals from their surroundings, has been util- ized to purify industrial effluents. The first step in devising a bioremediation strategy is to identify can- didate bacterial strains capable of modifying the con- taminant. Biotechnological approaches are recom- mended for extraction of metal forms can be grown in ponds where effluents (rich in heavy metals) are dis- charged. The microbes will extract the heavy metals and sequester them inside their cell membranes. The goal of the present study was to examine the capacity of lead resistant bacteria and bioremediation of lead contaminated water.
Keywords:Bioremediation; Lead Resistant Bacteria;
Industrial Bioremediation; Industrial Effluent Toxicity
1. INTRODUCTION
Living system requires special transport and handling mechanisms to keep them from toxic metals [1]. The toxicity occurs in humans due to environmental pollution via soil or water contamination or due to occupational exposure. Some of these metals are useful to us in low concentrations but are highly toxic in higher concentra- tions [2]. Bioremediation processes are very attractive in
comparison with physicochemical methods such as elec- trochemical treatment, ion exchange, precipitation, re- verse osmosis, evaporation, and sorption for heavy metal removal techniques because they can have lower cost and higher efficiency at low metal concentrations [3,4]. There are a number of bio materials that can be use to remove metal from waste water, such molds, yeasts, bac- teria, and seaweeds [5,6]. The ability of microbial stains to grow in the presence of heavy metals would be helpful in the waste water treatment where microorganisms are directly involved in the decomposition of organic matter in biological processes for waste water treatment [7,8], because often the inhibitory effect of heavy metals is a common phenomenon that occurs in the biological treatment of waste water and sewage [9]. Mechanisms of metal resistance in microbes include precipitation of metals as phosphates, carbonates and/or sulfides; vola- tilization via methylation or ethylation; physical exclu- sion of electronegative components in membranes and extra cellular polymeric substances (EPS); energy-de- pendent metal efflux systems; and intra cellular seques- tration with low molecular weight, cysteine-rich proteins [10,11]. Growth rate of the sewage isolates in the pres- ence of heavy metal (Cd, Ni, As and Pb) were consis- tently slower than that of the control similar results have been reported earlier [12,13]. In most of the studies, metal resistance has been reported to hold an association with antibiotic resistance [14-16]. Lead (Pb), a major pollutant that is found in soil, water and air. This metal is also hazardous waste and highly toxic to human, animals, plants and microbes [17]. There are some yeast like
Rhodotorula mucilaginosa which is efficient in lead
bioadsorption [18]. Hexavalent chromium (Cr (VI)) and trivalent chromium (Cr (III)) are the most prevalent spe- cies of chromium in the natural environment [19]. In the present study high degree of heavy metals resistance associated with multiple antibiotics resistance was de- tected in sewage bacteria. The present study focuses on two lead resistant bacterial strains isolated from sewage water, have metal and antibiotics resistance property and also produce exopolysaccharide. These identified heavy
metal resistant bacteria could be useful for the bioreme- diation of heavy metal contaminated sewage and waste water.
2. MATERIALS AND METHODS
2.1. Sample Collection and Isolation of Lead Resistant Bacteria
Samples were collected from Tamlanala Khal, Durgapur Steel Plant (D.S.P.), West Bengal, India, where effluent discharged from the above industry. Samples were ino- culated in nutrient agar (pH ±7.0) plates along with lead acetate with increasing concentrations as 1 mM to 7 mM
respectively and incubated at 37˚C for 24 h.
2.2. Microbial Assay, Biochemical Test and Morphological Characterization
After 24 h of incubation 60 colonies were found in plate containing 1 mM lead acetate and around 24 colonies in plate containing 2 mM lead acetate concentration. From both plates, one colony had been selected and designated as A1 and A2. There were no colonies in the plates con- taining higher concentration of lead ions. Morphological
characteristics were observed (Table 1) by bright field
microscopy (Olympus GB 89954). Colonies were char- acterized by Gram’s staining, endospore staining and scanning electron microscopy (SEM). Biochemical tests were performed with isolated bacteria (Table 2, Figure 1).
2.3. Genomic DNA Isolation and PCR Analysis Genomic DNA was isolated followed by the modifica- tion of Vincent and Janarthanan’s protocol [20]. Over- night bacterial cells were cultured in nutrient broth at
37˚C and 3.0 ml of each culture were transferred in a mi-
[image:2.595.308.537.83.277.2]cro centrifuge tube respectively and centrifuged at 10,000
Table 1. Morphological characteristics of isolates obtained by staining and SEM.
Sample Morphological character
A1 Gram positive, short rods, endospore former, no cilia or flagella.
[image:2.595.56.284.545.599.2]A2 Gram positive, rod shape, endospore former, no cilia or flagella.
Table 2. Different biochemical tests of isolates.
A1 A2 Tests
Control 2 mM Lead
acetate Control
2 mM Lead acetate Catalase
test Positive
Strongly
positive Positive
Strongly positive Amylase
test Positive Positive Positive Positive
Protease
test Negative Negative Negative Negative
Indole
test Positive Negative Negative Negative
(a) (b) A1
(a) (b) A2
Figure 1. Scanning electron microscopic view of lead resistant bacteria: A1 (a) showing SEM pattern for presence of lead and (b) for absence of lead; A2 (a) showing SEM pattern for pres- ence of lead and (b) for absence of lead.
gx 2 min. Supernatant was removed and pellets were collected and resuspended in 450 µl of TE buffer. 45 µl
of 10% SDS was added and incubated for 1 hour at 37˚C.
500 µl phenol-chloroform mixtures was added and cen- trifuged at 10,000 rpm for 2 minutes. The upper layer was transferred into a new tube and 50 µl of sodium ace- tate was added and mixed. 300 µl of isopropanol was added to precipitate the DNA and washed by dipping the end of the loop into 1 ml of 70% ethanol for 30 seconds and centrifuged briefly. The DNA was re-suspended in 100 - 200 µl TE buffer. Presence of genomic DNA was confirmed by 0.8% agarose gel electrophoresis [20]. PCR amplification was done using 16s rDNA universal primer as 8F 5’AGA GTT TGA TCC TGG CTC AG3’ and 1492R 5’ACG GCT ACC TTG TTA TTA CGA CTT3’ (Primer delivered by Chromous Biotech Ltd., Bengaluru, India). Thermal cycling was performed with Gene Amp PCR System 2400. Amplification reactions were per- formed in 25 uL × 4 tube, (total 100 uL volume), each 25 uL tube containing 20 mmol/L TrisHCl (pH = 8.4), 50
mmol/L KCl, 2.0 mmol/L MgCl2, 200 µmol/L of dNTPs,
1 μmol/L of each primer, 30 ng of genomic DNA and 1.5
U of Taq DNA polymerase (0.5 uL for each 25 uL reac- tion mixture). The temperature profile was followed by
initial denaturation at 95˚C × 3 min; 35 cycles of de-
naturation at 94˚C × 1 min, annealing at 55˚C × 1 min,
and extension at 72˚C × 2 min; and final extension at
72˚C × 3 min. The PCR products were analyzed by elec-
trophoresis on 1.5% agarose gel and stained with ethidium bromide (Sigma). 100 bp ladder was used for evaluating the size of amplicons. DNA bands were visualized and documented using a Gel documentation system (Biorad
[image:2.595.59.285.622.737.2]1 ml of 5% phenol solution was added in each tube. There
after 5 ml of conc. H2SO4 were added in each tube &
kept the tubes in ice-bath till the tubes comes in room temperature. After 30 minutes incubation at room tem- perature OD was taken (OD480) (Table 4, Figure 4). for sequencing in GCC Biotech Pvt. Ltd., Kolkata, West
Bengal, India.
2.4. Determination of Growth Profile
The growth pattern was observed by performing bacterial growth curve experiment. Two sets of 30 ml nutrient broth (in which 1 conical flask contain 2 mM lead ace- tate and another one was control) were taken and inocu- lated with 5 ml of activated culture of isolates respec-
tively and kept in shaker incubator at 180 rpm, 30˚C.
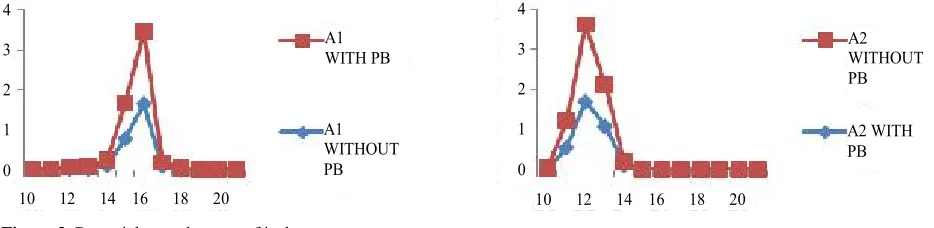
After every 60 minutes interval optical density was taken (OD620) (Figure 3).
2.7. Effect of Temperature, pH, Salt and Minimal Media on Isolates
To study the effect of temperature, pH, salt and minimal media two sets of tubes were prepared. One set contain- ing 2 mM lead acetate with inoculums & other was con- trol without inoculums. The tubes were kept for incuba- tion at different temperatures like 0˚C, 28˚C, 37˚C, 45˚C,
60˚C for 24 h and OD was taken at 620 nm (Figure 5).
To study the effect of pH one control set and one 2 mM lead acetate containing set were prepared and the pH was adjusted from 1 - 9 respectively with the help of 1N HCl and 1N NaOH. Tubes were inoculated with A1 and A2
respectively, incubated at 37˚C for 24 hrs and OD was
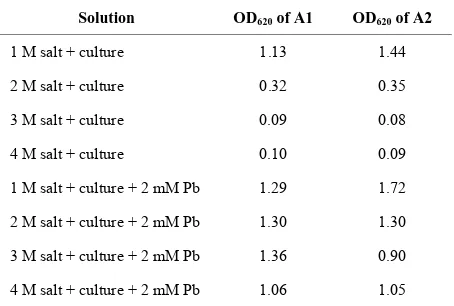
taken at 620 nm (Figure 6). To study the effect of salt
one control set (without inoculam) and one 2 mM lead acetate containing set (with inoculam) were prepared with different concentrations of NaCl (1 M, 2 M, 3 M, 4 M), 2.5. Polysaccharide Test
Four different cultures (A1 with metal, A1 without metal, A2 with metal and A2 without metal) were taken in dif- ferent centrifuge tube and centrifuge it for 10 min at 10,000 rpm and supernatant were separated in different test tubes and washed the pellet with water. Those tubes (containing pellet with water) kept in hot water bath for
15 min at 70˚C. Then 2 - 3 drops of 1(N) HCl were added
into pellet and heated those tubes again for 3 - 4 min in hot water bath and centrifuge those mixtures and sepa- rate the supernatant. Then double volume of 70% ethanol was added with those tubes and previously separated supernatant and pellet treated tubes and all tubes were
kept inrefrigerator for overnight (Table 3). White pre-
cipitate was observed after overnight incubation which was further confirmed by Dubois method [21].
A1 A2
[image:3.595.312.531.379.465.2]2.6. Dubois Method
Figure 2. Agarose gel electrophoresis of genomic DNA. 1.5% Agarose gel electrophoresis showing lead resistant isolates, where two DNA bands were found. Band 1 for sample A1 and Band 2 for sample A2.
200 µl of white precipitate were taken in different test- tubes which were formed after polysaccharide test. Then 2 ml distilled water were added in each tube respectively.
4
3
2
1
0
4
3
2
1
0
10 12 14 16 18 20 10 12 14 16 18 20 A1
WITH PB
A1 WITHOUT PB
A2 WITHOUT PB
[image:3.595.70.537.523.637.2]A2 WITH PB
Figure 3. Bacterial growth curve of isolates.
Table 3. Polysaccharide test result of isolates, where A1: sample 1, A2: sample 2, (++): More precipitate, (+): Less precipitate.
Sample Control for Supernatant Control for Pellet Supernatant + Pb Pellet + Pb
A1 + ++ + ++
A2 + ++ + ++
[image:3.595.59.541.675.734.2]Table 4. Dubois test result of isolates.
Sample OD480
A1 supernatant (without metal) 0.31
A1 pellet (without metal) 0.59
A1 supernatant (with metal) 0.42
A1 pellet (with metal) 0.69
A2 supernatant (without metal) 0.41
A2 pellet (with metal) 0.60
A2 supernatant (with metal) 0.46
A2 pellet (with metal) 0.98
[image:4.595.311.537.85.188.2]A1 A2
Figure 4. Dubois method. A1: Tube 1 and Tube 2 are without lead, Tube 3 and Tube 4 with lead. 1st and 3rd from supernatant, 2nd and 4th from pellet; A2: Tube 1 and Tube 2 are without lead, Tube 3 and Tube 4 with lead. 1st and 3rd from supernatant, 2nd and 4th from pellet.
2
1
0
0 28 37 45 60 A1 WITH PB
A1 WITHOUT PB
A2 WITHOUT PB
A2 WITH PB
0 28 37 45 60
2
1
0
Figure 5. Optimum temperature for growth of isolates.
2
1.5 1
0.5
0 1 2 3 4 5 6 7 8 9
A1 WITH PB
A1 WITHOUT PB
A2 WITHOUT PB
A2 WITH 1.5
1
0.5
0
[image:4.595.56.526.87.454.2]1 2 3 4 5 6 7 8 9
Figure 6. Optimum pH for growth of isolates.
incubated at 37˚C for 24 h and OD was taken at 620 nm
(Table 5). For study the effect of minimal media 2 mM
lead acetate containing minimal media was prepared, one set was inoculated with isolates and other set was kept as control without inoculum. Both the sets were incubated
at 37˚C for 24 h and OD was taken (OD620). Antibiotic
resistant tests also done by “agar cup” method with dif- ferent antibiotics like Tetracyclin, Ampicilin, Kanamycin, Chloramphenicol and Rifampicin.
2.8. Quantification of Lead Accumulation
Atomic Absorption Spectroscopy (AAS) was used for quantification of lead absorption. Isolates were grown in 2 mM lead acetate with nutrient broth and incubated at
37˚C for 72 h. After incubation supernatant were col-
lected. Control was made with 2 mM lead acetate with nutrient broth but without inoculum and sent for AAS at
Durgapur Pollution control board (Table 6).
3. RESULT AND DISCUSSIONS
From the above study it was conclude that the isolated
microbes (i.e. sample A1 and sample A2) grown well at
37˚C - 45˚C and pH 6 - 7, good capability to tolerate
toxic concentration of heavy metal present in industrial effluent. Sample A1 was a Gram positive, rod shape, en- dospore former bacteria. It was amylase, indole positive in presence of 2 mM lead acetate but in absence of lead
acetate it was indole negative (Tables 1 and 2). Sample
A1 utilized xylose, lactose, galactose, sucrose, dextrose,
maltose in presence of 2 mM lead acetate (Table 7).
Sample A2 was also a Gram positive, short rod and en- dospore forming bacteria. A2 was amylase and protease
positive in presence of 2 mM lead acetate (Tables 1 and
2). Sample A2 also utilized xylose, galactose, dextrose,
maltose in presence of 2 mM lead acetate (Table 7).
Sample A2 grown well in minimal media also. After atomic absorption spectroscopy analysis it was observed that concentration of lead ion decreased in supernatant
after 72 h comparing with the control (Table 8). The
morphology of isolates A1 and A2 were unchanged after growth in medium with 2 mM lead acetate which sug- gests that 2 mM concentration of lead acetate was not
Table 5. Effect of salinity on bacterial growth of isolates.
Solution OD620 of A1 OD620 of A2
1 M salt + culture 1.13 1.44
2 M salt + culture 0.32 0.35
3 M salt + culture 0.09 0.08
4 M salt + culture 0.10 0.09
1 M salt + culture + 2 mM Pb 1.29 1.72
2 M salt + culture + 2 mM Pb 1.30 1.30
3 M salt + culture + 2 mM Pb 1.36 0.90
[image:5.595.58.286.284.429.2]4 M salt + culture + 2 mM Pb 1.06 1.05
Table 6. Agar cup assay with A1 and A2 of isolates.
Sample Antibiotic Concentration
(ug/ml) Resistant
Ampicillin 400.00 Yes
Tetracycline 150.00 Yes A1
Chloramphenicol 50.000 Yes
Ampicillin 450.00 Yes
Tetracycline 250.00 Yes
Chloramphenicol 50.000 Yes
A2
[image:5.595.57.285.468.633.2]Streptomycin 5000.00 Yes
Table 7. Acid-gas production test of isolates, where A1: sam- ple 1, A2: sample 2, (+): positive, (–): negative.
A1 + 2 mM
lead acetate Control
A2 + 2 mM
lead acetate Control
Production of Acid/ Gas Sugar
Used
Acid Gas Acid Gas Acid Gas Acid Gas
Xylose (+) (–) (–) (–) (+) (+) (+) (+)
Lactose (–) (–) (+) (–) (–) (–) (+) (–)
Galactose (+) (+) (+) (–) (+) (+) (+) (+)
Sucrose (–) (+) (+) (+) (+) (+) (+) (–)
Dextrose (+) (+) (+) (+) (+) (+) (+) (–)
[image:5.595.57.285.673.731.2]Maltose (+) (+) (–) (–) (+) (+) (+) (–)
Table 8. Concentration of Pb in sample after Atomic Absorp- tion Spectroscopy, where A1: sample 1, A2: sample 2.
Isolates Lead in supernatant at 0 h incubation (mg/ml)
Lead in supernatant after 72 h incubation (mg/ml)
A1 1110 210.842
A2 1110 376.182
studies showed that the lead resistant bacteria produced
large quantities of EPS (Table 3). The Growth curve ex-
periment for A1 showed extended log phase with lead
acetate than in absence of lead acetate (Figure 3). A1
and A2 capable of utilizing wide range of carbohydrates in presence of 2 mM lead acetate in media. In both cases when isolated microbes are inoculated in 2 mM lead acetate containing nutrient broth, color of media changed white to brown after 10 days incubation which may in- dicated the deposition of lead in form of metal complex. These isolated bacteria grown well in nutrient rich media (Nutrient media, Luria burtanii media) as well as in mini-
mal media. Strain A1 grows well at 37˚C - 45˚C and pH
6 - 7. It can tolerate 150 µg/ml of tetracycline, 400 µg/ml of ampicilin, and 50 µg/ml of chloramphenicol. The strain A2 also tolerate 250 µg/ml of tetracycline, 450 µg/ml of ampicilin, 5 mg/ml streptomycin and 50 µg/ml of chlo- ramphenicol.
4. CONCLUSION
From the result of AAS it can be concluded that both isolated lead resistant strains are well efficient and useful for bioremediation of heavy metal contaminated sewage and waste water. These strains are able to grown well in minimal media that could be very helpful in industrial purpose of bioremediation. Strain A1 was more efficient in lead remediation compared to strain A2 though the mechanism of lead remediation is still unknown. Both strains can produce exopolysaccharide. Isolation, purifi- cation, structure of the exopolysaccharide and mecha- nism of lead remediation are further area of interest.
5. ACKNOWLEDGEMENTS
The authors wish to acknowledge Department of Biotechnology, Govt. of India for supporting the research activity. Prof. Pranab Roy wishes to acknowledge Mrigendranath Mondal endowment fund to Burdwan University.
REFERENCES
[1] Rehman, A., Zahoor, A., Muneer, B. and Hasnain, S. (2008) Chromium tolerance and reduction potential of a Bacillus sp.ev3 isolated from metal contaminated wastewater. Bul- letin of Environmental and ContaminationToxicology, 81,
25-29. doi:10.1007/s00128-008-9442-5
[2] Ge, H.W., Lian, M.F., Wen, F.Z., Yun, Y.F., Jian, F.Y. and Ming, T. (2009) Isolation and characterization of the heavy metal resistant bacteria CCNWRS33-2 isolated from root nodule of Lespedeza cuneata in gold mine tailings in China. Journal of Hazard Materials, 162, 50-56.
doi:10.1016/j.jhazmat.2008.05.040
Microbiology Letters, 97, 95-100.
doi:10.1111/j.1574-6968.1992.tb05446.x
[4] Gadd, G.M. and White, C. (1993) Microbial treatment of metal pollution—A working biotechnology. Trends Bio- technology, 11, 353-359.
doi:10.1016/0167-7799(93)90158-6
[5] Vieira, R. and Volesky, B. (2000) Biosorption: A solution to pollution? International Journal of Food Microbialogy,
3, 17-24.
[6] Waisberg, M., Joseph, P., Hale, B. and Beyersmann, D. (2003) Molecular mechanism of cadmium carcinogenesis. Toxicology, 192, 95-117.
doi:10.1016/S0300-483X(03)00305-6
[7] Munoz, R.A., Munoz, M.T., Terrazas, E., Guieysse, B. and Mattisasson, B. (2006) Sequential removal of heavy metals ions and organic pollutants using an algal-bacterial consortium. Chemosphere, 63, 903-991.
doi:10.1016/j.chemosphere.2005.09.062
[8] Prasenjit, B. and Sumathi, S. (2005) Uptake of chromium by Aspergillus foetidus. Journal of Material Cycles and Waste Management, 7, 88-92.
doi:10.1007/s10163-005-0131-8
[9] Filali, B.K., Taoufik, J., Zeroual, Y., Dzairi, F.Z., Talbi, M. and Blaghen, M. (2000) Waste water bacteria resistant to heavy metals and antibiotics. Current Microbiology, 41,
151-156. doi:10.1007/s0028400
[10] Gadd, G.M. (1990) Heavy metal accumulation by bacte- ria and other microorganisms. Experientia, 46, 834-840.
doi:10.1007/BF01935534
[11] Silver, S. (1996) Bacterial resistances to toxic metals—A review. Gene, 179, 9-19.
doi:10.1016/S0378-1119(96)00323-X
[12] Kadirvelu, K. Thamaraiselvi, K. and Namasivayam, C. (2001) Adsorption of nickel (II) from aqueous solution onto activated carbon prepared from coirpith. Seperation and Purification Technology, 24, 477-505.
doi:10.1016/S1383-5866(01)00149-6
[13] Pal, A., Choudhuri, P., Dutta, S., Mukherjee, P.K. and Paul, A.K. (2004) Isolation and characterization of nickel-re- sistant microflora from serpentine soils of Andaman. World Journal of Microbiology and Biotechnology, 20, 881-886.
doi:10.1007/s11274-004-2776-1
[14] Singh, V., Chauhan, P.K., Kanta, R., Dhewa, T. and Kumer, V. (2010) Isolation and characterization of pseudomonas resistant to heavy metals contaminants. International Jour- nal of Pharmaceutical Sciences Review and Research, 3, 165-168.
[15] Silver, S. and Misra, T.K. (1988) Plasmid mediated metal resistance. Annual Review of Microbiology, 42, 717-743.
doi:10.1146/annurev.mi.42.100188.003441
[16] Verma, T., Srinath, T., Gadpayle, R.U., Ramtake, P.W., Hans, R.K. and Garg, S.K. (2001) Chromate tolerant bac- teria isolated from tannery effluent. Bioresource Technol- ogy, 78, 31-35. doi:10.1016/S0960-8524(00)00168-1
[17] Low, K.S., Lee, C.K. and Liew, S.C. (2000) Sorption of cadmium and lead from aqueous solution by spent grain.
Process Biochemistry, 36, 59-64.
doi:10.1016/S0032-9592(00)00177-1
[18] Chatterjee, S., Gupta, D., Roy, P., Chatterjee, N.C., Saha, P. and Dutta, S. (2011) Study of a lead tolerant yeast strain BUSCY1 (MTCC9315). African Journal of Micro- biology Research, 5, 5362-5372.
[19] Chung, J., Nerenberg, R. and Rittmann, B.E. (2006) Bio- reduction of soluble chromate using hydrogen based mem- brane bioflim reactor. Water Research, 40, 1634-1642.
doi:10.1016/j.watres.2006.01.049
[20] Janarthanan, S. and Vincent, S. (2007) Phenol chloroform extraction of DNA. Practical Biotechnology, 29-30.


![5,5′ Bis(diethylamino) 2,2′ [butane 1,4 diyldioxybis(nitrilomethylidyne)]diphenol](data:image/gif;base64,R0lGODlhAQABAIAAAP///wAAACH5BAEAAAAALAAAAAABAAEAAAICRAEAOw==)