© 2016, IRJET ISO 9001:2008 Certified Journal
Page 574
A Review On Denoising Of Images Under Multiplicative Noise
Palwinder Singh
1, Leena Jain
21
Research Scholar,
Punjab Technical University, Kapurthala, India
E-mail: palwinder_gndu@yahoo.com
2
Associate Professor & Head (MCA),
Global Institute of Management and Emerging Technologies, Amritsar-143001, India
E-mail:leenajain79@gmail.com
---***---Abstract:
The major mode of transmission in the modernage is visual information in the form of digital images. The image which we received needs processing before it can be used in any application. Different types of noise models like additive, multiplicative can corrupt the digital image. Multiplicative noise occur in various imaging systems because of random variation in pixel values. The denoising is important because in order to get good results from image analysis , the area of interest in digital images must be clear, sharp and free from noise. In this paper we will compare the number of denoising filters for multiplicative noise that has been developed like wiener filter, lee filter and thresholding based filtering techniques. The future trends in the field of denoising will also be discussed.
KeyWords: Multiplicative Noise, Wiener Filter, Thresholding Techiques, Statistical parameters, SAR Images, Ultrasound Images
1.
INTRODUCTION
Image denoising is the most important step in the image processing for getting good results of image analysis. The digital image can be corrupted with noise during acquisition, retrieval, storage and during the transmission. Noise which occurs in digital images can be classified as, salt and pepper noise, additive white Gaussian noise, and speckle noise [1]. The noise removing in these digital images remains one of the major difficulties in the study of medical imaging because they could mask and can cause blurring of important subtle features in the images. So that’s why image de-noising still remains a challenge for researchers. The main properties of a good image de-noising model are that it will remove noise while preserving edges. The multiplicative noise that is also known as speckle noise mainly occurs in various imaging systems due random variations of the pixel values. It can be defined as the multiplication of random values with the
pixel values. Mathematically multiplicative noise is modeled as:
Multiplicative Noise= I*(1+N)
Where ‘I’ is the original image matrix and ‘N’ is the noise, which is the normal distribution with mean equal to zero. Wiener filtering comes under the non-coherent type of denoising method, which is mainly used as a restoration technique for all type of noisy images[2]. But this filter do not give good result in terms of various quality performance measuring statistical parameters such as Structural Similarity Index Measure (SSIM), Mean-Square-Error (MSE), Signal-to-Noise Ratio (SNR) and Peak-Signal-to-Noise Ratio (PSNR) between original and restored image[3]. Curvelet Transform is a higher version of image representation at fine scales, and it is developed from Wavelet as multi-scale representation. Curvelet transform based algorithms are widely used for image denoising.
2.
MULTIPLICATIVE NOISE
© 2016, IRJET ISO 9001:2008 Certified Journal
Page 575
the image resolution and contrast become reduced, whicheffects the diagnostic value of this imaging modality. So, speckle noise reduction is an essential preprocessing step, whenever ultrasound imaging is used for medical imaging [6]. The probability distribution function for speckle noise is given by gamma distribution,
a z e z
z
P
a )! 1 (
1 )
(
Where z represents the gray level and variance is a2α. The
probability density function of Salt and Pepper noise is graphically represented in figure-3
P(z)
z
Figure-1 Probability density function of speckle noise
It arises from random variations in the strength of the backscattered waves from objects and is seen mostly in RADAR and Ultrasound imaging.
3.
IMAGES
UNDER
MULTIPLICATIVE NOISE
3.1 Synthetic Aperture Radar Imaging (SAR)
Speckle is significant in Synthetic Aperture Radar (SAR) and Ultrasound imaging. Range measurement and resolution are achieved in SAR in the same manner as most other radars: Range is determined by precisely measuring the time from transmission of a pulse to receiving from a target in the wave length range 1mm to 1m of electromagnetic spectrum[7]. The simplest SAR range resolution is determined by the transmitted pulse width, i.e. narrow pulses yield fine range resolution. A narrow synthetic beam width resulting from the relatively long synthetic aperture, yields finer resolution than the resolution possible from a smaller physical antenna[8]. Targets ahead of the aircraft produce a positive Doppler offset, targets behind the aircraft produce a negative offset. The target’s doppler frequency determines its azimuth position. While this section attempts to provide
an intuitive understanding, SARs are not as simple as described above. Transmitting short pulses to provide range resolution is generally not practical. The application of SAR imaging is increased day by day due to the development of new technologies and innovative ideas[9].
Figure-2 Synthetic Aperture Radar Imaging
The areas, where this imaging technique used are given as: Navigation and Guidance
Treaty Verification and Nonproliferation Interferometry
Foliage and Ground Penetration
Reconnaissance, Surveillance and Targeting Change Detection
Environmental Monitoring
3.2
Ultrasound Imaging
It is a medical imaging technique that uses high frequency sound waves and their echoes[10]. The technique is similar to the echolocation used by bats, whales and dolphins, as well as SONAR used by submarines. In ultrasound,the following events happen:
The ultrasound machine transmits high-frequency (1 to 5 megahertz) sound pulses into the human body using a probe.
The sound waves travel into the body and hit a boundary between tissues (e.g. between fluid and soft tissue, soft tissue and bone). Echoes are produced at any tissue interface where a change in acoustical impedance occurs[11]. The intensity of the returning echo, that is the energy returned to the transducer, is determined by the magnitude of the change in the acoustical impedance at the echoing interface, the characteristics of the intervening tissue, and the normality (perpendicularity) of the interface to the transducer.
Hence some of the sound waves get reflected back to the probe, while some travel on further until they reach another boundary and get reflected.
The reflected waves are picked up by the probe and relayed to the machine.
© 2016, IRJET ISO 9001:2008 Certified Journal
Page 576
sound in tissue (1,540 m/s) and the time of the eachecho’s return (usually on the order of millionths of a second).
The machine displays the distances and intensities of the echoes on the screen, forming a two dimensional image.
Ultrasound imaging being inexpensive, nonradioactive, real-time and noninvasive, is most widely used in medical field. To achieve the best possible diagnosis it is important that medical images be sharp, clear and free of noise and artifacts[12]. However occurrence of speckle is a problem with ultrasound imaging. Speckle is the artifact caused by interference of energy from randomly distributed scattering [13]. Denoising of ultrasound images however still remains a challenge because noise removal causes blurring of the ultrasound images[14]. Sometimes physicians prefer to use original noisy images rather than filtered ones because of loss of important features while denoising. Ultrasound is more faster, cheaper and safer than X-rays or other radiographic techniques[15].
Figure-3 Ultrasound Imaging
Here some applications of ultrasound in medical imaging system is describe below:
Cardiology
Urology
Obstetrics and Gynecology
In addition to these areas, there is a growing use for ultrasound as a rapid imaging tool for diagnosis in emergency rooms.
4.
IMAGE DENOISING METHODS
Filter has very important role in image de-noising process. Using filter technique, in order to decide particular value of pixel in output image the neighbor pixels also participate. The values in filter are known as coefficient rather than pixels. The filter which we use for denoising is also called as mask. There are two basic approaches to
image de-noising, spatial domain filtering methods and transform domain filtering methods [16].
4.1 Wiener Filter
The wiener filter is a spatial domain filter and it generally used for suppression of additive noise. Wiener filters are a class of optimum linear filters which involve linear estimation of a desired signal sequence from another related sequence. The wiener filter’s main purpose is to reduce the amount of noise present in a image by comparison with an estimation of the desired noiseless image [17]. Wiener filter can be applied in two ways (a) spatial domain by using mean squared method (b) fourier transform method. Wiener filter in fourier domain can be used for deblurring and denoising whereas in spatial domain wiener filter cannot be used for deblurring. Wiener filter is based on the least-squared principle, i.e. the this filter minimizes the mean-squared error (MSE) between the actual output and the desired output. Image statistics usually vary from one region to another region even within the same image[18]. Thus, both global statistics (mean, variance, etc. of the whole image) and local statistics (mean, variance, etc. of a small region or sub-image) are important. Wiener filtering is based on both the global statistics and local statistics and is given as
( ( , ) )
2 n 2 f
2 f )
, (
ˆ x y g g x y g
F
And
M
m s
N
n t g s t L
g 1 ( , )
Where
F
ˆ
(
x
,
y
)
denotes restored image, σf2 is the localvariance and σn2 is the noise variance [17]. In statistical
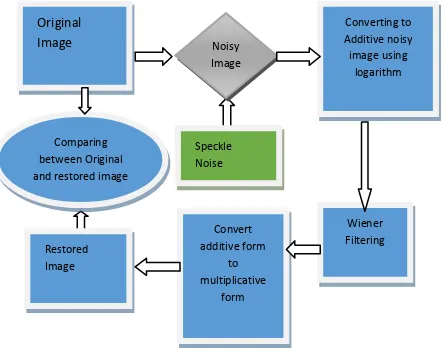
theory, Wiener filtering is a great land mark. Thus, it is accepted as a benchmark in 1-D and 2-D signal processing. The image denoising using wiener filter is shown in following flowchart.
Original Image
Wiener Filtering Restored
Image
Converting to Additive noisy image using
logarithm Noisy
Image
Speckle Noise
Convert additive form
to multiplicative
form Comparing
© 2016, IRJET ISO 9001:2008 Certified Journal
Page 577
Figure 4 denoising algorithm using wiener filtering4.2
Curvelet Transform
Curvelet transform was introduced by E. J. Candes [19]. On theoretical basis they are introduced two methods for transformation as given below:
Unequispaced FFT transform
Wrapping Transform
Those are differ by spatial grid used for translate Curvelets at each scale and angle. However, wrapping algorithm provide faster computational technique or take less time than USFFT. The idea of the Curvelet transform is first to decompose the image into Subband. The discrete Curvelet transform is mathematically expressed as:
]
2
,
1
[
]
2
,
1
[
)
,
,
(
,,2 , 1 0 D
t
t
t
t
f
k
l
j
Dk l j n
t t
C
The advantage of using curvelet are,
Curvelet approximate line singularity better than other transformation.
It is an optimal representation with edges.
[image:4.595.37.260.447.627.2]The main drawback of the Curvelet transform is redundancy factor[20]. It is redundant with a factor equal to J+1 for J scales.
Figure 5 denoising algorithm using curvelet filtering
4.3
Image Thresholding
Thresholding is one of the most effective technique for image segmentation. It is a non-linear operation that converts a binary image from a gray-scale image Where the two levels are assigned for pixels that are below or
above the specified threshold value. In many applications, it is useful to separate out the regions of the image corresponding to objects and background in which we want to analyze[20]. Thresholding often provides an easy and convenient way to perform this segmentation on the basis of the different intensities or colors in the foreground and background regions of an image.
Different types of thresholding are used for denoising image. Threshold can be chosen by manually and automatically. It can be categorized into two groups, global and local threshold. Global thresholding technique, thresholds the complete image with a single threshold value and in local thresholding technique, segment the image into a number of sub-image and use a different threshold value for each sub-image[21]. Global thresholding methods are easy to implement and faster because it take less computational time. Basic thresholding methods which is use for image segmentation these are:
Hard Thresholding
Soft Thresholding Adaptive Thresholding
Automatical calculation of threshold value using an iterative method
Approximate the histogram of the image and choose a midpoint value of histogram as the threshold value.
5.
PERFORMANCE ASSESMENT
The quality of an image can be examined objectively evaluation as well as subjectively. For subjective evaluation, the image has to be observed by a human expert[23]. But The human visual system cannot do pixel by pixel evaluation of given image, So exact quality of image is difficult to determine. There are various metrics used for objective evaluation of an image [24].
Mean square error
Root mean square error
Mean absolute error
Peak signal to noise ratio
Let the original noise-free image F(m,n) , noisy image G(m,n), and the filtered image F’(m,n) be represented where m and n represent the discrete spatial coordinates of the digital images. Let the image size be M x N i.e m= 1,2,3………M and n= 1,2,3……..N
5.1
MEAN SQUARE ERROR:
For a given image F(m,n), the mean square error of the image is given as
Original Image
Wiener Filtering Restored
Image
Converting to Additive noisy image using
logarithm Noisy
Image
Speckle Noise
Convert additive form
to multiplicative
form Comparing
© 2016, IRJET ISO 9001:2008 Certified Journal
Page 578
M
m N
n F m n F m n MSE
1 1
2 )) , ( ) , ( ~ (
5.2
ROOT MEAN SQUARE:
For a given image F(m,n), the mean square error of the image is given as
MSE RMSE
5.3
MEAN ABSOLUTE ERROR:
For a given image F(m,n), the mean square error of the image is given as
M
m N
n F m n F m n MAE
1 1 ( , ) ( , )
~
5.4
PEAK SIGNAL TO NOISE RATIO:
Peak signal to noise ratio (PSNR) is another important image metric. It is defined in logarithmic scale. It is a ratio of peak signal power to noise power [23]. Since the MSE represents the noise power and the peak signal power, the PSNR is defined as:
) 1 ( 10 log * 10
MSE PSNR
There are some other metrics like, universal quality index (UQI) can be used to evaluate the quality of an image now-a-days. Further, some parameters, e.g. method noise and execution time are also used in literature to evaluate the filtering performance of a filter.
6
CONCLUSION:
The multiplicative noise can be found in several images like SAR, Ultrasound image. The paper aims at discussing some denoising method under multiplicative noise. A Curvelet domain based approach alond with different thresholding technique and wiener filtering techniques has been discussed. The thresholding on Curvelet coefficient is determine by an hard and entropy based thresholding method discussed. The approaches which have been discussed can applied to several standard images and performance can be evaluated using statistical indices like SSIM, MSE, RMS, PSNR.
REFERENCES:
1. Y. Wang and H. Zhou, “Total variation wavelet-based medical image de-noising” School of Mathematics, Georgia Institute of Technology, Atlanta, GA 30332-0430, USA, 2006.
2.
S. Kumar, P. Kumar, M. Gupta, and A. Nagawat, “Performance comparison of median and wiener filterin image de-noising,” International Journal of Computer Applications (0975{8887) Volume, 2010. 3. S.Preeti and D.Narmadha,”A Survey On Image
Denoising Techniques” international journal of computer applications, Volume58-No.6, November 2012
4. Palwinder singh, leena jain, “Noise reduction in ultrasound images using wavelet and spatial filtering techniques”, IEEE conference IMKE-2013, Pg. 57. 5. L.Gagnon., A. Jouan, “Speckle filtering of SAR images:
A comparative study between complex-wavelet based and standard filters”, In SPIE Proc., 3169, 1997, pp. 80–91.
6. S.Kumar, P.Kumar, M.Gupta, A.K Nagawat,”
performance comparison of Median and Wiener filter in image Denoising”, International Journal of Computer Applications, Volume 12-No.4, Nov 2010. 7. G. Subrahmanyam, A. Rajagopalan, and R. Aravind, “A
recursive filter for despeckling sar images,” Image Processing, IEEE Transactions on, vol. 17, no. 10, pp. 1969–1974, 2008.
8. J. Bruniquel and A. Lopes, “Multi-variate optimal speckle reduction in sar imagery,” International journal of remote sensing, vol. 18, no. 3, pp. 603–627, 1997.
9.
J.-S. Lee, L. Jurkevich, P. Dewaele, P. Wambacq, and A. Oosterlinck, “Speckle filtering of synthetic aperture radar images: A review,” Remote Sensing Reviews, vol. 8, no. 4, pp. 313–340, 1994.10. A.K. Jain, Fundamentals of Digital Image Processing., Englewood Cliffs, NJ: Prentice Hall; 1989 “audio steg:
methods”, Internet publication on
www.snotmonkey.com”http://www.snotmonkey.com /work/school/405/methods.html”.
11. K. Thangavel, R. Manavalan, and I. L. Aroquiaraj, “Removal of speckle noise from ultrasound medical image based on special filters: comparative study,” ICGST-GVIP Journal, vol. 9, no. 3, pp. 25–32, 2009. 12. K. Z. Abd-Elmoniem, Y. M. Kadah, and A. Youssef, “Real
time adaptive ultrasound speckle reduction and coherence enhancement,” in Image Processing, 2000. Proceedings. 2000 International Conference on, vol. 1. IEEE, 2000, pp. 172–175.
13. I. LJB Development, “Speckle Reduction in Ultrasound Imaging,” http :// www.ljbdev.com/speckle. html.
14.
K. Z. Abd-Elmoniem, A. Youssef, and Y. M. Kadah,“Real-time speckle reduction and coherence enhancement in ultrasound imaging via nonlinear anisotropic diffusion,” Biomedical Engineering, IEEE Transactions on, vol. 49, no. 9, pp. 997–1014, 2002. 15. Leena Jain, Palwinder Singh,”A historical and
qualitative analysis of different medical imaging techniques”, International Journal of Computer Applications, Vol-107-No 15, December 2014.
© 2016, IRJET ISO 9001:2008 Certified Journal
Page 579
University of Nevada, Reno Dept of Comp. Sci. & Engr.,Reno, NV 89557 USA (775) 784-6571.
17. S.Kumar, P.Kumar, M.Gupta, A.K Nagawat,”
performance comparison of Median and Wiener filter in image Denoising”, International Journal of Computer Applications, Volume 12-No.4, Nov 2010. 18. B.Nilamani , “Development of Some Novel
Spatial-Domain and Transform- Spatial-Domain Digital Image Filters” , Doctoral Dissertation, National Institute of Technology, Rourkela, India.
19. E. Candes, L. Demanet, D. Donoho, and L. Ying, “Fast discrete curvelet transforms,” Multiscale Modeling & Simulation, vol. 5, no. 3, pp. 861–899, 2006.
20. J. Starck, E. Cand`es, and D. Donoho, “The curvelet transform for image denoising,” IEEE Transactions on Image Processing, vol. 11, no. 6, pp. 670–684, 2002. 21. J. Kapur, P. K. Sahoo, and A. Wong, “A new method for
gray-level picture thresholding using the entropy of the histogram,” Computer vision, graphics, and image processing, vol. 29, no. 3, pp. 273–285, 1985.
22.
A. Brink, “Thresholding of digital images using two-dimensional entropies,” Pattern recognition, vol. 25, no. 8, pp. 803–808, 1992.23. A.K. Jain, Fundamentals of Digital Image Processing., Englewood Cliffs, NJ: Prentice Hall; 1989.