The natural history of insulin secretory
dysfunction and insulin resistance in the
pathogenesis of type 2 diabetes mellitus
Christian Weyer, … , David M. Mott, Richard E. Pratley
J Clin Invest.
1999;
104(6)
:787-794.
https://doi.org/10.1172/JCI7231
.
The pathogenesis of type 2 diabetes involves abnormalities in insulin action, insulin
secretion, and endogenous glucose output (EGO). However, the sequence with which these
abnormalities develop and their relative contributions to the deterioration in glucose
tolerance remain unclear in the absence of a detailed longitudinal study. We measured
insulin action, insulin secretion, and EGO longitudinally in 17 Pima Indians, in whom
glucose tolerance deteriorated from normal (NGT) to impaired (IGT) to diabetic over 5.1 ±
1.4 years. Transition from NGT to IGT was associated with an increase in body weight, a
decline in insulin-stimulated glucose disposal, and a decline in the acute insulin secretory
response (AIR) to intravenous glucose, but no change in EGO. Progression from IGT to
diabetes was accompanied by a further increase in body weight, further decreases in
insulin-stimulated glucose disposal and AIR, and an increase in basal EGO. Thirty-one
subjects who retained NGT over a similar period also gained weight, but their AIR
increased with decreasing insulin-stimulated glucose disposal. Thus, defects in insulin
secretion and insulin action occur early in the pathogenesis of diabetes. Intervention to
prevent diabetes should target both abnormalities.
Article
Introduction
Type 2 diabetes mellitus is characterized by 4 major metabolic abnormalities: obesity, impaired insulin action, insulin secretory dysfunction, and increased endogenous glucose output (EGO) (1–3). Although there is substantial evidence that the first 3 of these abnormalities are present in most individuals before the onset of diabetes, the sequence with which they develop and their relative contributions to the progression from normal glucose tolerance (NGT) to impaired glucose tol-erance (IGT), and ultimately to type 2 diabetes (4–6), remain unknown in the absence of a detailed longitudi-nal study (7–12). Current understanding of the patho-genesis of type 2 diabetes is based on a large number of cross-sectional (13–25) and prospective (26–40) studies. In cross-sectional studies, subjects with IGT were on average more obese and more insulin-resistant than those with NGT. Basal EGO, largely reflecting hepatic glucose production, was not increased (3, 7, 8, 13–15). Whether insulin secretion is impaired in individuals with IGT is controversial. Some studies have found a lower early insulin secretory response (occurring within minutes of an intravenous or oral glucose load) in indi-viduals with IGT compared with those with NGT (16–19). Lower early insulin responses have also been demonstrated in first-degree relatives of individuals with type 2 diabetes, a population at high risk for devel-oping diabetes (20–22). However, others have reported normal or increased early insulin secretion in both groups of individuals (13, 14, 23, 24). Similarly, both
lower (18) and higher (25) late insulin responses (2 hours after an oral glucose load) have been reported in subjects with IGT compared with those with NGT. With respect to the pathogenesis of diabetes, such cross-sec-tional findings must be interpreted with caution, because many individuals with IGT will never develop diabetes, and their metabolic characteristics may well differ from those who do.
In recent years, several prospective studies, in which nondiabetic individuals are metabolically characterized on a single occasion and then followed for several years to determine who develops diabetes, have helped to iden-tify metabolic abnormalities that predispose to diabetes. These studies have shown that obesity (27–29, 33–35, 39) and insulin resistance (30–35) predict the development of diabetes in many populations, whereas basal EGO was not predictive in the only study in which it was measured (30). A low early insulin response predicted diabetes in most (30, 35–39) but not all (31, 32) studies. Together, these results indicate that defects in both insulin action and insulin secretion predispose some individuals with NGT to diabetes, but they give little information about the time course with which these abnormalities change as glucose tolerance worsens.
To determine the natural history of insulin secretory dys-function and insulin resistance during the development of diabetes, and to understand how these factors interact with one another during the development of the disease, longi-tudinal studies are necessary in which insulin secretion and insulin action are repeatedly measured in subjects as they
The natural history of insulin secretory dysfunction
and insulin resistance in the pathogenesis
of type 2 diabetes mellitus
Christian Weyer, Clifton Bogardus, David M. Mott, and Richard E. Pratley
Clinical Diabetes and Nutrition Section, National Institute of Diabetes and Digestive and Kidney Diseases, National Institutes of Health, Phoenix, Arizona 85016, USA
Address correspondence to: Christian Weyer, Clinical Diabetes and Nutrition Section, National Institutes of Health, 4212 N. 16th Street, Room 5-41, Phoenix, Arizona 85016, USA. Phone: (602) 200-5330; Fax: (602) 200-5335; E-mail: cweyer@phx.niddk.nih.gov.
Received for publication May 3, 1999, and accepted in revised form August 10, 1999.
The pathogenesis of type 2 diabetes involves abnormalities in insulin action, insulin secretion, and endogenous glucose output (EGO). However, the sequence with which these abnormalities develop and their relative contributions to the deterioration in glucose tolerance remain unclear in the absence of a detailed longitudinal study. We measured insulin action, insulin secretion, and EGO longitudinally in 17 Pima Indians, in whom glucose tolerance deteriorated from normal (NGT) to impaired (IGT) to dia-betic over 5.1 ± 1.4 years. Transition from NGT to IGT was associated with an increase in body weight, a decline in insulin-stimulated glucose disposal, and a decline in the acute insulin secretory response (AIR) to intravenous glucose, but no change in EGO. Progression from IGT to diabetes was accompa-nied by a further increase in body weight, further decreases in insulin-stimulated glucose disposal and AIR, and an increase in basal EGO. Thirty-one subjects who retained NGT over a similar period also gained weight, but their AIR increased with decreasing insulin-stimulated glucose disposal. Thus, defects in insulin secretion and insulin action occur early in the pathogenesis of diabetes. Intervention to prevent diabetes should target both abnormalities.
progress from NGT to IGT to diabetes (2, 12, 40, 41). Such studies are only feasible in populations with a high inci-dence of diabetes where subjects can be followed closely over several years (30, 33, 42). In 1982, a detailed longitu-dinal study was initiated among the Pima Indians of Ari-zona, a population with the highest documented preva-lence of type 2 diabetes in the world (28).
Methods
Subjects. By 1998, 404 individuals with NGT from the Gila River Indian Community had been enrolled in the study. The study protocol was approved by the Institutional Review Board of the National Institutes of Health and by the Tribal Council of the Gila River Indian Community. After giving written informed consent, participants under-went a thorough medical evaluation, including a medical history, physical examination, and routine blood and lab-oratory tests. Subjects were then admitted for 8–15 days to the Clinical Research Unit of the National Institute of Diabetes and Digestive and Kidney Diseases in Phoenix, Arizona. After at least 3 days on a weight-maintaining diet (43), a series of tests were conducted to assess body com-position, body-fat distribution, glucose tolerance, insulin action, insulin secretion, and EGO. Subsequently, subjects were invited back at approximately annual intervals and the entire series of tests was repeated. Of the 114 subjects who were evaluated on at least 3 occasions, 17 (12 females and 5 males; 26.4 ±6.4 years old, mean ±SD) were studied at least once at each stage during the progression from NGT to IGT to diabetes (progressors). Results in this group were compared with those in a group of 31 subjects (10 females and 21 males, 23.9 ± 4.4 years old) who retained NGT on at least 3 consecutive evaluations (non-progressors). In the progressors, the time intervals from NGT to IGT (∆1), from IGT to diabetes (∆2), and from NGT to diabetes (∆3) were 1.8 ±0.8 years, 3.3 ±1.4 years, and 5.1 ±1.4 years, respectively. These intervals were not significantly different from those between evaluations in the nonprogressors (∆1: 2.3 ±1.2 years, ∆2: 2.6 ±2.0 years,
∆3: 4.9 ±2.3 years). Progressors were studied an average of 5.4 times and nonprogressors an average of 4.4 times over the course of the study. None of the subjects took oral hypoglycemic agents, insulin, or other medications that are known to alter glucose or insulin metabolism.
Anthropometric measurements. Body density was esti-mated by underwater weighing with simultaneous
deter-mination of residual lung volume by helium dilution (44); percent body fat, fat mass, and fat-free mass were calculated as described (45). Waist and thigh circumfer-ences were measured at the umbilicus and the gluteal fold in the supine and standing positions, respectively; the waist-to-thigh ratio was calculated as an index of body-fat distribution (46).
Oral glucose-tolerance test. After an overnight fast, sub-jects underwent a 75-g oral glucose-tolerance test (5). Plasma samples were drawn at baseline and after 30 and 120 minutes for determination of plasma glucose and insulin concentrations. Glucose tolerance was clas-sified according to the 1985 World Health Organiza-tion criteria (5).
Two-step hyperinsulinemic, euglycemic glucose clamp. Insulin action was assessed at physiologic and supra-physiologic insulin concentrations during a 2-step hyperinsulinemic, euglycemic glucose clamp, as described (30, 47). In brief, after an overnight fast, a primed, continuous intravenous insulin infusion was administered for 100 minutes at a rate of 40 mU/m2
body surface area per minute (low dose), followed by a second 100-minute infusion at a rate of 400 mU/m2
body surface area per minute (high dose). These infu-sions achieved steady-state plasma insulin concentra-tions of 840 ±252 pmol/L and 13,332 ±3,582 pmol/L (mean ± SD), respectively. Insulin concentrations achieved during the clamp did not differ between groups or over time. Plasma glucose concentrations were maintained at approximately 5.5 mmol/L with a variable infusion of a 20% glucose solution. As described previously (30, 47), the rate of total insulin-stimulated glucose disposal (M) was calculated for the last 40 min-utes of the low-dose and high-dose insulin infusions, and corrected for EGO (assumed to be 0 during the high dose). Rates of insulin-stimulated oxidative and nonox-idative glucose disposal were determined by indirect calorimetry using a ventilated hood system (48). EGO was determined at baseline and during the low-dose insulin infusion using a primed (30 µCi), continuous (0.3 µCi/min) 3-3H-glucose infusion (30, 47).
[image:3.612.59.541.622.711.2]Suppres-sion of EGO at the end of the low-dose insulin infuSuppres-sion was calculated as percentage of change from baseline. All measurements derived from the glucose clamp were normalized to estimated metabolic body size (EMBS, or fat-free mass + 17.7 kg) (49).
Table 1
Anthropometric changes (mean ± SD) during the development of type 2 diabetes in 17 Pima Indian subjects during the progression from NGT to IGT and then to type 2 diabetes (DIA) (progressors), compared with 31 Pima Indian subjects who retained NGT over a comparable time period (non-progressors)
Progressors (n = 17) Nonprogressors (n = 31)
NGT IGT DIA Time effect NGT NGT NGT Time effect Time ×
group effect
Body weight (kg) 93.7 ± 17.0 99.3 ± 17.9*** 106.9 ± 20.4*** < 0.0001 87.9 ± 25.6 90.5 ± 24.8*** 94.1 ± 27.7*** < 0.001 < 0.01 Body fat (%) 38 ± 6 39 ± 6 41 ± 6* < 0.01 29 ± 12 30 ± 10 31 ± 10* < 0.02 0.91 Fat mass (kg) 36.3 ± 9.8 38.6 ± 10.0* 43.6 ± 11.1*** < 0.0001 27.7 ± 16.8 28.5 ± 15.3 31.2 ± 17.1* < 0.005 < 0.05 Fat-free mass (kg) 57.4 ± 10.9 60.7 ± 11.4*** 63.3 ± 12.9* < 0.0001 60.2 ± 12.4 62.0 ± 13.0* 62.9 ± 13.1 < 0.001 < 0.05 Waist-to-thigh ratio 1.67 ± 0.16 1.73 ± 0.15* 1.76 ± 0.17 < 0.01 1.56 ± 0.16 1.61 ± 0.13** 1.63 ± 0.17 < 0.01 0.72
Intravenous glucose-tolerance test. Insulin secretion was measured in response to a 25-g intravenous glucose bolus (50) in 11 of the 17 progressors and 23 of the 31 nonprogressors. The acute insulin secretory response (AIR) to intravenous glucose was calculated as the aver-age incremental plasma insulin concentration from the third to the fifth minute after the glucose bolus (50). The product of AIR and (M-low) was calculated as an inte-grated measure of insulin secretion and insulin action, and is referred to as the disposition index, as suggested by Bergman (51, 52).
Analytic procedures. Plasma glucose concentrations were determined by the glucose oxidase method (Beckman Instruments Inc., Fullerton, California, USA). Plasma insulin concentrations were measured by radioim-munoassay, using either the Herbert modification (53) of the method of Yalow and Berson (54), or an automated analyzer (Concept 4; ICN Radiochemicals Inc., Costa Mesa, California, USA).
Statistical analyses. Statistical analyses were performed using the procedures of the SAS Institute Inc. (Cary, North Carolina, USA; ref. 55). In the progressors, the fol-lowing conventions were used. If subjects had several con-secutive studies while having NGT, IGT, or diabetes, the results of the respective visits were averaged. If subjects temporarily improved from IGT to NGT (5 subjects) or from diabetes to IGT (6 subjects), the results of these vis-its were excluded from the analysis, because the metabol-ic characteristmetabol-ics after the temporary deterioration of glu-cose tolerance. In the group of nonprogressors, results from all subjects with more than 3 visits were averaged in a manner that aimed to best match the time intervals over which the progressors were studied. Within-group comparisons — changes during transition from NGT to IGT (∆1), from IGT to diabetes (∆2), and from NGT to diabetes (∆3) — were performed by paired ttests. The overall time effect was examined by repeated-measures ANOVA. Between-group comparisons were made by unpaired ttests (to test whether changes between the 3 stages differed between the 2 groups) and by repeated-measures ANOVA (overall time ×group effect). All group comparisons were adjusted for age and sex. The
statisti-cal results were similar irrespective of whether or not they were adjusted for sex. Results are given as mean ±SD in the text and tables, and as mean ±SEM in Figure 1.
Results
Anthropometry. Body weight increased in both groups during the study, but the increase was 2-fold greater in the progressors (+14%) than in the nonprogressors (+7%; Table 1). Both fat mass and fat-free mass increased sig-nificantly more in the progressors than in the nonpro-gressors. Percent body fat and waist-to-thigh ratio also increased in both groups, but these changes were similar in the progressors and nonprogressors (Table 1).
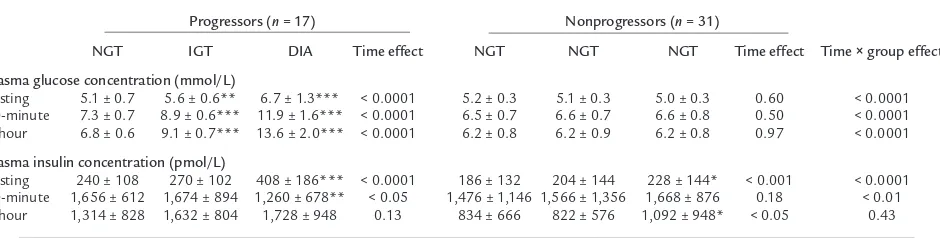
Oral glucose tolerance. By design, plasma glucose con-centrations increased steadily in the progressors and not in the nonprogressors (Table 2). The mean fasting plas-ma insulin concentration increased in both groups over time, but the increase was greater in the progressors (+70%), in whom the greatest change occurred during the transition from IGT to diabetes (Table 2). The mean 30-minute insulin concentration decreased in the pro-gressors (–24%), also primarily during the transition from IGT to diabetes, whereas the mean 2-hour insulin concentration did not change significantly (+32%; Table 2). In the nonprogressors, there was no change in the 30-minute insulin concentration, but the 2-hour insulin concentration increased by 31% (Table 2).
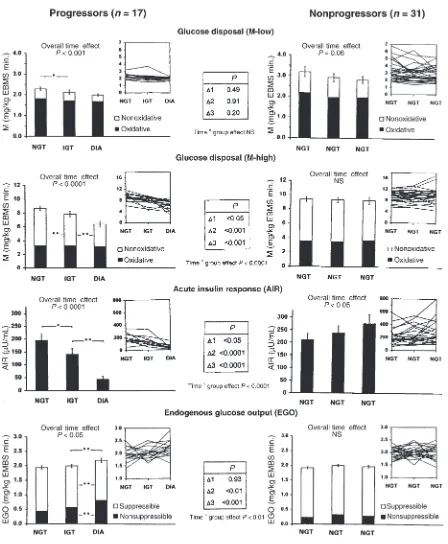
Insulin-stimulated glucose disposal. On average, M-low decreased in both groups over time (Figures 1 and 2). The overall decline in M-low in the progressors (–14%) was not different from that in the nonprogressors (–11%). Maximally insulin-stimulated glucose disposal (M-high) decreased by 31% overall in the progressors (P
[image:4.612.65.535.94.213.2]< 0.001) and remained unchanged in the nonprogressors (P < 0.0001 for time × group effect; Figure 1). The decrease in M-high in the progressors occurred in simi-lar proportions during the transition from NGT to IGT (–12%, P < 0.01) and from IGT to diabetes (–19%, P < 0.01; Figure 1). The declines in M-low and M-high were accounted for almost entirely by decreases in nonoxida-tive glucose disposal; oxidanonoxida-tive glucose disposal remained unchanged (Figure 1).
Table 2
Changes in plasma glucose and insulin concentrations (mean ± SD) in response to a 75-g oral glucose-tolerance test in 17 Pima Indian subjects dur-ing the progression from NGT to IGT to type 2 diabetes (progressors), compared with 31 Pima Indian subjects who retained NGT over a compara-ble time period (nonprogressors).
Progressors (n = 17) Nonprogressors (n = 31)
NGT IGT DIA Time effect NGT NGT NGT Time effect Time ×group effect
Plasma glucose concentration (mmol/L)
Fasting 5.1 ± 0.7 5.6 ± 0.6** 6.7 ± 1.3*** < 0.0001 5.2 ± 0.3 5.1 ± 0.3 5.0 ± 0.3 0.60 < 0.0001 30-minute 7.3 ± 0.7 8.9 ± 0.6*** 11.9 ± 1.6*** < 0.0001 6.5 ± 0.7 6.6 ± 0.7 6.6 ± 0.8 0.50 < 0.0001 2-hour 6.8 ± 0.6 9.1 ± 0.7*** 13.6 ± 2.0*** < 0.0001 6.2 ± 0.8 6.2 ± 0.9 6.2 ± 0.8 0.97 < 0.0001
Plasma insulin concentration (pmol/L)
Fasting 240 ± 108 270 ± 102 408 ± 186*** < 0.0001 186 ± 132 204 ± 144 228 ± 144* < 0.001 < 0.0001 30-minute 1,656 ± 612 1,674 ± 894 1,260 ± 678** < 0.05 1,476 ± 1,146 1,566 ± 1,356 1,668 ± 876 0.18 < 0.01 2-hour 1,314 ± 828 1,632 ± 804 1,728 ± 948 0.13 834 ± 666 822 ± 576 1,092 ± 948* < 0.05 0.43
Figure 1
AIR. In the progressors, AIR decreased by 27% during the transition from NGT to IGT (P < 0.05), and by a fur-ther 51% (for a total decrease of 78%) during progres-sion from IGT to diabetes (P < 0.01) (Figures 1 and 2). In the nonprogressors, AIR did not change during pro-gression from NGT to IGT, but increased by 30% over-all (P < 0.05 for time effect). The change in AIR differed significantly between the 2 groups (P < 0.0001 for time
×group effect; Figure 1).
Disposition index. In the progressors, the disposition index [measured as (µU × mg)/(mL × kg EMBS × minute)] decreased by 31.5%, from 417 ±168 to 286 ±163 during the transition from NGT to IGT (P < 0.05). Dur-ing progression from IGT to diabetes, the disposition index decreased by an additional 47.5%, to 88 ±78 (P < 0.01), for a total decrease of 79% (P < 0.0001 for overall time effect). In the nonprogressors, the disposition index did not change over time (691 ±463, 632 ±379, 788 ± 520, respectively; P = NS). Consequently, the changes in the disposition index differed significantly between the 2 groups (P < 0.0001 for time ×group effect).
EGO.Basal EGO did not change during the transition from NGT to IGT in the progressors, but increased by 15% during the transition from IGT to diabetes (Figure 1). In parallel, EGO became less suppressible by insulin (from 75% to 62%, P < 0.01; Figure 1). No changes in basal EGO or its suppression by insulin occurred in the non-progressors (P < 0.01 for time ×group effect; Figure 1). Discussion
The development of type 2 diabetes mellitus is character-ized by a progressive deterioration of glucose tolerance over several years (1–6). Cross-sectional and prospective data suggest that body-weight gain, defects in insulin secretion and insulin action, and an increase in EGO underlie this deterioration (13–40). The pathogenesis of diabetes — the temporal sequence with which these metabolic abnormalities develop relative to one another during the different stages of the disease — remains unknown, however. Several authors have proposed that a defect in insulin action is the predominant abnormal-ity in the early stages of the development of type 2 dia-betes, and that insulin secretory dysfunction occurs only at a later stage (3, 7–9, 14, 30–33). Others have suggest-ed that a defect in insulin secretion may be the major early abnormality (18–22, 35, 41, 49).
In this study, subjects were followed for several years, during which time body composition, insulin action, insulin secretion, and EGO were measured at each stage of the transition from NGT to IGT and diabetes. In con-trast with previous prospective studies, this longitudinal study allowed determination of the temporal sequence by which abnormalities in insulin action and insulin secretion progress during the development of the dis-ease, and of the relationships between these changes. The results indicate that both insulin secretion and insulin action significantly decrease early in the development of the disease — during the transition from NGT to IGT. These early deteriorations are distinct from and additive to even earlier putative defects in insulin action and insulin secretion that may be present in individuals while they are still NGT, which predispose them to develop
diabetes. With the progression from IGT to diabetes, the abnormalities in insulin secretion and insulin action worsen in parallel with an increase in EGO.
Longitudinal changes
Obesity. Development of type 2 diabetes was accompa-nied by a marked increase in body weight that was sig-nificantly higher than in the nonprogressors. The greater weight gain in the progressors was accounted for by larg-er increases in both fat mass and fat-free mass relative to the nonprogressors. In contrast, changes in percent body fat and waist-to-thigh ratio were not different between groups, suggesting that the absolute amount of weight gain, rather than specific changes in body composition or body fat distribution, is important in the develop-ment of type 2 diabetes.
Insulin action. The transition from NGT to diabetes was accompanied by a progressive deterioration of insulin action, as indicated by a 31% decrease in M-high. This decrease was evident during the transition from NGT to IGT, indicating that insulin action declines at an early stage of the disease. The decreased glucose uptake was almost entirely due to a decrease in nonoxidative glucose disposal, suggesting that the impairment of insulin action during the development of diabetes is primarily caused by a defect in glucose storage. This agrees with our previous observations (56) and those of others (57, 58) that subjects with type 2 diabetes are resistant to the stimulating effect of insulin on skeletal muscle glycoge-nesis. The 14% decrease in glucose uptake at physiologi-cal insulin levels (M-low) in the progressors was smaller than the decrease in M-high (–31%) and did not differ from that observed in the nonprogressors. As illustrated in Figure 1, M-low was initially very low in the progres-sors, barely exceeding basal EGO. Further declines in M-low were therefore necessarily limited in this group. Under these circumstances, M-high may better reflect changes in insulin action.
30-minute insulin response to oral glucose decreased, although to a lesser extent (–24%).
EGO.EGO did not change during the transition from NGT to IGT, but increased by 15% with further pro-gression to diabetes (which was assessed at an early and relatively mild stage [mean fasting-glucose concentra-tion: 6.7 mmol/L]). At the same time, basal EGO became less suppressible by insulin, suggesting that the increased EGO was, at least in part, the result of decreased insulin sensitivity of the liver. These findings confirm the results of cross-sectional studies demon-strating elevated EGO in individuals with type 2 dia-betes, but not in those with IGT, and also explain why basal EGO is not predictive of developing diabetes (30). Thus, an increase in EGO represents a relatively late event in the pathogenesis of type 2 diabetes.
Relation between changes in insulin secretion and insulin action
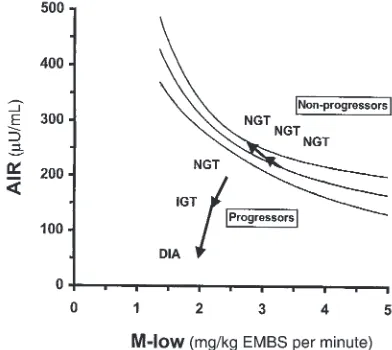
In addition to assessing the temporal sequence of changes in insulin secretion and action, the simultane-ous and repeated measurement of both variables in this study also allowed us to elucidate their interaction dur-ing the progression to diabetes. It is well known that there is a hyperbolic relationship between early insulin secretion and insulin action in individuals with NGT, meaning that, cross-sectionally, insulin secretion increases with decreasing insulin action and vice versa (51, 52). Figure 2 depicts this hyperbolic relationship between AIR and M-low in 277 Pima Indians with NGT. To illustrate how abnormalities in insulin secre-tion and insulin acsecre-tion develop relative to each other during the development of diabetes, we superimposed the longitudinal changes in AIR and M-low in the pro-gressors and nonpropro-gressors on this graph. In the non-progressors, AIR increased with decreasing M-low; as a
result, these individuals remained well within the nor-mal range. In the progressors, AIR, in absolute terms, was comparable to AIR in the nonprogressors at base-line. Relative to their degree of insulin resistance, how-ever, AIR was already too low in the progressors, who thus fell well below the 95% confidence interval while still having NGT. This finding is consistent with our previous prospective study in Pima Indians, which demonstrated in a larger number of subjects that both low insulin action and a low relative AIR are predictive of diabetes. The new information provided by this lon-gitudinal study is that in addition to those primary defects, both insulin action and insulin secretion dete-riorate further early in the development of the disease (i.e., during transition from NGT to IGT). Both of these early secondary defects contributed to the progressors’ move away from the normal range (95% confidence interval) (Figure 2). Thus, the inability of insulin secre-tion to compensate for a decrease in insulin acsecre-tion dis-tinguishes individuals who develop diabetes from those who retain NGT. This is also reflected in the change in the disposition index, an integrated measure of insulin secretion and insulin action (51, 52). Although in the nonprogressors, the disposition index remained unchanged owing to the compensatory increase in AIR with decreasing M-low, it progressively decreased in the progressors as individuals made the transition from NGT to IGT to diabetes.
Our study suggests, but cannot ultimately prove, that an early defect in AIR contributes to the development of diabetes. However, other evidence provides strong support for the physiological importance of early insulin secretion in maintaining NGT (60–62). For example, inhibition of the AIR by somatostatin in nor-mal volunteers caused a marked increase in the glycemic excursion that is associated with late hyperin-sulinemia during an oral glucose-tolerance test (60). Blunted AIR also impairs the suppression of EGO by insulin (61). Thus, key metabolic characteristics of early type 2 diabetes can be reproduced by a loss of early insulin secretion. Conversely, experimental augmenta-tion of early insulin secreaugmenta-tion by intravenous insulin infusion markedly improved the postprandial glycemic response to a mixed meal in patients with type 2 dia-betes (62). These results, together with prospective findings that a relatively low AIR predicts diabetes, strongly suggest that an early decrease in AIR (as observed in this study) plays an important role in decreasing glucose tolerance. Therapeutic approaches that aim to reestablish a normal insulin secretion pat-tern may therefore prove effective in improving glucose tolerance, and even in preventing diabetes.
[image:7.612.78.274.469.644.2]The mechanisms underlying the progressive defects in insulin action and early insulin secretion are unknown. Prolonged hyperglycemia can cause a defect in insulin action (8) and insulin secretion (the glucose toxicity theory; refs. 1, 41, 63). However, this mecha-nism is unlikely to be the explanation for the observed decrease in AIR during the transition from NGT to IGT in the progressors, because individuals with only a tran-sient deterioration to IGT showed no decrease in AIR, despite a comparable glycemic deterioration. Elevated Figure 2
FFA concentrations have also been suggested to have a detrimental effect on insulin action and early insulin secretion (7, 64); lowering FFAs increased the AIR in first-degree relatives of individuals with type 2 diabetes (65). It has also been proposed that chronic hyper-secretion of insulin — manifested by fasting hyperinsu-linemia — leads to impaired insulin action and an exhaustion of pancreatic β cells (7, 8), possibly by decreasing the amount of insulin available for imme-diate release in response to an acute stimulus.
Significantly more women than men were represented in the group of progressors than in the group of non-progressors, which could have affected our findings. However, this is unlikely, because results were consistent whether or not they were adjusted for sex. Because the prevalence of diabetes is very similar in men and women in the Pima Indian population, we believe that the dif-ference in sex distribution in this study represents a sampling artifact rather than a biological phenomenon. Because the prevalence of diabetes in the Pima Indi-an population as a whole is so much higher thIndi-an among other populations, it could be argued that our findings might not apply to other ethnic groups. How-ever, most of the prospective findings obtained in the Pima Indians (obesity, insulin resistance, and hyperin-sulinemia as predictors of diabetes) have been replicat-ed in other populations. Diabetes in the Pima Indians may therefore be regarded as prototypic of the most common form of diabetes in most other ethnic groups. It is likely that our longitudinal findings here also apply to other populations with a lower prevalence of diabetes, in which longitudinal studies like this one may not be feasible.
In conclusion, ndividuals who later develop diabetes may manifest primary defects in insulin action and insulin secretion which predispose them to diabetes while they retain NGT. This longitudinal study makes it clear that, in addition to these primary defects, individ-uals who develop diabetes manifest progressive impair-ments in both insulin action and insulin secretion that directly contribute to worsening glucose tolerance. In addition, our results indicate that these progressive defects occur early during the development of diabetes — during the transition from NGT to IGT — and worsen as glucose tolerance further deteriorates toward diabetes. An increase in EGO is evident only during the transition from IGT to diabetes, and therefore represents a rela-tively late abnormality. The inability to compensate for either a defect in insulin action or a defect in insulin secretion distinguishes individuals who develop diabetes from those who are able to maintain NGT. These find-ings suggest that intervention to prevent diabetes in peo-ple who are at risk should begin at an early stage and should target both insulin resistance and insulin secre-tory dysfunction.
Acknowledgments
We would like to thank the members and leaders of the Gila River Indian Community, without whose continu-ing cooperation this longitudinal study would not have been possible. We are also indebted to Stephen Lillioja, Barbara Howard, and James Foley for their
contribu-tions to the study. We gratefully acknowledge Michael Milner, Carol Massengill, and the nurses of the Nation-al Institutes of HeNation-alth ClinicNation-al Research Unit; Arline Salbe and the kitchen staff for the care of the patients in this study; and the Clinical Diabetes and Nutrition Section technical staff for assisting in the analyses.
1. Weir, G.C., and Leahy, J.L. 1994. Pathogensis of non–insulin-dependent (type II) diabetes mellitus. In Joslin’s diabetes mellitus. 13th edition. C.R. Kahn and G.E. Weir, editors. Lea & Febiger. Philadelphia, PA. 240–264. 2. Bogardus, C. 1996. Metabolic abnormalities in the development of
non-insulin-dependent diabetes mellitus. In Diabetes mellitus. D. LeRoith, S.I. Taylor, and J.M. Olefski, editors. Lippincot-Raven Publishers. Philadel-phia, PA. 459 pp.
3. DeFronzo, R.A. 1988. Lilly Lecture 1987. The triumvirate: B-cell, muscle, liver. A collision responsible for NIDDM. Diabetes. 37:667–687. 4. National Diabetes Data Group. 1979. Classification and diagnosis of
diabetes mellitus and other categories of glucose intolerance. Diabetes. 28:1039–1057.
5. World Health Organization. 1985. Diabetes mellitus: report of a WHO study group. World Health Organization Technical Report Series, Vol-ume 17. 45 pp.
6. American Diabetes Association. 1998. Report of an expert committee on the diagnosis and classification of diabetes mellitus. Diabetes Care. 21(Suppl. 1):S5–S19.
7. Reaven, G.M. 1988. Role of insulin resistance in human disease. Diabetes. 37:1595–1607.
8. DeFronzo, R.A. 1997. Pathogenesis of type 2 diabetes: metabolic and molecular implications for identifying diabetes genes. Diabetes Reviews. 5:177–269.
9. DeFronzo, R.A., Bonadonna, R.C., and Ferrannini, E. 1992. The patho-genesis of NIDDM. A balanced overview. Diabetes Care.15:318–368. 10. Groop, L.C., Widen, E., and Ferrannini, E. 1993. Insulin resistance and
insulin deficiency in the pathogenesis of type 2 (non-insulin-dependent) diabetes mellitus: errors of metabolism or of methods? Diabetologia. 36:1326–1331.
11. Taylor, S.I., Accili, D., and Imai, Y. 1994. Insulin resistance or insulin defi-ciency. Which is the primary cause of NIDDM? Diabetes.43:735–740. 12. Ferrannini, E. 1998. Insulin resistance vs. insulin deficiency in non-insulin-dependent diabetes mellitus: problems and prospects. Endocr. Rev. 19:477–490.
13. Reaven, G.M., and Olefsky, J.M. 1977. Relationship between hetero-geneity of insulin responses and insulin resistance in normal subjects and patients with chemical diabetes. Diabetologia. 13:201–206. 14. Reaven, G.M., Hollenbeck, C.B., and Chen, Y.D.I. 1989. Relationship
between glucose tolerance, insulin secretion, and insulin action in non-obese individuals with varying degrees of glucose tolerance. Diabetologia. 32:52–55.
15. Bogardus, C., Lillioja, S., Howard, B.V., Reaven, G., and Mott, D.M. 1984. Relationships between insulin secretion, insulin action and fasting plas-ma glucose concentration in nondiabetic and noninsulin-dependent dia-betic subjects. J. Clin. Invest.74:1238–1246.
16. Cerasi, E., Luft, R., and Efendic, S. 1972. Decreased sensitivity of the pan-creatic beta cells to glucose in prediabetic and diabetic subjects. A glu-cose dose-response study. Diabetes. 21:224–234.
17. Eriksson, J., et al. 1989. Early metabolic defects in persons at increased risk for non-insulin dependent diabetes mellitus. N. Engl. J. Med. 321:337–343.
18. Pimenta, W., et al. 1996. Insulin secretion and insulin deficiency in peo-ple with impaired glucose tolerance. Diabet. Med.13:S33–S36. 19. Yoneda, H., et al. 1992. Analysis of early-phase insulin responses in
non-obese subjects with mild glucose intolerance. Diabetes Care. 15:1517–1521.
20. O’Rahilly, S.P., et al. 1986. Beta-cell dysfunction, rather than insulin insensitivity, is the primary defect in familial type 2 diabetes. Lancet. 2:360–364.
21. Kosaka, K., Kuzuya, T., Hagura, R., and Yoshinaga, H. 1996. Insulin response to oral glucose load is consistently decreased in established non-insulin dependent diabetes mellitus: the usefulness of decreased early insulin response as a predictor of diabetes mellitus. Diabet. Med. 13:S109–S119.
22. Pimenta, W., et al. 1995. Pancreeatic beta-cell dycfunction as the primary genetic lesion in NIDDM. Evidence from studies in normal glucose-tol-erant individuals with a first-degree NIDDM relative. JAMA. 273:1855–1861.
23. Perseghin, G., Ghosh, S., Gerow, K., and Shulman, G.I. 1997. Metabolic defects in lean nondiabetic offspring of NIDDM parents. A cross-sec-tional study. Diabetes.46:1001–1009.
offspring of two Mexican-American NIDDM parents. Diabetes. 41:1575–1586.
25. Zimmet, P., Whitehouse, S., Alford, F., and Chisholm, D. 1978. The rela-tionship of insulin response to a glucose stimulus over a wide range of glucose tolerance. Diabetologia.15:23–27.
26. Haffner, S.M., Miettinen, H., Gaskill, S.P., and Stern, M.P. 1996. Decreased insulin action and insulin secretion predict the development of impaired glucose tolerance. Diabetologia. 39:1201–1207.
27. Wilson, P.W., McGee, D.L., and Kannel, W.B. 1981. Obesity, very low den-sity lipoproteins, and glucose intolerance over 14 years. The Framing-ham study. Am. J. Epidemiol. 114:697–704.
28. Knowler, W.C., Pettitt, D.J., Saad, M.F., and Bennett, P.H. 1990. Diabetes mellitus in the Pima Indians: incidence, risk factors and pathogenesis.
Diabetes Metab. Rev. 6:1–27.
29. Ohlson, L.D., et al. 1985. The influence of body fat distribution on the incidence of diabetes mellitus. 13.5 years of follow-up of the participants in the study of men born in 1913. Diabetes.34:1055–1058.
30. Lillioja, S., et al. 1993. Insulin resistance and insulin secretory dysfunc-tion as precursors of non-insulin dependent diabetes mellitus. Prospec-tive studies of Pima Indians. N. Engl. J. Med.329:1988–1992.
31. Martin, B.C., et al. 1992. Role of glucose and insulin resistance in devel-opment of type 2 diabetes. Results of a 25-year follow-up study. Lancet. 340:925–929.
32. Warram, J.H., Martin, B.C., Krolewski, A.S., Soeldner, J.S., and Kahn, C.R. 1990. Slow glucose removal rate and hyperinsulinemia precede the devel-opment of type 2 diabetes in the offspring of diabetic parents. Ann. Intern. Med.113:909–915.
33. Saad, M.F., et al. 1991. A two-step model for development of non-insulin dependent diabetes mellitus. Am. J. Med.90:229–235.
34. Charles, M.A., et al. 1991. Risk factors for NIDDM in white population: Paris prospective study. Diabetes.40:796–799.
35. Chen, K.W., et al. 1995. Earlier appearance of impaired insulin secretion than of visceral adipocity in the pathogenesis of NIDDM. Diabetes Care. 18:747–753.
36. Nagi, D.K., et al. 1995. Early and late insulin response as predictors of NIDDM in Pima Indians with impaired glucose tolerance. Diabetologia. 38:187–192.
37. Warram, J.H., Sigal, R.J., Martin, B.C., Krolewski, A.S., and Soeldner, J.S. 1996. Natural history of impaired glucose tolerance: follow-up at Joslin Clinic. Diabet. Med.13:S40–S45.
38. Efendic, S., Luft, R., and Wajngot, A. 1984. Aspects of the pathogenesis of type 2 diabetes. Endocr. Rev.5:395–410.
39. Lundgren, H., Bengtsson, C., Blohme, G., Lapidus, L., and Walden-stroem, J. 1990. Fasting serum insulin concentration and early insulin response as risk determinants for developing diabetes. Diabet. Med. 7:407–413.
40. Kadowaki, T., et al. 1984. Risk factors for worsening to diabetes in sub-jects with impaired glucose tolerance. Diabetologia.26:44–49. 41. Leahy, J.L. 1990. Natural history of β-cell dysfunction in NIDDM.
Dia-betes Care.13:992–1010.
42. Lillioja, S., and Bogardus, C. 1988. Obesity and insulin resistance: les-sons learned from the Pima Indians. Diabetes Metab. Rev.4:517–540. 43. Abbott, W.G.H., Howard, B.V., Ruoloto, G., and Ravussin, E. 1990.
Ener-gy expenditure in humans: effects of dietary fat and carbohydrate. Am. J. Physiol.258:E347–E351.
44. Goldman, R.F., and Buskirk, E.R. 1961. A method for underwater weigh-ing and the determination of body density. In Techniques for measuring body composition . J. Brozek and A. Herschel, editors. National Research Council. Washington, DC. 78–106.
45. Siri, W.E. 1961. Body composition from fluid spaces and density:
analy-sis of methods. In Techniques for measuring body composition . J. Brozek and A. Herschel, editors. National Research Council. Washington, DC. 223–244.
46. Tataranni, P.A., Larson, D.E., and Ravussin, E. 1994. Body fat distribu-tion and energy metabolism in obese men and women. J. Am. Coll. Nutr. 13:569–574.
47. Bogardus, C., et al. 1984. Relationship between obesity and maximal stimulated glucose uptake in vivo and in vitro in Pima Indians. J. Clin. Invest. 78:1568–1578.
48. Bogardus, C., Lillioja, S., and Ravussin, E. 1986. Familial dependence of the resting metabolic rate. N. Engl. J. Med.315:96–100.
49. Gerich, J.E. 1998. The genetic basis of type 2 diabetes mellitus: impaired insulin secretion versus impaired insulin sensitivity. Endocr. Rev. 19:491–503.
50. Schwartz, M.W., Boyko, E.J., Kahn, S.E., Ravussin, E., and Bogardus, C. 1995. Reduced insulin secretion: an independent predictor of body weight gain. J. Clin. Endocrinol. Metab.80:1571–1576.
51. Bergman, R.N., Phillips, L.S., and Cobelli, C. 1981. Physiological evalua-tion of factors controlling glucose tolerance in man: measurement of insulin sensitivity and beta cell glucose sensitivity from the response to intravenous glucose. J. Clin. Invest.68:1456–1467.
52. Bergman, R.N. 1989. Toward physiological understanding of glucose tol-erance: minimal model approach. Diabetes.38:1512–1527.
53. Herbert, Y., Lau, K., Gottlieb, C.W., and Bleicher, S.J. 1965. Coated char-coal immunoassay of insulin. J. Clin. Endocrinol. Metab.25:1375–1384. 54. Yalow, R.S., and Berson, S.A. 1960. Immunoassay of endogenous plasma
insulin in man. J. Clin. Invest.39:1157–1167.
55. SAS Institute Inc. 1990. SAS/STAT user’s guide, version 6.4th edition. SAS Institute Inc. Cary, NC. 1–44.
56. Mott, D., Pratley, R.E., and Bogardus, C. 1998. Postabsorptive respirato-ry quotient and insulin-stimulated glucose storage rate in non-diabetic Pima Indians are related to glycogen synthase fractional activity in cul-tured myoblasts. J. Clin. Invest.101:2251–2256.
57. Kelley, D.E., Mokan, M., and Mandarino, L.J. 1992. Intracellular defects in glucose metabolism in obese patients with NIDDM. Diabetes. 41:698–706.
58. Shulman, G.I., et al. 1990. Quantitation of muscle glycogen synthesis in normal subjects and subjects with non-insulin dependent diabetes by 13 C nuclear magnetic resonance spectroscopy. N. Engl. J. Med. 322:223–228.
59. Lillioja, S., et al. 1988. Impaired glucose tolerance as a disorder of insulin action. Longitudinal and cross-sectional studies in Pima Indians. N. Engl. J. Med.318:1217–1225.
60. Calles-Escandon, J., and Robbins, D.C. 1987. Loss of early phase insulin release in humans impairs glucose tolerance and blunts thermic effect of glucose. Diabetes.36:1167–1172.
61. Luzi, L., and DeFronzo, R.A. 1989. Effect of loss of first-phase insulin secretion on hepatic glucose production and tissue glucose disposal in humans. Am. J. Physiol.257:E241–E246.
62. Bruce, D.G., Chisholm, D.J., Storlien, L.H., and Kraegen, E.W. 1988. Physiological importance of deficiency in early prandial insulin secre-tion in non-insulin-dependent diabetes. Diabetes.37:736–744. 63. Brunzell, J.D., et al. 1976. Relationships between fasting plasma glucose
levels and insulin secretion during intravenous glucose tolerance tests.
J. Clin. Endocrinol. Metab. 42:222–229.
64. Unger, R. 1995. Lipotoxicity in the pathogenesis of obesity-dependent NIDDM: genetic and clinical implications. Diabetes.44:863–870. 65. Paolisso, G., et al. 1998. Lowering fatty acids potentiates acute insulin