N A N O E X P R E S S
Open Access
Color-tunable up-conversion emission in Y
2
O
3
:Yb
3+
,
Er
3+
nanoparticles prepared by polymer complex
solution method
Vesna M Lojpur
1, Phillip S Ahrenkiel
2and Miroslav D Drami
ć
anin
1*Abstract
Powders of Y2O3co-doped with Yb 3+
and Er3+composed of well-crystallized nanoparticles (30 to 50 nm in diameter) with no adsorbed ligand species on their surface are prepared by polymer complex solution method. These powders exhibit up-conversion emission upon 978-nm excitation with a color that can be tuned from green to red by changing the Yb3+/Er3+concentration ratio. The mechanism underlying up-conversion color changes is presented along with material structural and optical properties.
Keywords:Luminescence, Up-conversion, Nanoparticles, Rare earth, Combustion
PACS:42.70.-a, 78.55.Hx, 78.60.-b
Background
Up-conversion materials have the ability to convert lower energy near-infrared radiations into higher energy visible radiations. These materials have gained considerable attention because of their use in a wide range of important applications, from solid compact laser devices operating in the visible region and infrared quantum counter detectors to three-dimensional displays, temperature sensors, solar cells, anti-counterfeiting, and biological fluorescence labels and probes [1-6]. Further efforts in development of methods for preparation of up-conversion (UC) materials are therefore justified with aims of enhancing their UC efficiency and reducing production costs. In addition, methods for UC nanoparticle (UCNP) synthesis are of particular interest for use in two-photon bio-imaging, sensitive luminescent bio-labels, and GaAs-coated highly efficient light-emitting diodes [7].
Lanthanide-based UC materials and UCNPs are of special interest due to unique spectroscopic properties of rare-earth ions like sharp intra-4f electronic transitions and existence of abundant, long-living electronic excited states at various energies that facilitate electron promotion to high-energy states [8]. In principal, lanthanide-based
UC materials and UCNPs consist of three components: a host matrix, a sensitizer, and an activator dopant. The choice of the host lattice determines the distance between the dopant ions, their relative spatial position, their coord-ination numbers, and the type of anions surrounding the dopant. The properties of the host lattice and its interaction with the dopant ions therefore have a strong influence on the UC process [9]. It has been shown that UC emission efficiency depends strongly on host phonon energy, where in low-phonon-energy hosts, multi-phonon relaxation processes are depressed and efficiency-enhanced [10]. Because of their excellent chemical stability, broad transpar-ency range, and good thermal conductivity, rare-earth sesquioxides are well-suited host materials [11]. Their phonon energy (ca. 560 cm−1) is higher compared to the most UC-efficient fluoride materials (ca. 350 cm−1), but lower compared to other host types (phosphates, vanadates, molybdates, titanates, zirconates, silicates, etc.). In addition, easy doping can be achieved with RE ions because of simi-larity in ionic radius and charge. For sensitizer dopant, Yb3+ is the most common choice for excitation around 980 nm, where a variety of inexpensive optical sources exists. This ion has a simple energy level structure with two levels and a larger absorption cross section compared to other trivalent rare-earth ions. The energy separation of Yb3+ 2F7/2ground state and 2F5/2excited state match-up
well the transitions of an activator dopant ion, which has
* Correspondence:[email protected] 1
Vinča Institute of Nuclear Sciences, University of Belgrade, P.O. Box 522, Belgrade 11001, Serbia
Full list of author information is available at the end of the article
easy charge transfer between its excited state and activator states. For visible emission, Er3+, Tm3+, Ho3+, and Pr3+are commonly used as activator dopants [12-16]. UC emission of different colors can be obtained in a material with different activators and their combinations. Er3+-doped materials emit green and red light, Tm3+ blue, Ho3+ green, and Pr3+red.
In recent times, a lot of effort is directed towards UC color tuning to obtain a material with characteristic emission usually by combining two or more activator ions [17] or by utilizing electron–electron and electron– phonon interactions in existing one-activator systems [18,19]. In this research we showed that color tuning from green to red can be achieved in Yb3+/Er3+ UCNP systems on account of changes of Yb3+sensitizer con-centration. For this purpose we prepared Y2O3 NPs,
the most well-known rare-earth sesquioxide host, co-doped with different Yb3+/Er3+ ratios. Nanosized phosphors offer a number of potential advantages over traditional, micro-scale ones in optical properties, such as high-resolution images and high luminescence efficiency
[20,21]. However, Vetrone et al. showed that CO32−and
OH− species are frequently adsorbed on the surface of sesquioxide nanoparticles [22]. Their high vibrational energies (about 1,500 and 3,350 cm−1 for CO32− and
OH−, respectively) decrease the UC efficiency through multi-phonon relaxations. For this reason we applied polymer complex solution (PCS) synthesis [23] since we found earlier that the PCS method provides sesquioxides with low surface area and defects and no adsorbed species on the surface [24-26].
Methods
Sample fabrication
Polymer complex solution method is a modified combus-tion method where instead of classical fuel (urea, glycine, carbohydrazide) an organic water-soluble polymer (in our case polyethylene glycol (PEG)) is used. The utility of this polymeric approach comes from the coordination of metal cations on the polymer chains during gelation process, resulting in very low cation mobility. Polymer precursor works both as a chelating agent and as an organic fuel to provide combustion heat for the calcination process. In this way PCS provides mixing of constituting elements at the atomic level and allows homogeneous control of very small dopant concentration. The first step in the PCS method is preparation of an aqueous solution containing metal salts and PEG. In the second step, removal of the excess water forces polymer species into closer proximity, converting the system into a resin-like gel. Upon ignition, an oxide powder is obtained, while considerable resin mass is lost as the polymer matrix is burned away.
Using this procedure, three Y2O3samples doped with
0.5 at.% of Er3+and 1, 2.5, and 5 at.% of Yb3+ ions were synthesized. In brief, appropriate stoichiometric quan-tities of yttrium oxide (Y2O3), erbium oxide (Er2O3),
and ytterbium oxide (Yb2O3) (all Alfa Aesar, 99.9%,
[image:2.595.58.290.88.262.2]Ward Hill, MA, USA) were mixed and dissolved in hot nitric acid. In the obtained solutions, PEG (Mw = 200, Alfa Aesar) was added in 1:1 mass ratio. The formed Figure 1XRD pattern of Y1.97Yb0.02Er0.01O3UCNPs.Diffraction
peaks are indexed according to PDF card #87-2368 (cubic bixbyite Y2O3crystal structure).
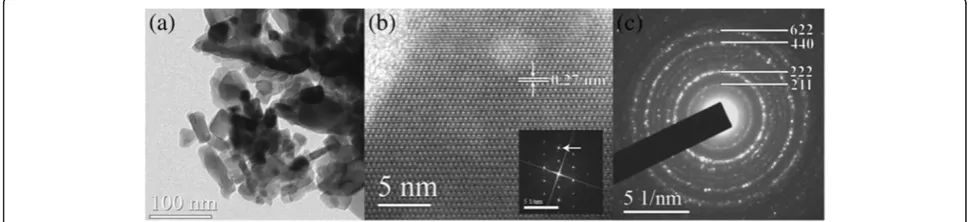
Figure 2TEM data from Y1.97Yb0.02Er0.01O3sample.(a) Bright-field image showing nanoparticle cluster. (b) [110] lattice image of a single
[image:2.595.55.540.584.695.2]metal-PEG solution was stirred at 80°C, resulting in a metal-PEG solid complex which was further fired at 800°C in air. The powders were additionally annealed at 800°C for 2 h in order to decompose the residual PEG and nitrite ions and to obtain pure crystal phase.
Characterization methods
Crystal structures of samples are checked by X-ray diffrac-tion (XRD) measurements. Measurements are performed on a Rigaku SmartLab system (Shibuya-ku, Japan) operat-ing with Cu Kα1,2radiation at 30 mA and 40 kV, in the 2θ
range from 15° to 100° (using continuous scan of 0.7°/s). Transmission electron microscopy (TEM) is conducted using a JEOL-JEM 2100 instrument (Akishima-shi, Japan) equipped with LaB6cathode and operated at 200 kV.
The up-conversion luminescence emissions and decays are measured upon excitation with 978-nm radiation (OPO EKSPLA NT 342, 5.2-ns pulse, Vilnius, Lithuania) on a Horiba Jobin-Yvon Model FHR1000 spectrofluorome-ter system (Kyoto, Japan) equipped with an ICCD Jobin-Yvon 3771 detector. For measurements of up-conversion emission intensity dependence on excitation power, a continuous-wave laser is used (980-nm radiation).
Results and discussion
The representative XRD pattern for the Y1.97Yb0.02Er0.01O3
-doped sample is shown in Figure 1. The XRD analysis confirms the presence of a cubic bixbyite Y2O3 crystal
[image:3.595.58.539.89.248.2]structure with space groupIa-3(no. 206), with diffraction peaks indexed according to the PDF card #87-2368. No other phases were detected and the small peak shifts in Figure 3UC spectra of NPs for all dopant compositions and photograph of pellets prepared from UCNPs.(a) UC spectra of
Y1.97Yb0.02Er0.01O3(green line), Y1.94Yb0.05Er0.01O3(yellow line), and Y1.89Yb0.10Er0.01O3(red line) NPs. (b) Photograph of pellets prepared from
UCNPs with different Yb3+concentrations taken under 978-nm excitation.
Figure 4UC spectra of NPs in UV-blue spectral region after excitation with 978-nm radiation.Y1.97Yb0.02Er0.01O3(green line),
[image:3.595.57.291.501.694.2]Y1.94Yb0.05Er0.01O3(blue line), and Y1.89Yb0.10Er0.01O3(red line).
[image:3.595.305.539.512.711.2]respect to pure Y2O3 are observed, indicating that Er3+
and Yb3+ions have been effectively incorporated into the host lattice. An average crystallite size in the range of 21 nm is found by Halder-Wagner method analysis of all major diffraction peaks.
The presence of nitrate, water, and carbon species on nanoparticle surfaces is checked by Fourier transform infrared (FT-IR) spectroscopy. Only Y-O stretching vibrations of the host lattice at 560 cm−1 are noted (see Additional file 1: Figure S1 for the FT-IR spectrum of Y1.97Yb0.02Er0.01O3 sample). This is favorable for efficient
emission since the high phonon energy of species adsorbed on the surface of nanoparticles may enhance significantly nonradiative de-excitation [13,22].
The UCNPs are further investigated by transmission electron microscopy, and representative images are given in Figure 2. One can see highly agglomerated crystalline nanoparticles with irregular, polygonal-like shapes having a size in the range of 30 to 50 nm with boundary lines observed clearly in some regions (Figure 2a). Strong particle agglomeration is a main drawback of the PCS synthesis method. It is a consequence of an extremely high temperature gradient that occurs while firing metal-PEG complex. At that instance a large amount of high-pressure vapors is produced in the sample that strongly press particles onto each other. On the other hand, high-temperature gradients and pressure facilitate production of well-crystallized powder. An examination at higher magnifications (Figure 2b) reveals that grain boundaries are without any irregularities and that the surface of observed crystals is free of defects and without any amorphous layers. The spotty ring selected-area electron diffraction pattern (Figure 2c) confirms that Y2O3 powder is polycrystalline
and is related to the fact that the constituent crystallites have a size of about 20 nm.
The up-conversion luminescence spectra of NPs, for all Yb/Er dopant compositions, are measured upon excitation with 978-nm radiation. The main red and green emissions are shown in Figure 3a. They
originate from Er3+f-felectronic transitions4F9/2→4I15/2
(red emission) and (2H11/2,4S3/2)→4I15/2(green emission)
and are facilitated by the two-photon UC process. Weak emissions from higher photon order UC processes can be observed in the blue spectral (410 nm,2H9/2→4I15/2
transition) and UV (390 nm,4G11/2→4I15/2transition)
regions shown in Figure 4. These higher photon order emission diminishes in NPs with lower Yb3+ content (Y1.97Yb0.02Er0.01O3). The variation in Yb3+ concentration
alters the red-to-green emission ratio (see Figure 3a), and consequently overall UC color of NPs is changed (see Figure 3b). The highest Yb3+concentration of 5 at.% produces red color, and yellow is obtained with 2.5 at.% and green with 1 at.%.
The energy level diagram of Yb3+and Er3+is shown in Figure 5 and illustrates the energy transfer from Yb3+to Er3+ which generates up-conversion in a following manner: population of 4F7/2 level in Er3+ leads to an
intermediate non-radiative relaxation to the 2H11/2 and 4
S3/2levels and further to two partially overlapped green
emissions at 522 and 563 nm due to the radiative relaxa-tions to the 4I15/2 level. Alternatively, the 4F7/2 level can
partially non-radiatively relax to the4F9/2level from which
red emission at 660 nm originates (4F9/2 → 4I15/2). Red
emission could be intensified by another up-conversion path which occurs after non-radiate relaxation of the4I11/2
to the 4I13/2 level, from where the additional
[image:4.595.58.539.90.226.2]popula-tion of the 4F9/2 level occurs through energy transfer.
[image:4.595.305.539.669.733.2]Figure 6Power dependence of UC emissions.Dependence of the green (green line and symbols) and red (red line and symbols) UC emissions on excitation power for (a) Y1.97Yb0.02Er0.01O3, (b) Y1.94Yb0.05Er0.01O3, and (c) Y1.89Yb0.10Er0.01O3NPs.
Table 1 Emission decay times for Y2O3:Yb3+, Er3+ nanoparticles upon 978-nm excitation
Green emission lifetime (ms)
Red emission lifetime (ms)
Y1.97Yb0.02Er0.01O3 0.36 0.71
Y1.94Yb0.05Er0.01O3 0.38 0.60
The population of the 2H9/2 level is realized by the
excited state absorption from 4I13/2 and 4F9/2 levels.
Blue up-conversion emission occurs by its radiative de-excitations to the 4I15/2level. Power dependence of
UC emissions, given in Figure 6, confirms that two-photon processes are responsible for green and red UC emissions. The observed slopes are similar for 1 and 2.5 at.% Yb3+-doped samples and slightly higher for 5 at.% Yb3+doping.
Changes in red-to-green emission ratio with Yb3+ concentration increase in Y2O3:Er3+ bulk and NPs are
discussed by Vetrone et al. [22]. They observed this phenomenon to be much more pronounced in NPs compared to bulk. They concluded that a cross-relaxation mechanism of 4F7/2 → 4F9/2 and 4F9/2 ← 4I11/2 is partly
responsible for the red enhancement, but phonons of ligand species present on the NP surface enhance the probability of 4F9/2 level population from the 4I13/2
level. However, in the present case, no adsorbed species on the NPs are detected, as in other cases of NPs prepared with the PCS method. TEM images in Figure 2 and the Stark splitting of emission clearly evident in Figure 3a demonstrate the crystalline na-ture of NPs. Also, the values of UC emission decays, given in Table 1, are much larger compared to those from [22], indicating in this way the absence of a strong ligand influence on UC processes. Silver et al. [27] noticed that the Yb3+ 2F5/2excited level may also
receive electrons from higher energy levels of nearby Er3+ ions, back transferring energy from Er3+ to Yb3+ ions. When they compared spectra of Y2O3:Eu3+with Yb3+,
they noted that the up-conversion and down-conversion emissions lost intensity in the presence of Yb3+and that was least apparent for the red 4F9/2 → 4I15/2 transition,
even for a Yb3+/Er3+ ratio of 5:0.5. The decrease of4F9/2
lifetime with Yb3+ concentration increase (Table 1) is a consequence of enlarged population of 2H9/2 by excited
state absorption from the 4F9/2 level, which is evidenced
through enhancement of blue emission (2H9/2→4I15/2) for
larger Yb3+content (see Figure 4). Conclusions
In conclusion, yttrium oxide powders doped with Er3+ ions and co-doped with different concentrations of Yb3+ions are successfully prepared using polymer com-plex solution method. This simple and fast synthesis method provides powders consisting of well-crystallized nanoparticles (30 to 50 nm in diameter) with no adsorbed species on their surface. The powders exhibit up-conversion emission upon 978-nm excitation, with a color that can be tuned from green to red by changing the Yb3+/Er3+ concen-tration ratio. This effect can be achieved in nanostructured hosts where electron–phonon interaction is altered compared to the bulk material.
Additional file
Additional file 1: Figure S1.FT-IR spectrum of Y1.97Yb0.02Er0.01O3.
Competing interests
The authors declare that they have no competing interests.
Authors’contributions
VL carried out the material synthesis. PA performed the TEM study. VL and MD carried out the X-ray diffraction and luminescence analysis. MD supervised the research activity. VL and MD wrote the manuscript. All authors discussed and commented on the manuscript. All authors approved the final manuscript.
Acknowledgments
The authors would like to acknowledge the support from the Ministry of Education, Science and Technological Development of the Republic of Serbia (grant no. 45020).
Author details
1
Vinča Institute of Nuclear Sciences, University of Belgrade, P.O. Box 522, Belgrade 11001, Serbia.2South Dakota School of Mines & Technology, Rapid
City, SD 57701, USA.
Received: 10 February 2013 Accepted: 11 March 2013 Published: 22 March 2013
References
1. Vetrone F, Boyer JC, Capobianco JA, Speghini A, Bettinelli M:980 nm excited upconversion in an Er-doped ZnO-TeO2glass.Appl Phys Let2002,
80(10):1752–1754.
2. Man SQ, Pun EYB, Chung PS:Upconversion luminescence of Er3+ in alkali bismuth gallate glasses.Appl Phys Lett2000,77(4):483–485.
3. Zhang HX, Kam CH, Zhou Y, Han XQ, Buddhudu S, Xiang Q, Lam YL, Chan YC:Green upconversion luminescence in Er3+:BaTiO3films.Appl Phys Lett 2000,77(5):609–611.
4. Luo XX, Cao WH:Upconversion luminescence of holmium and ytterbium co-doped yttrium oxysulfide phosphor.Mater Lett2007,61(17):3696–3700. 5. Zhan J, Shen H, Guo W, Wang S, Zhu C, Xue F, Hou J, Su H, Yuan Z:An
upconversion NaYF4:Yb3+, Er3+/TiO2core-shell nanoparticle
photoelectrode for improved efficiencies of dye-sensitized solar cells.
J Power Sources2013,226:47–53.
6. Ming C, Song F, Ren X:Color variety of up-conversion emission of Er3+/Yb3+ co-doped phosphate glass ceramics.Curr Appl Phys2013,13(2):351–354. 7. Liu G, Chen X:Spectroscopic properties of lanthanides in nanomaterials. In
Handbook on the Physics and Chemistry of Rare Earths.Edited by Gschneide KA Jr, Bünzli J-CG, Pecharsky VK. Amsterdam: Elsevier; 2007:99–169.
8. Sivakumar S, van Veggel FCJM, May PS:Near-infrared (NIR) to red and green up-conversion emission from silica sol–gel thin films made with La0.45Yb0.50Er0.05F3nanoparticles, hetero-looping-enhanced energy
transfer (Hetero-LEET): a new up-conversion process.J Am Chem Soc
2007,129(3):620–625.
9. Haase M, Schäfer H:Upconverting nanoparticles.Angew Chem Int Edit
2011,50(26):5808–5829.
10. Zhang T, Yu L, Wang J, Wu J:Microstructure and up-conversion luminescence of Yb3+and Ho3+co-doped BST tick films.J Mater Sci2010,
45(24):6819–6823.
11. Martinez A, Morales J, Diaz-Torres LA, Salas P, De la Rosa E, Oliva J, Desirena H:Green and red upconverted emission of hydrothermal synthesized Y2O3: Er3+–Yb3+nanophosphors using different solvent ratio conditions.
Mater Sci Eng B2010,174(1–3):164–168.
12. Yang Z, Yan L, Yan D, Song Z, Zhou D, Jin Z, Qui J:Color tunable upconversion emission in Yb, Er co-doped bismuth titanate inverse opal.
J Am Chem Soc2011,94(8):2308–2310.
13. Capobianco JA, Boyer JC, Vetrone F, Speghini A, Bettinelli M:Optical spectroscopy and upconversion studies of Ho3+-doped bulk and
nanocrystalline Y2O3.Chem Mater2002,14(7):2915–2921.
14. Guyot Y, Moncorge R, Merkle LF, Pinto A, Mclntosh B, Verdun H:Luminescence properties of Y2O3single crystals doped with Pr3+or Tm3+and codoped with
15. Wang X, Bu Y, Xiao S, Yang X, Ding JW:Upconversion in Ho3+-doped YbF 3
particle prepared by coprecipitation method.J Appl Phys B2008,93(4):801–807. 16. Chen GY, Yang GH, Aghahadi B, Liang HJ, Liu Y, Li L, Zhang ZG:
Ultraviolet-blue upconversion emissions of Ho3+ions.J Opt Soc Am B2010,
27(6):1158–1164.
17. Gong L, Maa M, Xu C, Li X, Wang S, Lin J, Yang Q:Multicolor upconversion emission of dispersed ultra small cubic Sr2LuF7nanocrystals synthesized
by a solvothermal process.J Lumin2013,134:718–723. 18. Chen Z, Gong W, Chen T, Li S, Wang D, Wang Q:Preparation and
upconversion luminescence of Er3+/Yb3+codoped Y2Ti2O7nanocrystals.
Mater Lett2012,68:137–139.
19. Xie M, Peng X, Fu X, Zhang J, Li G, Yu X:Synthesis of Yb3+/Er3+co-doped MnF2nanocrystals with bright red up-converted fluorescence.Scripta
Mater2009,60(3):190–193.
20. Ye X, Zhuang W, Hu Y, He T, Huang X, Liao C, Zhong S, Xu Z, Nie H, Deng G:
Preparation, characterization, and optical properties of nano- and submicron-sized Y2O3:Eu3+phosphors.J Appl Phys2009,105(5):064302–064308. 21. Medintz IL, Uyeda HT, Goldman ER, Mattoussi H:Quantum dot
bioconjugates for imaging, labelling and sensing.Nat Mater2005,
4(6):435–446.
22. Vetrone F, Boyer JC, Capobianco JA, Speghini A, Bettinelli M:Significance of Yb3+ concentration on the upconversion mechanisms in codoped Y2O3:
Er3+, Yb3+ nanocrystals.J Appl Phys2004,96(1):661–667.
23. LukićSR, PetrovićDM, Dramićanin MD, MitrićM, Djačanin L:Optical and structural properties of Zn2SiO4:Mn2+green phosphor nanoparticles
obtained by a polymer-assisted sol–gel method.Scripta Mater2008,
58(8):655–658.
24. Andrić Ž, Dramićanin MD, MitrićM, JokanovićV, Bessière A, Viana B:
Polymer complex solution synthesis of (YxGd1−x)2O3:Eu3+nanopowders.
Opt Mater2008,30(7):1023–1027.
25. Antić Ž, KrsmanovićR, Wojtowicz M, Zych E, Bártová B, Dramićanin MD:
Preparation, structural and spectroscopic studies of (YxLu1−x)2O3:Eu3+
nanopowders.Opt Mater2010,32(12):1612–1617.
26. KrsmanovićR, Antić Ž, Bártová B, Dramićanin MD:Characterization of rare-earth doped Lu2O3nanopowders prepared with polymer complex
solution synthesis.J Alloy Compd2010,505(1):224–228.
27. Silver J, Martinez-Rubio MI, Ireland TG, Fern GR, Withnall R:The effect of particle morphology and crystallite size on the upconversion luminescence properties of erbium and ytterbium co-doped yttrium oxide phosphors.J Phys Chem B2001,105(5):948–953.
doi:10.1186/1556-276X-8-131
Cite this article as:Lojpuret al.:Color-tunable up-conversion emission in Y2O3:Yb3+, Er3+nanoparticles prepared by polymer complex solution
method.Nanoscale Research Letters20138:131.
Submit your manuscript to a
journal and benefi t from:
7 Convenient online submission 7 Rigorous peer review
7 Immediate publication on acceptance 7 Open access: articles freely available online 7 High visibility within the fi eld
7 Retaining the copyright to your article