N A N O E X P R E S S
Open Access
Lithium ionic conduction and relaxation dynamics
of spark plasma sintered Li
5
La
3
Ta
2
O
12
garnet
nanoceramics
Mohamad M Ahmad
1,2Abstract
In the present work, nanoceramics of Li5La3Ta2O12(LLT) lithium ion conductors with the garnet-like structure are
fabricated by spark plasma sintering (SPS) technique at different temperatures of 850°C, 875°C, and 900°C (SPS-850, SPS-875, and SPS-900). The grain size of the SPS nanoceramics is in the 50 to 100 nm range, indicating minimal grain growth during the SPS experiments. The ionic conduction and relaxation properties of the current garnets are studied by impedance spectroscopy (IS) measurements. The SPS-875 garnets exhibit the highest total Li ionic conductivity of 1.25 × 10⁻⁶S/cm at RT, which is in the same range as the LLT garnets prepared by conventional sintering technique. The high conductivity of SPS-875 sample is due to the enhanced mobility of Li ions by one order of magnitude compared to SPS-850 and SPS-900 ceramics. The concentration of mobile Li+ions,nc, and their mobility are estimated from the analysis
of the conductivity spectra at different temperatures.ncis found to be independent of temperature for the SPS
nanoceramics, which implies that the conduction process is controlled by the Li+mobility. Interestingly, we found that only a small fraction of lithium ions of 3.9% out of the total lithium content are mobile and contribute to the conduction process. Moreover, the relaxation dynamics in the investigated materials have been studied through the electric modulus formalism.
Keywords:Lithium garnet materials; Spark plasma sintering; Nanoceramics; Ionic conduction; Relaxation properties
Background
Li5La3Ta2O12(LLT) lithium ion conductors with the garnet-like structure have received considerable research interests due to their electrical, electrochemical, and mechanical prop-erties [1-13]. These materials have good ionicconductivity in the range of 10−6S/cm at RT with small contributions from the grain boundaries and negligible electronic conductivity [1-3]. Lithium conducting garnets are also electrochem-ically stable in contact with lithium metal and other com-mon electrodes and are also stable in ambient atmosphere [1-3]. These properties make LLT garnets promising alter-natives for the hazards organic and polymer-based lithium electrolytes in lithium ion batteries produce. However, the recorded ionic conductivity values of LLT materials are much lower than the organic/polymer-based lithium
electrolytes. Therefore, extensive research work is de-voted to enhance the ionic conductivity in LLT con-ducting garnets. The most used strategy to enhance the conductivity is by chemical substitutions either by divalent cations on the La sites (such as Li6ALa 2-Ta2O12, A = Ba, Ca, Sr, Mg, [2-9]) or by trivalent cat-ions on the Ta sites (such as Li5+2xLa3Ta2-xYxO12[10]). By this strategy, the conductivity could reach a value of 10−5to 10−4S/cm at RT [2-10]. Moreover, the ionic conductivity of LLT garnets could be influenced by the preparation techniques (solid state reaction or sol-gel techniques) and processing conditions including the temperature of calcinations and sintering steps [1-11].
Another route to influence the ionic conductivity of ionic conducting materials is through modifying the microstructure. In several examples, the ionic conduct-ivity increases for nanostructured materials such as CaF2-BaF2 fluoride ion conductors [14], CeO2oxide ion conducting nanoceramics [15,16], and nanocrystalline LiNbO3 and LiTaO3 lithium ion conductors [17,18]. Correspondence:[email protected]
1Department of Physics, College of Science, King Faisal University, Hofuf,
Al-Ahsaa 31982, Saudi Arabia
2Physics Department, Faculty of Science, Assiut University in The New Valley,
El-Kharga, The New Valley 72511, Egypt
However, this is not straightforward since the ionic con-ductivity was found to decrease in other materials when the grain size is reduced [19]. Although nanocrystalline powder of LLT lithium garnet materials have been prepared by sol-gel techniques with a grain size of 100 to 200 nm, the grain size increases considerably to 3μm after sintering the sam-ple at 900°C for 5 h [11]. A similar behavior was also ob-served in Li6BaLa2Ta2O12garnet materials [9]. The grain growth of the nanopowder is due to the conventional sin-tering which includes heating at high temperatures for long durations. Therefore, other innovative sintering techniques such as spark plasma sintering (SPS) could overcome these drawbacks and yield nanoceramic mate-rials [15,16,20-23]. SPS experiments, which are performed at a lower temperature and for short time duration (within few minutes) compared to conventional sintering, can successfully minimize grain coarsening during the sinter-ing process that leads to successful fabrication of dense nanomaterials. SPS is widely used to sinter a variety of conducting and non-conducting materials including lith-ium ion conductors, such as NASICON-type LiTi2(PO4)3 and LiHf2(PO4)3 [21,22], perovskite Li3xLa2/3-xTiO3 [23], and garnet type Li5La3Bi2O12lithium ion conductors [24].
In the current work, we synthesize the nanocrystalline Li+ ion conductor LLT by a combination of mechanical milling and solid state reaction techniques. The prepared nanopow-der is sintered by spark plasma sintering at different temper-atures. The microstructure, the ionic conduction, and relaxation properties will be studied in details.
Methods
LLT was prepared by a combination of mechanical milling and solid state reaction techniques. Stoichiometric amounts of Li2CO3 (with 10 wt% excess of Li2CO3 was added to compensate for lithium loss at high temperatures), Ta2O5, and La2O3(dried at 900°C overnight) were mixed together and calcinated at 700°C for 12 h. Before and after the cal-cination step, the powder was ball milled in 2-propanole for 12 h using tungsten carbide balls (10 mm diameter) and pots with a rotation speed of 350 rpm. The ratio of balls to powder mass was kept 10:1. The dried powder was then spark plasma sintered at different temperatures. In the SPS experiment, the product powder was sintered at 850°C, 875°C, and 900°C (call the samples SPS-850, SPS-875, and SPS-900, respectively) using SPS 4 - 10 system (4,000 amp, 10 tons: Thermal Technology LLC, Santa Rosa, USA). The SPS experiments were performed by using graphite die of 20 mm diameter under 60 MPa pressure with a heating rate of 100°C/min. The samples were first heated to 450°C and kept at this temperature for 5 min, and then the temperature was raised to the final sintering temperature. The dwelling time was fixed to 10 min followed by rapid cooling.
Powder X-ray diffraction and scanning electron mi-croscopy measurements were performed for structural characterization of the materials. X-ray diffraction (XRD) data were collected over the 0≤2θ≤100 range using a Stoe Stadi-P Image Plate, IP, (Stoe and Cie GmbH, Darm-stadt, Germany), with monochromated Cu Kα1 radiation (λ= 1.5406 Å). Scanning electron microscopy (SEM) mea-surements were performed by JEOL SM7600F (JEOL Ltd., Akishima-shi, Japan) field emission scanning electron microscope in order to determine the grain size of the product materials. The electrical and relaxation properties were studied by impedance spectroscopy (IS) measure-ments performed on the sintered materials using Novo-control concept 50 system in the 1 to 107Hz frequency range. The IS measurements were performed in the 200 to 400 K temperature range where the temperature was controlled by the Quatro cryosystem.
Results and discussion
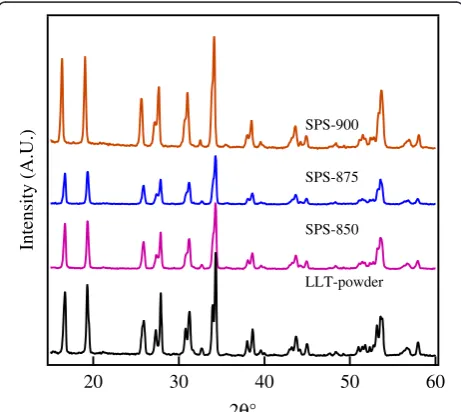
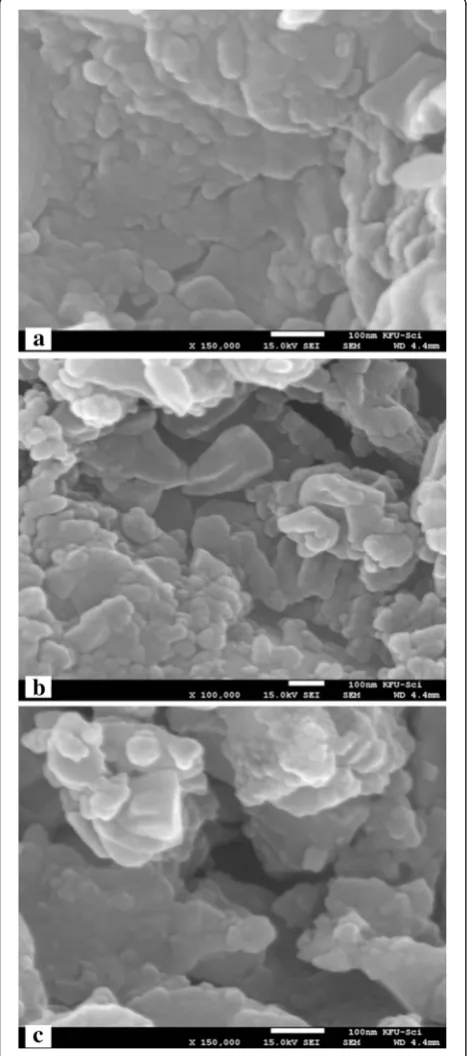
X-ray powder diffraction patterns of the investigated ma-terials are shown in Figure 1. All the spark plasma sintered samples show similar XRD patterns as the standard pat-terns of LLT with no secondary phases observed [1]. The SEM micrographs of the sintered ceramics are shown in Figure 2, which indicates that the SPS-850, SPS-875, and SPS-900 LLT ceramics have nano-sized grains with a grain size of 50 to 100 nm. These results indicate that spark plasma sintering produces nanoceramics of LLT garnet materials with considerably reduced grain size compared to the conventionally sintered ceramics that usually have coarse grained ceramics with grain size in the micrometer range [5,9,11].
Intensity (A.U.)
60 50
40 30
20
SPS-900
SPS-875
SPS-850
[image:2.595.306.537.496.702.2]LLT-powder
Figure 1XRD patterns of Li5La3Ta2O12powder and SPS
The electrical properties of the investigated materials have been studied through impedance spectroscopy mea-surements. Representative complex impedance diagrams of the SPS ceramics are shown in Figure 3 at selected tem-peratures. The impedance diagrams show one semicircle
Figure 2SEM micrographs of SPS LLT nanoceramics. (a)SPS-850, (b)SPS-875, and(c)SPS-900 LLT garnets. The bar in the figures is 100 nm.
14
12
10
8
6
4
2
0
z '' (
Ω
cm) x10
6
14 12 10 8 6 4 2 0
z ' (Ω cm) x106 290 K 300 K 310 K
a
2.5
2.0
1.5
1.0
0.5
0.0
z '' (
Ω
cm) x10
6
2.5 2.0 1.5
1.0 0.5 0.0
z ' (Ω cm) x106 290 K 300 K 310 K
b
25
20
15
10
5
0
z '' (
Ω
cm) x10
6
25 20
15 10
5 0
z ' (Ω cm) x106 290 K
300 K 310 K
c
[image:3.595.57.292.92.621.2]at the high frequency region that could not be separated to grain and grain boundary contributions. Therefore, the intercept of the semicircle with the real axis represents the total (grain + grain boundary) ionic conductivity. At low frequencies, a large spike is observed which originates from electrode polarization effects and becomes more prominent at higher temperatures. The temperature de-pendence of the ionic conductivity of the SPS samples is shown in Figure 4. The values of the total conductivity at 27°C for the investigated materials are listed in Table 1. The total ionic conductivity first increases by one order of magnitude with increasing the SPS temperature from a value of 2.98 × 10⁻⁷ S/cm for the SPS-850 sample to 1.25 × 10⁻⁶S/cm for the SPS-875 sample. With further in-crease of the SPS temperature to 900°C, the conductivity drops to 1.3 × 10⁻⁷ S/cm. The conductivity value of the SPS-875 nanoceramics in the present work is similar to the values reported previously for conventionally sin-tered LLT samples prepared either by solid state reac-tion or sol-gel techniques and sintered at 950°C and 900°C, respectively [1,11].
-10 -8 -6 -4
log
σ
' (S/cm)
4.5 4.0
3.5 3.0
2.5
1000/T (K-1
)
[image:4.595.304.539.86.688.2]SPS-850 SPS-875 SPS-900
Figure 4The temperature dependence of the ionic conductivity for the SPS samples.
Table 1 The conductivity and the activation energy of SPS LLT nanoceramics
σdc(S/cm) ΔE(e.V) ΔE(e.V) Eσ(e.V) EH(e.V) ED(e.V) Em(e.V) <350 K >350 K
SPS-850 2.98 × 10⁻⁷ 0.67 0.58 0.67 0.65 0.65 0.67
SPS-875 1.25 × 10⁻⁶ 0.64 0.52 0.61 0.59 0.59 0.64
SPS-900 1.3 × 10⁻⁷ 0.69 0.61 0.72 0.72 0.72 0.69
The dc conductivityσdcat 27°C and the associated activation energyΔEat the low- and high-temperature regions of the SPS LLT garnet nanoceramics. The activation energy values determined from the conductionEσ, the hopping
[image:4.595.57.294.88.293.2]frequencyEH, the diffusion coefficientED, and the electric modulus relaxation timeEmare also summarized.
[image:4.595.58.292.625.691.2]The conductivity data in Figure 4 shows two straight-line regions for the all studied samples with different values of activation energy. It is interesting mentioning that the conductivity data in the literature of most lith-ium conducting garnets are treated as a single straight line region with a single activation energy value, despite the clear curvature of the conductivity data especially at high temperatures [1-11]. Recent conductivity and NMR studies on Li6.5La2.5Ba0.5ZrTaO12 garnets showed two temperature regions with activation energy values of 0.57 and 0.37 e.V for the low- and high-temperature re-gions, respectively [25]. The conductivity data in Figure 4 could be fitted by the Arrhenius relation:
σ¼ σo exp − ΔE
k T
; ð1Þ
where σo is the pre-exponential factor, k is Boltzman constant, and ΔE is the activation energy for the ionic conduction. The values of the activation energy deter-mined from the conductivity data are summarized in Table 1. It is noticed from this table that the activation energy values of the low-temperature region (<350 K) are higher than in the high-temperature region, with the SPS-875 sample showing the lowest activation energy. The presence of two thermally activated regions may
indicate a change in the conduction mechanism with in-creasing temperature [25].
In order to understand the conduction behavior of the investigated materials, it is essential to determine the pri-mary factors that control the ionic conduction process. The dc conductivity could be described by the following relation:
σdc¼e ncμ ð2Þ
whereeis the electronic charge,ncis the concentration of mobile charge carriers, andμis the charge carriers' mobil-ity. Therefore, the primary factors that influence the ionic conduction process are the concentration and mobility of Li+ ions. Here, we can estimate the concentration of the mobile Li+ ionsncand their mobility μthrough the ana-lysis of the frequency dependence of the real part of the complex conductivity. The conductivity spectra of differ-ent ionic conductors are usually analyzed by a power-law model of the form [26],
σ0ð Þ ¼ω σ
dc½1þðω=ωcÞn; ð3Þ
[image:5.595.57.541.449.716.2]whereω is the angular frequency,nis the power-law ex-ponent, andωc is the crossover frequency from the dc to the dispersive conductivity region. The dc conductivity in
Table 2 The parameters of the conduction process in SPS LLT garnet nanoceramics
T (K) σdc(S/cm) ωH(Hz) n nc(cm−3) μ(cm2V−1s−1) D(cm2s−1)
SPS-850
230 1.15 × 10⁻¹⁰ 4.87 × 10² 0.60 6.08 × 10²⁰ 1.18 × 10⁻¹² 2.34 × 10⁻¹⁴
240 4.16 × 10⁻¹⁰ 1.68 × 10³ 0.60 6.62 × 10²⁰ 3.92 × 10⁻¹² 8.11 × 10⁻¹⁴
250 1.45 × 10⁻⁹ 5.21 × 10³ 0.60 7.78 × 10²⁰ 1.16 × 10⁻¹¹ 2.51 × 10⁻¹³
260 5.32 × 10⁻⁹ 1.93 × 10⁴ 0.61 7.99 × 10²⁰ 4.16 × 10⁻¹¹ 9.31 × 10⁻¹³
270 1.75 × 10⁻⁸ 6.10 × 10⁴ 0.62 8.65 × 10²⁰ 1.26 × 10⁻¹⁰ 2.94 × 10⁻¹²
SPS-875
220 1.47 × 10⁻¹⁰ 5.90 × 10² 0.61 6.13 × 10²⁰ 1.50 × 10⁻¹² 2.84 × 10⁻¹⁴
230 5.37 × 10⁻¹⁰ 2.12 × 10³ 0.61 6.50 × 10²⁰ 5.16 × 10⁻¹² 1.02 × 10⁻¹³
240 1.83 × 10⁻⁹ 6.48 × 10³ 0.61 7.56 × 10²⁰ 1.51 × 10⁻¹¹ 3.12 × 10⁻¹³
250 6.44 × 10⁻⁹ 2.32 × 10⁴ 0.62 7.74 × 10²⁰ 5.19 × 10⁻¹¹ 1.12 × 10⁻¹²
260 2.18 × 10⁻⁸ 7.33 × 10⁴ 0.62 8.64 × 10²⁰ 1.57 × 10⁻¹⁰ 3.53 × 10⁻¹²
SPS-900
240 1.28 × 10⁻¹⁰ 4.88 × 10² 0.60 7.02 × 10²⁰ 1.14 × 10⁻¹² 2.35 × 10⁻¹⁴
250 4.63 × 10⁻¹⁰ 1.83 × 10³ 0.62 7.07 × 10²⁰ 4.09 × 10⁻¹² 8.80 × 10⁻¹⁴
260 1.69 × 10⁻⁹ 6.36 × 10³ 0.64 7.71 × 10²⁰ 1.37 × 10⁻¹¹ 3.06 × 10⁻¹³
270 5.97 × 10⁻⁹ 2.30 × 10⁴ 0.66 7.81 × 10²⁰ 4.77 × 10⁻¹¹ 1.11 × 10⁻¹²
280 1.85 × 10⁻⁸ 6.83 × 10⁴ 0.64 8.45 × 10²⁰ 1.37 × 10⁻¹⁰ 3.30 × 10⁻¹²
Equations 2 and 3 could be given by the Nernst-Einstein relation;
σdc ¼ encμ ¼ nce
2γ λ2
k T ωH; ð4Þ
whereγis a geometrical factor for ion hopping,λ is the hopping distance, andωH is the hopping frequency of mobile ions. The crossover frequency ωc represents a good estimate of the true hopping frequency of mo-bile ions,ωH [27-30]. Therefore, we have analyzed the conductivity spectra of the investigated materials using Equation 3 in order to determine the values of σdcandωc.
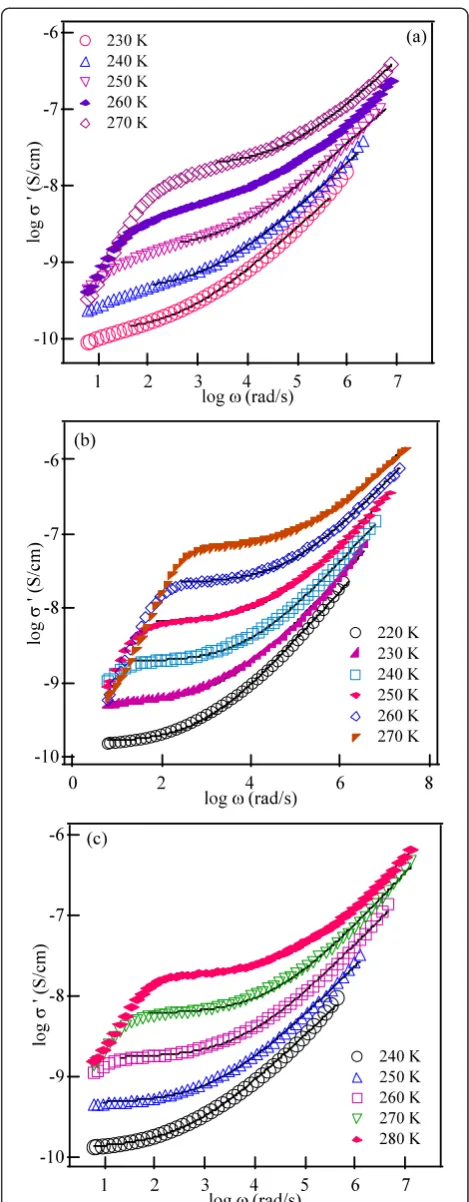
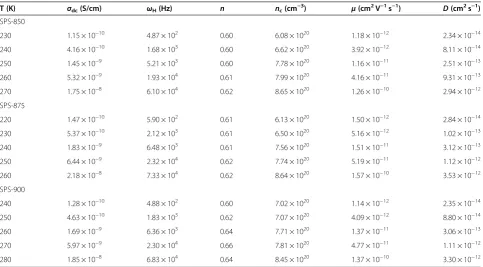
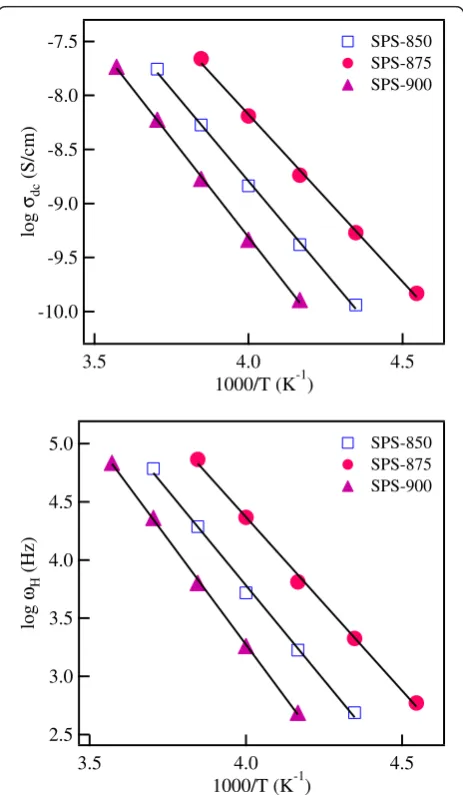
The fitting results of the conductivity data are shown as solid curves in Figure 5a,b,c for SPS-850, SPS-875, and SPS-900 garnet nanoceramics. The extracted values of σdc, ωH and n are summarized in Table 2, and the temperature dependence of σdc and ωH is shown in Figure 6. Both nc and ωH of mobile Li+ ions may be thermally activated and could be written as [28]
nc¼ n0Exp − Ec
kT
; ð5aÞ
ωH¼ ω0Exp − EH
kT
; ð5bÞ
whereEc andEHare the activation energies for the cre-ation and migrcre-ation of charge carriers, respectively. It is observed from Equations 4 and 5 that the activation en-ergy of the dc conductivity isEσ=Ec+EH. The activation energy values for the ionic conduction, Eσ, and for ion
hopping, EH, determined from the straight-line fits of the data in Figure 6 are listed in Table 1 for the SPS gar-net nanoceramics. The close agreement of Eσ and EH leads to a value ofEc~ 0 e.V, indicating that the concen-tration of mobile Li+ions,nc, is independent of temperature [27-30]. Since nc is independent of temperature for each SPS sample, then the ionic conduction in these materials is controlled by the mobility of mobile Li+ions.
The values ofnc for mobile Li+ ions in LLT nanocera-mics have been estimated using Equation 4, with a hop-ping distance as short as λ= 1.7 Å has been used [31]. The estimated values of ncat different temperatures for the investigated materials are listed in Table 2. We no-tice that the values of nc for all the SPS LLT ceramics are almost independent of temperature with average values of 7.42 × 10²⁰, 7.31 × 10²⁰, and 7.61 × 1020 cm−3 for SPS-850, SPS-875, and SPS-900 nanoceramics, re-spectively. These results show that the values ofncfor all the SPS LLT garnets are almost the same. Therefore, the enhanced conductivity of SPS-875 ceramics by about one order of magnitude compared to SPS-850 and SPS-900 samples is due to the enhanced Li ionic mobility/hopping
frequency as observed in Figure 6b and Table 2. There are different factors that may affect the mobility of Li ions in garnet materials processed by spark plasma sintering in-cluding the grain size, the grain-to-grain bonding, the pos-sible loss of Li at high sintering temperatures, and the possible formation of secondary insulating phases in the materials [20]. The enhanced mobility/conductivity in SPS-875 ceramics compared to SPS-850 could be due to the improved grain-to-grain bonding with increasing the SPS temperature [20-23]. With further increasing the SPS temperature, partial decomposition and/or loss of Li could occur, which may lead to the formation of minor impurity phases in the materials [20,32,33]. These features could be the reasons for the drop of the conductivity for SPS-900 ceramics. Similar dependence of the Li ionic conductivity on the SPS temperature
5.0
4.5
4.0
3.5
3.0
2.5
log
ωH
(Hz)
4.5 4.0
3.5
1000/T (K-1)
SPS-850 SPS-875 SPS-900
-10.0 -9.5 -9.0 -8.5 -8.0 -7.5
log
σdc
(S/cm)
4.5 4.0
3.5
1000/T (K-1)
[image:6.595.306.538.296.694.2]SPS-850 SPS-875 SPS-900
Figure 6The temperature dependence ofσdcandωHof the
SPS lithium conducting garnets.σdcandωHhave been
was observed for Li5La3Nb2O12 and Li1.3Al0.3Ti1.7 (PO4)3ceramics [33,34].
It is interesting to compare the values of ncwith that of the total density N of Li+ ions, which is calculated using the relation; N=m/V, where m is the number of lithium ions per unit cell (m= 40 in LLT) and V is the volume of the unit cell. Using a lattice parameter value of 12.804 Å [1] gives a value of N of 1.91 × 1022 cm−3. Accordingly, the ratio of the concentration of mobile Li+ ions,nc, to the total Li+ density,N, is about 3.9% in the spark plasma sintered LLT nanoceramics.
The diffusion coefficient,D, of Li+ ions could be esti-mated from the following relation:
σdc¼ e 2n
c
k T D ð6Þ
The values of the mobility μ and the diffusion coeffi-cient Dof mobile Li+ ions in the SPS LLT garnets have been calculated using Equations 2 and 6, respectively. The values of μ and D at different temperatures are listed in Table 2. Moreover, the temperature dependence of D for different SPS LLT nanoceramics is shown in Figure 7. The diffusion coefficient is thermally activated with the same activation energy of the conduction process as is observed in Table 1. The extrapolation of the diffusion coefficient to RT (27°C) gives a value ofD of 4.36 × 10⁻¹¹, 1.11 × 10⁻¹⁰, and 2.37 × 10⁻¹¹cm2s−1for SPS-850, SPS-875, and SPS-900 samples, respectively. These values ofDare two to three orders of magnitude lower than Li superionic conductors (D~ 10−8cm2s−1) that exhibit ionic conductivity values of >10−3 S/cm at RT [35].
16
14
12
10
8
6
4
2
0
M
'' x10
-3
7 6 5 4 3 2 1 0
log f (Hz)
230 K 250 K 270 K 290 K 310 K 330 K 350 K
a
b
c
25
20
15
10
5
0
M
'' x10
-3
7 6 5 4 3 2 1 0
log f (Hz)
220 K 240 K 260 K 280 K 300 K 320 K 340 K
20
15
10
5
0
M
'' x10
-3
7 6 5 4 3 2 1 0
log f (Hz)
[image:7.595.304.539.86.690.2]240 K 260 K 280 K 300 K 320 K 340 K 360 K
Figure 8The electric modulus spectra at different temperatures. (a)SPS-850,(b)SPS-875, and(c)SPS-900 garnet nanoceramics.
-14 -13 -12 -11
log
D
(cm
2 s -1 )
4.6 4.4 4.2 4.0 3.8 3.6
1000/T (K-1)
SPS-850 SPS-875 SPS-900
[image:7.595.57.292.510.703.2]The relaxation dynamics of Li+ ions in SPS LLT nano-ceramics are studied through the frequency dependence of the electric modulus formalism. The electric modulus is related to the impedance by the relation:
Mð Þ ¼ω jωCoZð Þω ð7Þ
whereCo=εoA/dis the capacitance of a free sample cell with electrode aria A and electrode separation d, and εo= 8.854 × 10⁻¹⁴F/cm is the permittivity of free space. The frequency dependence of the imaginary part of the electric modulus, M'', at different temperatures is shown in Figure 8a,b,c for the investigated garnet materials. Well-defined peaks are observed in the modulus spectra. These peaks represent re-orientation relaxation process of mobile Li+ions [10]. The low-frequency side of the peaks is the re-gion where Li+ions are capable to form successful hopping from one site to the next, whereas the high frequency side of the peak is where Li+ions can perform local (re-orientation) motion only [36]. The peak positions in the modulus spectra shift toward high frequency with increasing temperature, in-dicating a thermally activated relaxation process [36]. The most probable conductivity relaxation time is determined from the frequency of the peak according to the relation:
τM= 1/2πfmax, wherefmaxis the frequency at peak max-imum. The temperature dependence of the relaxation time of the investigated materials is presented in Figure 9 and could be expressed in the following Arrhenius relation:
τ¼ τoexp Em
kT ð8Þ
1.0
0.8
0.6
0.4
0.2
0.0
M'' / M''
max
-6 -4 -2 0 2 4
log f / fmax
240 K 260 K 280 K 300 K 320 K 340 K 360 K
c
1.0
0.8
0.6
0.4
0.2
0.0
M'' / M''
max
0 2 4
log f / fmax
220 K 240 K 260 K 280 K 300 K 320 K 340 K 1.0
0.8
0.6
0.4
0.2
0.0
M'' / M''
max
0 2 4 6
log f / fmax
230 K 0 K 0 K 0 K 310 K 330 K 0 K
a
[image:8.595.306.537.86.694.2]b
Figure 10Scaling of the modulus spectra at different temperatures. (a)SPS-850,(b)SPS-875, and(c)SPS-900 garnets.
-8 -7 -6 -5 -4 -3 -2 -1
log
τ
(sec.)
4.5 4.0
3.5 3.0
1000/T (K-1)
[image:8.595.56.298.427.710.2]SPS-850 SPS-875 SPS-900
whereτois the pre-exponential factor andEmis the acti-vation energy of the relaxation process. The values ofEm are summarized in Table 1 and agree with the activation energy of the ionic conduction process in the low-temperature region. This agreement indicates that mo-bile Li+ ions are responsible for both the long-range transport and re-orientation relaxation process in the garnet materials.
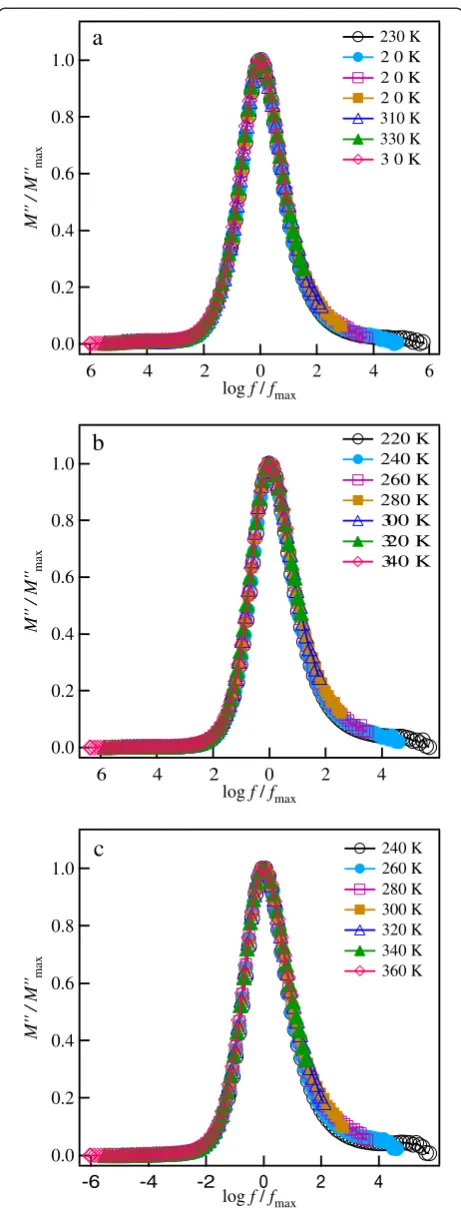
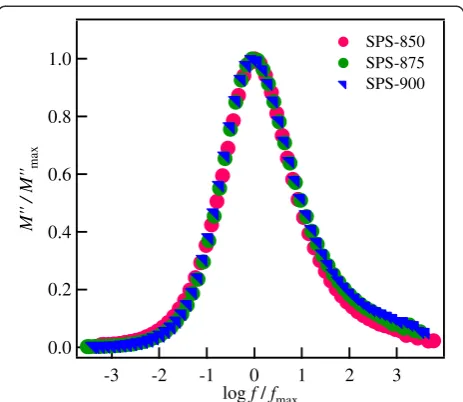
The modulus scaling of the investigated SPS garnets have been performed using M′′max andfmaxas the scaling parameters of the M′ and the frequency axes, respect-ively. The results of the scaling processes at different temperatures for the SPS LLT ceramics are shown in Figure 10. The modulus spectra at different tempera-tures are superimposed into a single master curve for each sample, indicating that the relaxation process is in-dependent of temperature. The full width at half max-imum (FWHM) has similar values of 1.77 decades for the SPS-850, SPS-875, and SPS-900 nanoceramics. These values are larger than that of the ideal Debye relaxation (FWHM of 1.14 decades, ref. [37]), which suggests a dis-tribution of relaxation times due to disordering nature in the current lithium garnet nanoceramics. Scaling of the modulus spectra of the different SPS ceramics together at different temperatures is shown in Figure 11. This figure shows that the modulus spectra of all the samples are merged into a single master curve, implying that the stud-ied materials exhibit similar relaxation processes.
Conclusions
The present study confirmed that spark plasma sintering is a powerful technique to fabricate nanoceramics of
different types of materials including lithium conducting garnets. Nanoceramics of Li5La3Ta2O12lithium conduct-ing garnets with grain size of 50 to 100 nm have been achieved by SPS experiments at 850°C, 875°C, and 900°C for a short dwelling time of 10 min. SPS-875 sample shows the highest ionic conductivity of 1.25 × 10⁻⁶S/cm at RT. The ionic conductivity exhibits two temperature regions with different activation energy, which suggests changing the conduction mechanism at high tempera-tures. The parameters that usually control the ionic con-duction, the concentration and mobility of mobile ions, have been estimated. The concentration of mobile Li+ ions is independent of temperature; therefore, the en-hanced conductivity is attributed to the enen-hanced mobil-ity of Li+ ions. The fraction of Li+ ions that is mobile and participates in the conduction process surprisingly represents a small percentage of only 3.9% out of the total density of Li content in the current LLT garnets. The relaxation processes in the SPS garnet nanoceramics are found to be independent of temperature, and the conduction and relaxation processes are thermally acti-vated by the same activation energy, which implies that Li+ ions are the origin of both the long-range transport as well as the short-range (local) reorientation relaxation in the garnet materials.
Competing interests
The author declares no competing interests.
Acknowledgements
The author acknowledges the financial support from King AbdulAziz City for Science and Technology (KACST) under grant No. ARP-30-109.
Received: 16 December 2014 Accepted: 21 January 2015
References
1. Thangadurai V, Kaack H, Weppner W. Novel fast lithium ion conduction in garnet-type Li5La3M2O12(M = Nb, Ta). J Am Ceram Soc. 2003;86:437–40.
2. Thangadurai V, Weppner W. Investigation on electrical conductivity and chemical compatibility between fast lithium ion conducting garnet-like Li6BaLa2Ta2O12and lithium battery cathodes. J Power Sources.
2005;142:339–44.
3. Thangadurai V, Weppner W. Li6ALa2Ta2O12(A = Sr, Ba): novel garnet-like
oxides for fast lithium ion conduction. Adv Funct Mater. 2005;15:107–12. 4. Murugan R, Thangadurai V, Weppner W. Effect of lithium ion content on the
lithium ion conductivity of the garnet-like structure Li5+xBaLa3Ta2O11.5+0.5x
(x = 0–2). Appl Phys A. 2008;91:615–20.
5. Murugan R, Thangadurai V, Weppner W. Lithium ion conductivity in Li5+xBaxLa3-xTa2O12(x = 0–2) with garnet-related structure in dependence
of the barium content. Ionics. 2007;13:195–203.
6. Murugan R, Thangadurai V, Weppner W. Lattice parameter and sintering temperature dependence of bulk and grain boundary conduction of garnet like solid Li electrolytes. J Electrochem Soc. 2008;155:A90–101.
7. Awaka J, Kijima N, Takahashi Y, Hayakawa H, Akimoto J. Synthesis and crystallographic studies of garnet-related lithium-ion conductors Li6CaLa
2-Ta2O12and Li6BaLa2Ta2O12. Solid State Ionics. 2009;180:602–6.
8. Zhong Y, Zhou Q, Guo Y, Li Z, Qiang Y. The ionic conductivity of Li6BaLa2M2O12with coexisting Nb and Ta on the M sites. Ionics.
2013;19:697–700.
9. Kokal I, Ramanujachary KV, Notten PHL, Hintzen HT. Sol–gel synthesis and lithium ion conduction properties of garnet-type Li6BaLa2Ta2O12. Mater Res
Bull. 2012;47:1932–5.
1.0
0.8
0.6
0.4
0.2
0.0
M'' / M''
max
3 2 1 0 -1 -2 -3
log f / fmax
[image:9.595.58.290.87.288.2]SPS-850 SPS-875 SPS-900
10. Baral AK, Narayanan S, Ramezanipour F, Thangadurai V. Evaluation of fundamental transport properties of Li-excess garnet-type Li5+2xLa3Ta2-xYxO12(x = 0.25, 0.5 and
0.75) electrolytes using ac impedance and dielectric spectroscopy. Phys Chem Chem Phys. 2014;16:11356–65.
11. Gao YX, Wang XP, Wang WG, Fang QF. Sol–gel synthesis and electrical properties of Li5La3Ta2O12lithium ionic conductors. Solid State Ionics.
2010;181:33–6.
12. Cussen EJ. The structure of lithium garnets: cation disorder and clustering in a new family of fast Li+conductors. Chem Commun. 2006;4:412–3.
13. O'Challaghan MP, Cussen EJ. Lithium dimer formation in the Li-conducting garnets Li5+xBaxLa3-xTa2O12(0 < x≤1.6). Chem Commun. 2007;20:2048–50.
14. Ruprecht B, Wilkening M, Steuernagel S, Heitjans P. Anion diffusivity in highly conductive nanocrystalline BaF2:CaF2composites prepared by
high-energy ball milling. J Mater Chem. 2008;18:5412–6.
15. Anselmi-Tamburini U, Maglia F, Chiodelli G, Tacca A, Spinolo G, Riello P, et al. Nanoscale effects on the ionic conductivity of highly doped bulk nanometric cerium oxide. Adv Funct Mater. 2006;16:2363–8. 16. Bellino MG, Lamas DG, de Rica NE W. A mechanism for the fast ionic
transport in nanostructured oxide-ion solid electrolytes. Adv Mater. 2006;18:3005–9.
17. Heitjans P, Masoud M, Feldhoff A, Wilkening M. NMR and impedance studies of nanocrystalline and amorphous ion conductors: Lithium niobate as a model system. Faraday Discuss. 2007;134:67–82.
18. Wilkening M, Epp V, Feldhoff A, Heitjans P. Tuning the Li diffusivity of poor ionic conductors by mechanical treatment: High Li conductivity of strongly defective LiTaO3nanoparticles. J Phys Chem C. 2008;112:9291–300.
19. Wilkening M, Kuhn A, Heitjans P. Mechanically induced decrease of the Li conductivity in an alumosilicate glass. Solid State Ionics. 2009;180:302–7. 20. Kali R, Mukhopadhyay A. Spark plasma sintered/synthesized dense and
nanostructured materials for solid-state Li-ion batteries: Overview and perspective. J Power Sources. 2014;247:920–31.
21. Kobayashi Y, Takeuchi T, Tabuchi M, Ado K, Kageyama H. Densification of LiTi2(PO4)3-based solid electrolytes by spark-plasma-sintering. J Power
Sources. 1999;81–82:853–8.
22. Chang CM, Hong SH, Park HM. Spark plasma sintering of Al substituted LiHf2(PO4)3solid electrolytes. Solid State Ionics. 2005;176:2583–7.
23. Mei A, Jiang QH, Lin YH, Nan CW. Lithium lanthanum titanium oxide solid-state electrolyte by spark plasma sintering. J Alloys Compd. 2009;486:871–5. 24. Gao YZ, Wang XP, Sun QX, Zhuang Z, Fang QF. Electrical properties of
garnet-like lithium ionic conductors Li5+xSrxLa3-xBi2O12fabricated by spark
plasma sintering method. Front Mater Sci. 2012;6:216–24. 25. Narayanan S, Epp V, Wilkening M, Thangadurai V. Macroscopic and
microscopic Li+transport parameters in cubic garnet-type‘Li
6.5La2.5Ba0.5ZrTaO12’
as probed by impedance spectroscopy and NMR. RSC Adv. 2012;2:2553–61. 26. Almond DP, Ducan GK, West AR. The determination of hopping rates and
carrier concentration in ionic conductors by a new analysis of ac conductivity. Solid State Ionics. 1983;8:159–64.
27. Ahmad MM, Yamada K. Hopping rates and concentrations of mobile fluoride ions in Pb1-xSnxF2solid solutions. J Chem Phys. 2007;127:124507.
28. Yamada K, Ahmad MM, Ogiso Y, Okuda T, Chikami J, Miehe G, et al. Two dimensional fluoride ion conductor RbSn2F5studied by impedance
spectroscopy and19F,119Sn, and87Rb NMR. Eur Phys J B. 2004;40:167–76. 29. Hairetdinov EF, Uvarov NF, Patel HK, Martin SW. Estimation of the
free-charge-carrier concentration in fast-ion conducting Na2S-B2S3glasses from
an analysis of the frequency-dependent conductivity. Phys Rev B. 1994;50:13259–66.
30. Ghosh A, Pan A. Scaling of the conductivity spectra in ionic glasses: dependence on the structure. Phys Rev Lett. 2000;84:2188–90.
31. Adams S, Rao RP. Ion transport and phase transition in Li1-xLa3(Zr2-xMx)O12
(M = Ta5+, Nb5+, x = 0, 0.25). J Mater Chem. 2012;22:1426–34.
32. Baek SW, Lee JM, Kim TY, Song MS, Park Y. Garnet related lithium ion conductor processed by spark plasma sintering for all solid state batteries. J Power Sources. 2014;249:197–206.
33. Ahmad MM. Enhanced lithium ionic conductivity and study of the relaxation and giant dielectric properties of spark plasma sintered Li5La3Nb2O12nanomaterials. Ceram Int. 2015;. doi:10.1016/j.
ceramint.2015.01.077.
34. Duluard S, Paillassa A, Puech L, Vinatier P, Turq V, Rozier P, et al. Lithium conducting solid electrolyte Li1.3Al0.3Ti1.7(PO4)3obtained via solution
chemistry. J Eur Ceram Soc. 2013;33:1145–53.
35. Hayamizu K, Aihara Y. Lithium ion diffusion in solid electrolyte (Li2S)7(P2S5)3
measured by pulsed-gradient spin-echo7Li NMR spectroscopy. Solid State Ionics. 2013;238:7–14.
36. Ahmad MM, Yamane Y, Yamada K, Tanaka S. Dielectric relaxation properties of Pb1-xSnxF2solid solutions prepared by mechanochemical milling. J Phys D:
Appl Phys. 2007;40:6020–5.
37. Losilla ER, Aranda MAG, Bruque S, Paris MA, Sanz J, West AR. Understanding Na mobility in NASICON materials: a Rietveld,23Na and31P MAS NMR, and impedance study. Chem Mater. 1998;10:665–73.
Submit your manuscript to a
journal and benefi t from:
7Convenient online submission
7Rigorous peer review
7Immediate publication on acceptance
7Open access: articles freely available online
7High visibility within the fi eld
7Retaining the copyright to your article