N A N O E X P R E S S
Open Access
Doping concentration dependence of
microstructure and magnetic behaviours in
Co-doped TiO
2
nanorods
Li-Ting Tseng, Xi Luo, Thiam Teck Tan, Sean Li and Jiabao Yi
*Abstract
Co-doped titanium dioxide (TiO2) nanorods with different doping concentrations were fabricated by a molten salt method. It is found that the morphology of TiO2changes from nanorods to nanoparticles with increasing doping concentration. The mechanism for the structure and phase evolution is investigated in detail. Undoped TiO2nanorods show strong ferromagnetism at room temperature, whereas incorporating of Co deteriorates the ferromagnetic ordering. X-ray photoelectron spectroscopy (XPS) and electron spin resonance (ESR) results demonstrate that the ferromagnetism is associated with Ti vacancy.
Keywords:TiO2; Nanorods; Ferromagnetism; Ti vacancy
Background
Titanium dioxide (TiO2) is one of the popular wide gap semiconductors that have attracted much attention for decades. It has three main different polymorphs: anatase, rutile and brookite, which lead to different physical and chemical properties affecting the performance of its ap-plications. Anatase TiO2 has been reported as a stable phase in photocatalyst applications [1]. Rutile TiO2 is a high temperature stable phase with a bandgap of ap-proximately 3.0 eV, which is slightly smaller than the an-atase phase (approximately 3.2 eV). Whereas, brookite phase is less stable compared to the other two crystal structures and can only be prepared under specific con-ditions [2]. TiO2has been extensively studied because of the variety in crystal structures and properties giving rise to its promising applications including photocatalyst, lithium electrode, sensors, solar cells and data storage technology as well as spintronic devices [3-8]. Nanostruc-tured TiO2is one of the most important categories in TiO2 for practical applications in photovoltaic, photocatalyst and supercapacitors, as well as batteries [9]. Nanostructured TiO2has been synthesized by many techniques, including hydrothermal method [10] and chemical vapour deposition method [11,12].
In order to modify the properties to meet the require-ments for certain applications, TiO2 is usually doped with a variety of elements, such as light elements (S, F or N), transition metals (Co, Ni, Fe) or rare earth ele-ments (Nd, Eu). It has been well known that doping with light element or rare earth element can eminently nar-row the bandgap, which will enhance photocatalyst and solar absorption properties [13,14]. The doping using transition metals may produce a new material, called di-luted magnetic semiconductor (DMS), which combines both magnetic and semiconducting behaviour. This ma-terial is promising for spintronic device applications, which can provide devices with high density, high cap-acity, high speed and multifunction using the dissipa-tionless spin current.
Co-doped TiO2 is the first oxide-based DMS that
shows room temperature ferromagnetism [15]. It has attracted wide interest due to its promising properties for spintronic devices. Most of the researches have
fo-cused on Co-doped TiO2 thin films, which were
com-monly prepared by pulsed laser deposition (PLD) and molecular beam epitaxy (MBE). Nanostructured diluted magnetic semiconductors have been paid much attention due to their unique properties, such as giant Zeeman split-ting and tuneable magnetic properties [16,17]. However, most of these investigations focus on nanoparticles [18] and only few studies worked on TiO2nanowires or nanorods * Correspondence:[email protected]
School of Materials Science and Engineering, University of New South Wales, Sydney, NSW 2052, Australia
[19-21]. It may be due to the difficulty for the control of shapes and sizes of TiO2nanowires or nanorods during the synthesis process as well as the low production yield. Although introducing dopants into TiO2in the nanostruc-tured state is still a challenge due to the self-purification effects, efforts have been made to fabricate TiO2 nano-rods/nanowires for its importance of the realization of microelectronic devices. Recently, Liu et al. synthesized transition-metal-doped TiO2 nanowires with large quan-tities and high quality using molten salt synthesis [22]. Molten salt synthesis is one of the promising methods to prepare ceramic powders, which is able to control the sample morphology and size. In addition, this method has the advantage to enhance the reaction of powder precur-sors [23]. They demonstrated the successful incorporation of transition metal ions into the TiO2lattice. It has been proven to be a very simple and economical method that can provide an effective way for fabricating high quality TiO2based DMS nanostructures.
In this work, rutile TiO2nanorods doped with various cobalt concentrations were synthesized using a molten salt method. The effects of doping concentration of Co on the microstructure and magnetic properties of
Co-doped TiO2DMS, as well as the formation mechanism
of TiO2 nanorods, were studied. The results revealed that Co concentration strongly affected the morphology of the nanostructures. TiO2nanorods were successfully grown under low Co-doping concentrations. As Co dop-ing increases, a small amount of cobalt oxide might precipitate, which is coated onto the surface of TiO2 nanostructures to restrain the formation of nanorods, resulting in the formation of nanoparticles. In addition, the incorporation of Co strongly suppresses the ferro-magnetic ordering, suggesting that the ferroferro-magnetic or-dering may not originate from Co doping. Detailed investigations indicate that the complex defects related to Ti vacancy are attributed to the ferromagnetism in the undoped TiO2nanostructures. The incorporation of Co during fabrication impedes the formation of complex defects, leading to the deterioration of ferromagnetic ordering.
Methods
Rutile TiO2 nanorods were synthesized using a molten
salt method. The powders of TiO2 (Aeroxide® P25,
mixed phases of anatase and rutile with a proportion of 80:20), Na2HPO4and NaCl with an impurity higher than 99% were mixed with a ratio of 1:1:4. The precursors were then ground with an alumina mortar. All the che-micals were purchased from Sigma-Aldrich, Castle Hill, NSW, Australia. The mixtures of the powders was placed into a crucible and heated to 1,098 K in a muffle furnace for 8 h. The product powders were washed with deionized water to remove NaCl and other impurities by
a centrifuge (Beckman Coulter Allegra X-30 Centrifuge (Beckman Coulter, Fullerton, CA, USA)). Then, the pow-der precipitates were washed by ethanol and placed steadily in the oven at 353 to 363 K for drying. Co3O4 powder was added into the mixture to make Co-doped TiO2nanorods with preset Co-doping concentrations of 0.5, 1, 3, 5 and 10 at%. Post-annealing was carried out at 773 K for 30 min under Ar atmosphere for all samples.
The crystal structures of powder samples were analysed by an X-ray diffractometery (XRD, PANalytical Xpert Mul-tipurpose X-ray Diffraction System (PANalytical, Almelo, The Netherlands), Cu Kα radiation). The morphology and structures of samples were examined by scanning electron microscopy (SEM, FEI Nova NanoSEM 230, Hillsboro, Oregon, USA) and transmission electron microscopy (TEM, Philips CM200, Hillsboro, Oregon, USA). Electronic structure and chemical compositions were characterized by X-ray photoelectron spectroscopy (XPS, ThermoScien-tific ESCALAB 250i X-ray Photoelectron Spectrometer (ThermoScientific, Waltham, MA, USA)) and inductively coupled plasma mass spectrometry (ICPMS, PerkinElmer quadrupole NexION ICP-MS (PerkinElmer, Melbourne, Victoria, Australia)), respectively. Superconducting quantum interference device (SQUID, Quantum design-XL-7, San Diego, CA, USA) was used for measuring magnetic hysteresis (M-H) loops with a maximum magnetic field of 2 Tesla at room temperature. Electron spin resonance (ESR) spectrum (Bruker EMX-plus X-Band ESR Spec-trometer (Bruker, Karlsruhe, Germany)) was taken for studying the magnetic behaviours.
[image:2.595.306.538.514.695.2]Results and discussion
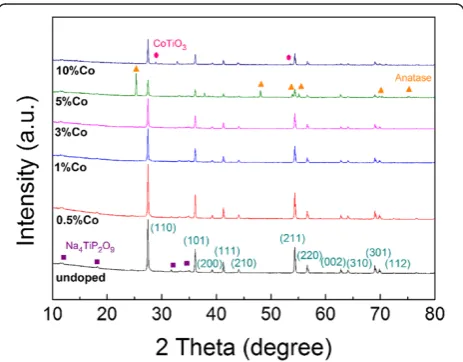
Figure 1 shows XRD results of undoped and Co-doped TiO2 nanorods with different doping concentrations. It
Figure 1XRD spectra of TiO2nanorods with various Co
concentrations.Pink circle: CoTiO3; orange triangle: anatase TiO2;
can be seen that only the rutile phase is identified in TiO2nanorods prepared with and without Co doping up to 3 at%. As the Co doping is increased to 5 at%, both the anatase and rutile phases were detected. Further increasing the Co doping to 10 at%, a secondary phase of CoTiO3is observed. It is also noted that monoclinic tetrasodium titanium nonaoxodiphosphate (Na4TiP2O9) is found in all the samples, which is an intermediate phase during the reaction process to facilitate the growth of rutile nanorods [22].
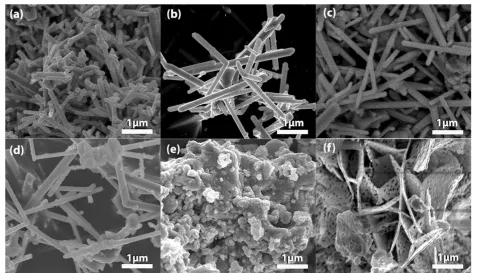
Figure 2 shows the SEM images of TiO2 nanorods
with and without Co doping, indicating that TiO2 nano-rods have been successfully synthesized. It appears that the undoped sample is relatively short in length com-pared with that of doped samples as shown in Figure 2a, b,c,d. This suggests that a small amount of Co doping facilitates TiO2nanorods growing along the [001] direc-tion. The diameter and length of the nanorods are in the range of 100 to 200 nm and 1 to 3μm, respectively. It can be seen from the images that the nanorods are thickened and nanoparticles are observed when the doping concentration of Co is increased to 3 at%. When the doping concentration of Co increases to 5 at%, the morphology changes from nanorods to nanoparticles, as seen in Figure 2e. Further increasing the doping concen-tration to 10 at%, the nanoparticles change to nanoflakes with mesoporous pores (Figure 2f ). From these results, it can be concluded that Co concentration plays an
important role in the growth process that affects both the phase transformation and particle shapes.
In the molten salt process, the formation of the nano-structures is highly related to relative dissolution rate of reactants [23]. If the dissolution rates of two reactants (i.e. TiO2 and Na4TiP2O9) are similar, both reactants would dissolve in the molten salt with the same rate and form the nanostructures once it reaches supersaturated condition. In this case, the nanostructured precipitation is based on homogeneous nucleation (Figure 3a). How-ever, in another scenario (Figure 3b), if the dissolution rate of one reactant is higher than the other, the reactant with a higher dissolution rate would be dissolved into the molten salt first and then the dissolved reactant would coat on the reactant with a lower dissolution rate, as shown in situation B, rather than diffuse homoge-neously into the reactant. Such a processing produces a core-shell structure. Then, the diffusion between two reac-tants takes place to form a product layer on the surface of the reactant as long as a sufficient amount of activation energy is provided. In contrary to situation A, the final product may not undergo the whole diffusion process, which affects its morphologies and compositions.
[image:3.595.59.538.441.714.2]In this work, the growth of TiO2nanorods is based on scenario B due to the different dissolution rate of TiO2 and Na4TiP2O9. P25 powders with particle sizes about 21 nm were used in our experiments, which contain both anatase and rutile phases. During the synthesis process,
dibasic sodium phosphate (DSP, Na2HPO4) decomposed to Na4P2O7+ H2O at approximately 473 K [24]. The com-pound of Na4P2O7 would react with anatase TiO2 (the metastable form of TiO2) to form an intermediate phase of Na4TiP2O9at 873 K that promotes the growth of rutile TiO2nanorods. The rutile phase in the precursors acts as the seeds to facilitate the heterogeneous nucleation and growth process [22]. Part of anatase TiO2 particles may undergo phase transformation to the rutile TiO2at high temperature. Rutile TiO2 particles do not react with Na2HPO4as both of them are thermodynamically stable at high temperature. Once the temperature reaches the melting point of salt (1,074 K), rutile TiO2and Na4TiP2O9 will dissolve into the salt solution. When the supersaturate state of the dissolved reactants is reached, precipitation occurs on rutile TiO2particles. The reactant with a higher dissolution rate, namely Na4TiP2O9, diffuses continuously
through the molten salt and reaches the surface of TiO2 precipitates to facilitate the growth process [23]. The rutile TiO2 precipitates start to grow along the direction of [001] with the lowest solid-liquid interfacial energy [25,26]. Finally, rutile TiO2 nanorods are obtained when both the reactants are completely consumed. A flow chart represents the reaction steps as sketched in Figure 4.
[image:4.595.57.540.90.228.2]For the sample doped with 5 at% Co, both anatase and rutile phases are observed and Na4TiP2O9 is also de-tected, which implies that anatase TiO2in P25 precursor may undergo both the reaction with Na4P2O7 and the phase transformation to rutile phase. It is well known that the impurity may significantly affect the phase transformation of TiO2[27]. As the Co doping increases to 5 at%, the high doping concentration of dopants may inhibit the transformation of the anatase TiO2into rutile phase [1]. On the other hand, Co atoms may form cobalt
Figure 3Growth mechanism of molten salt synthesis. (a)Solution-precipitation process and(b)solution-diffusion process (modified from [23]).
[image:4.595.56.543.502.720.2]oxide (CoO) that is coated onto the surface of TiO2 and Na4P2O7precipitates, thus suppressing the reaction between the anatase TiO2 and Na4P2O7. Consequently, the growth of nanorods is prohibited and nanoparticles are formed instead. When the Co doping reaches 10 at%, the relatively high Co content leads to the formation
of CoTiO3 secondary phase, as detected by XRD. The
morphology of TiO2then changes from nanoparticles to nanoflakes (Figure 2f ). The exact mechanism for the for-mation of nanoflakes is not clear. It may be related to the excess amount of Co and the formation of CoTiO3in the sample. It had been reported that the impurity phases may affect the shapes of nanostructures [1,28].
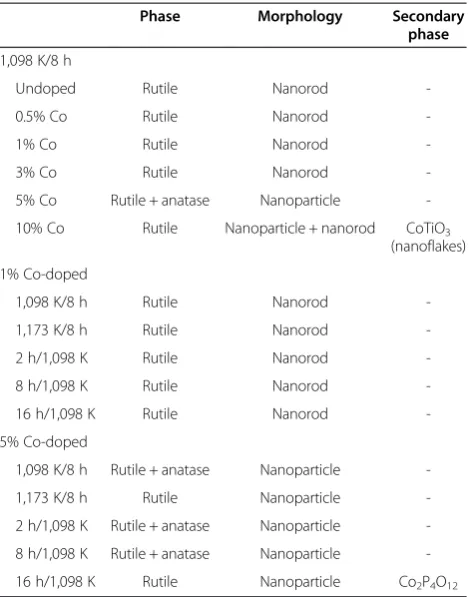
In order to further understand the formation mecha-nisms of TiO2 nanorods, the experiments with varied synthesis conditions, such as calcination temperatures (1,098 and 1,173 K with 8-h duration), heating duration (2, 8 and 16 h at 1,098 K) and NaCl/DSP ratio (90/10, 80/20 and 60/40 at 1,098 K for 8 h) were carried out. The results are summarized in Table 1. From the table, it can be seen that the samples doped with 1 at% Co are all grown to nanorods. It demonstrated that the heating duration and NaCl/DSP ratio have very limited influence on the shapes and sizes of nanorods. However, when the heating duration of 5 at% Co-doped sample is increased to 16 h, only the rutile phase exists and a strong peak of Co2P4O12 is detected by XRD, indicating that the Co dopants reacted with Na4P2O7 to form Co2P4O12 secondary phase, which suppressed the formation of Na4TiP2O9.
When the calcination temperature was raised to 1,173 K, the length of nanorods becomes longer than the sample calcinated at 1,098 K. Higher temperature gives rise to a higher solubility and diffusivity of reactants, which may ac-celerate the reaction rate, resulting in a larger dimension of nanorods. Moreover, it is noted that the anatase phase dis-appears when the calcination temperature reached 1,173 K. This may attribute to the higher activation energy at higher temperature, thus facilitating the phase transformation. For 5 at% Co-doped TiO2sample, no nanorods were observed by varying the synthesis parameters and the nanoparticles are the often-observed products.
Figure 5 shows TEM micrographs of TiO2 nanorods
with different doping concentrations. All the samples grow along [001] direction, as shown in Figure 5a,b,c,d. High resolution TEM images and the selected area elec-tron diffraction (SAED) patterns shown in the insets re-veal the single crystal structure of the nanorods, indicating that there is no significant influence of Co doping on the crystallization processes.
The d spacings of lattice planes of the rutile TiO2 nano-rod are measured to be approximately d001= 3.05 Å, d110= 3.37 Å and d101= 2.55 Å, which agrees well with the re-ported results [22]. The nanorods were grown along the
c-axis with the lowest solid-liquid interfacial free energy that was not affected by the presence of Co. This result is consistent with that reported by Liu et al. [22]. The inset in the bottom of Figure 5d shows the morphologies of nano-particles for 5 at% Co-doped TiO2, which is in consistence with that observed by SEM.
[image:5.595.305.540.99.398.2]For the composition of the nanostructures, inductively coupled plasma (ICP) analysis indicates that the Co-doping concentration is very close to the nominal concen-tration. However, chemical composition analysed by XPS shows a much higher Co concentration than that obtained by ICP. These results imply that Co may mainly segregate on the surface of TiO2nanorods due to the nature of the surface sensitivity of XPS. XPS spectra of Ti 2p edge are shown in Figure 6a. Ti 2p3/2and Ti 2p1/2 peaks are de-tected at 457.74 to 458.98 eV and 463.37 to 463.71 eV, re-spectively, which belongs to Ti4+. The separation of Ti 2p peaks (ΔTi 2p) is a characteristic to identify the crystal structure of TiO2. A ΔTi 2p value of 5.77 eV represents Ti-O bonding in rutile TiO2[29,30], which is correspond-ing to the spectra of undoped and 1% Co-doped samples. Peak shifts can be observed in the samples doped with 3 and 5 at% Co, whereΔTi 2p decreases to 5.73 and 5.66 eV, respectively. The peak shift implies the existence of the anatase phase in the samples. Therefore, there might be a small amount of anatase TiO2present in 3 at% Co-doped Table 1 Summary of sample morphologies
Phase Morphology Secondary phase
1,098 K/8 h
Undoped Rutile Nanorod
-0.5% Co Rutile Nanorod
-1% Co Rutile Nanorod
-3% Co Rutile Nanorod
-5% Co Rutile + anatase Nanoparticle
-10% Co Rutile Nanoparticle + nanorod CoTiO3 (nanoflakes)
1% Co-doped
1,098 K/8 h Rutile Nanorod
-1,173 K/8 h Rutile Nanorod
-2 h/1,098 K Rutile Nanorod
-8 h/1,09-8 K Rutile Nanorod
-16 h/1,098 K Rutile Nanorod
-5% Co-doped
1,098 K/8 h Rutile + anatase Nanoparticle
-1,173 K/8 h Rutile Nanoparticle
-2 h/1,098 K Rutile + anatase Nanoparticle
-8 h/1,09-8 K Rutile + anatase Nanoparticle
Figure 5High resolution TEM images of TiO2nanorods. (a)undoped,(b)0.5,(c)1 and(d)3 at% Co. The insets in the images are nanorods
at low magnification (scale bar = 100 nm) and SAED patterns. The inset in (d) at the right bottom is the TEM image of 5 at% Co-doped TiO2nanoparticles.
[image:6.595.56.541.472.719.2]sample that cannot be detected by XRD. Two main peaks of Co 2p3/2 and Co 2p1/2 are observed at 781.01 to 781.24 eV and 796.97 to 797.33 eV, respectively, in Co 2p spectra (Figure 6b), followed by two satellite peaks at approximately 786 eV and 803 eV, respectively. The separation of Co 2p3/2 and Co 2p1/2 indicates that the valence state of Co is 2+. The spin-orbit splitting in our samples is approximately 16 eV, which is inconsistent with that reported in [31-34]. O 1 s is not shown here because of the presence of multioxide compounds in the samples.
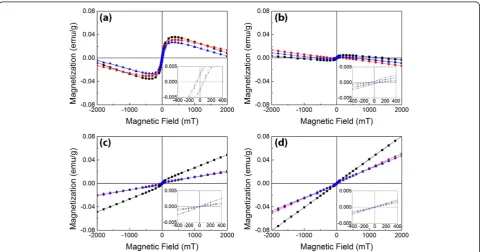
Figure 7 shows room temperature M-H loops of TiO2 nanorods doped with different Co concentrations before and after annealing. The magnetic properties of the sam-ples doped with 5 and 10 at% Co are not shown here because of the complexity of polymorphic TiO2phases and the presence of CoTiO3 secondary phase. For the as-prepared nanorods, relative strong ferromagnetism can be observed in undoped and 0.5 at% Co-doped nanorods. In addition, diamagnetism can also be seen, suggesting not fully magnetic phases in the samples, which may be associated with the aforementioned residual reactants and reaction intermediates, i.e. Na4TiP2O9. For 1 and 3 at% Co-doped TiO2, the long-range ferromagnetic ordering no longer exists but antiferromagnetism or para-magnetism takes place.
The insets in Figure 7 show the magnification of the M-H curves in the central area. The coercivity shown
for the undoped and 0.5 at% Co-doped TiO2 nanorods
confirms the ferromagnetic ordering. Whereas, there is no coercivity observed in 1 and 3 at% Co-doped TiO2 samples, suggesting that Co doping may deteriorate long-range magnetic ordering. The XPS results suggest that Co ions do not incorporate into the TiO2lattice but coat on the surface of the samples in the form of CoO, which could be in amorphous phase or with the small amount that cannot be detected by XRD. It is well known that CoO is an antiferromagnetic material [35]. In Co-doped TiO2sample, surface segregation of CoO on TiO2 nanorods shows paramagnetism or antiferromagnetism, which leads to the decrease in ferromagnetism.
[image:7.595.58.539.453.705.2]It is interesting to note that the undoped TiO2 nano-rods have the strongest ferromagnetism among all the samples, suggesting that Co doping is not the origin of ferromagnetism. The origin of weak ferromagnetism ob-served in the undoped TiO2has been widely discovered and could be owing to the presence of intrinsic point de-fects, such as oxygen vacancy [36], Ti vacancy [37-40] or Ti3+ [41]. However, Ti3+ is not detected in XPS Ti 2p spectra (Figure 6a) and is more likely to form antiferro-magnetic coupling [42]. Therefore, the ferromagnetism may possibly come from Ti vacancy or oxygen vacancy. In order to understand the origin of ferromagnetism, post-annealing of the nanorods was carried out at 773 K under Ar and oxygen atmospheres with the same gas flow rate to create oxygdeficient and oxygrich en-vironment, respectively. According to the SQUID meas-urement (Figure 7), there is not much difference on the
Figure 7Room temperature hysteresis loop of TiO2nanorods with various Co concentrations. (a)Undoped,(b)0.5,(c)1 and(d)3 at%
magnetization in the undoped sample after annealing in different ambient. It is also noted that ferromagnetism is absent in the 0.5 at% Co-doped sample, and ferromag-netic ordering cannot be observed in 1 and 3 at% Co-doped samples.
In order to understand the mechanism of ferromag-netism in the Co-doped TiO2system, we performed ESR measurements, as shown in Figure 8. For the
as-prepared samples, the undoped TiO2 and 0.5 at%
Co-doped TiO2 have similar ESR spectra. The electron g factors are calculated from g¼βhHν
O, where h is the
Planck constant (4.135 × 10⁻¹⁵ eV s), ν is the frequency (9.8 GHz),βis the Bohr magneton (5.788 × 10⁻⁵eV∙T−1) and Ho is the resonance magnetic field [43]. A strong resonance at around g= 2.84 and g= 2.51 is observed (Figure 8a). The ESR spectra in the whole magnetic field range are non-symmetric, which suggest ferromagnetic ordering [44,45]. For 1 and 3 at% Co-doped TiO2, strong paramagnetic resonance peak at g= 2.16 is observed, which is associated with the coupling of doped Co ions and oxygen vacancies [46]. This suggests that oxygen va-cancy does not contribute to the ferromagnetic ordering in our samples. When the samples were performed post-annealing, the ESR spectra of all the samples change sig-nificantly (Figure 8b,c). For the undoped sample, the spectrum is still unsymmetrical and the resonance peak atg= 2.84 remains unchanged, while the resonance peak does not appear in the other three samples. The peak at
[image:8.595.56.538.455.705.2]g= 2.51 has also been reported by Guskos et al. [47]. However, there is no discussion or explanation on the origin of this peak. From Figure 8b, we can also see that free ions initiated from oxygen vacancy (g= 2.0) are de-tected. Such free ions may be attributed to the single electron trapped in an oxygen vacancy site [48,49]. In addition, we also observe Ti3+ in all the post-annealed samples due to the resonance peak at 1.91 [50]. The free ions of oxygen vacancy and Ti3+observed in all the sam-ples confirm that oxygen vacancy and Ti3+ are not the origin of ferromagnetism. It is noted that a strong reson-ance atg= 4.3 is detected for all the samples. It has been observed in commercial nanostructured TiO2 powders, which may be related to disordering or surface defects of nanostructured TiO2 [51]. In Figure 8c, the peak related to surface defects (g= 4.3) can no longer be observed when the samples are annealed under oxygen atmosphere. The resonance at g= 2.24 is observed in the Co-doped samples, which is associated with Co ions combined with oxygen vacancies [46]. It has been known that an oxygen-rich environment is beneficial to the formation of Ti va-cancy. However, the annealing conditions carried out in our work may not be able to create a sufficient amount of Ti vacancy due to its high formation energy. From Figure 8, it can be concluded that the ferromagnetic order-ing is related to the resonance peak atg= 2.84, though the peak has not been reported before.
ESR results have suggested that Ti vacancies and cor-related complex defects may be the origin of ferromag-netism. It is known that the formation energy of Ti vacancy is quite high [52]. For the undoped samples, Ti vacancies may be able to form due to the high calcin-ation temperature. The sufficient oxygen partial pressure during synthesis may facilitate the creation of Ti vacan-cies. Co doping has strong influence of the synthesis process. The Co oxide coated on the surface of TiO2 nanoparticles may impede the formation of Ti vacancies. When the sample is performed with annealing under an oxygen-deficient environment, some amount of oxygen vacancies is formed, which may recombine with Ti va-cancies. Hence, the ferromagnetism decreases.
Conclusions
Rutile TiO2nanorods have been successfully synthesized using molten salt method. Our results show that Co doping has strongly affected the morphology and phase transformation of TiO2 nanorods. A high doping con-centration of Co (5 at%) results in the formation of nanoparticles rather than nanorods. By changing the growth conditions, the experimental results demonstrate that the calcination temperature is the dominant to con-trol the sizes of nanorods not the amount of salt and heating duration.
Magnetic properties were investigated by SQUID and ESR measurements. As-prepared TiO2nanorods without Co doping show weak ferromagnetism at room temperature. As the Co doping increased, the ferromagnetic ordering is weakened. The nanorods show paramagnetism or antifer-romagnetism when the Co-doping concentration is be-yond 1 at%. These results imply that the ferromagnetism may originate from the intrinsic point defects in the mate-rials instead of Co doping. Detailed study by ESR indicates that the ferromagnetism is correlated to the Ti vacancy.
Abbreviations
DMS:diluted magnetic semiconductor; DSP: dibasic sodium phosphate; ESR: electron spin resonance; ICPMS: inductively coupled plasma mass spectrometry; MBE: molecular beam epitaxy; PLD: pulsed laser deposition; SAED: selected area electron diffraction; SEM: scanning electron microscopy; SQUID: superconducting quantum interference device; TEM: transmission electron microscopy; XRD: X-ray diffractometery; XPS: X-ray photoelectron spectroscopy.
Competing interests
The authors declare that they have no competing interests.
Authors' contributions
LTT carried out the sample preparation, experimental measurements and drafted the manuscript. XL performed the ESR measurement. TTT carried out the SQUID measurement. SL participated in the manuscript revision. JBY conceived the work, supervised the experiments and revised the manuscript. All authors read and approved the final manuscript.
Acknowledgements
This work is funded by the Australia Research Council discovery project DP110105338, DP140103041 and Queen Elizabeth II fellowship.
Received: 21 October 2014 Accepted: 5 December 2014 Published: 12 December 2014
References
1. Hanaor DH, Sorrell C:Review of the anatase to rutile phase transformation.J Mater Sci2011,46:855–874.
2. Beltrán A, Gracia L, Andrés J:Density functional theory study of the brookite surfaces and phase transitions between natural titania polymorphs.J Phys Chem B2006,110:23417–23423.
3. Formo E, Lee E, Campbell D, Xia Y:Functionalization of electrospun TiO2 nanofibers with Pt nanoparticles and nanowires for catalytic applications.Nano Lett2008,8:668–672.
4. Crossland EJW, Noel N, Sivaram V, Leijtens T, Alexander-Webber JA, Snaith HJ:Mesoporous TiO2single crystals delivering enhanced mobility and optoelectronic device performance.Nature2013,495:215–219. 5. Wu QL, Li J, Deshpande RD, Subramanian N, Rankin SE, Yang F, Cheng Y-T:
Aligned TiO2nanotube arrays as durable lithium-ion battery negative electrodes.J Phys Chem C2012,116:18669–18677.
6. Kazuhito H, Hiroshi I, Fujishima A:TiO2photocatalysis: a historical overview and future prospects.Jpn J Appl Phys2005,44:8269.
7. Gao M, Xu Y, Bai Y, Xiao F:Nb, F-codoped TiO2hollow spheres with high visible light photocatalytic activity.Nanoscale Res Lett2013,8:508. 8. Tsai J, Hsu W, Wu T, Meen T, Chong W:Effect of compressed TiO2
nanoparticle thin film thickness on the performance of dye-sensitized solar cells.Nanoscale Res Lett2013,8:459.
9. Plylahan N, Kyeremateng N, Eyraud M, Dumur F, Martinez H, Santinacci L, Knauth P, Djenizian T:Highly conformal electrodeposition of copolymer electrolytes into titania nanotubes for 3D Li-ion batteries.Nanoscale Res Lett2012,7:349.
10. Zhang YX, Li GH, Jin YX, Zhang Y, Zhang J, Zhang LD:Hydrothermal synthesis and photoluminescence of TiO2nanowires.Chem Phys Lett2002,365:300–304.
11. Wang X, Li Z, Shi J, Yu Y:One-dimensional titanium dioxide nanomaterials: nanowires, nanorods, and nanobelts.Chem Rev2014,114:9346–9384. 12. Jong-Yoon Ha BDS, Liwei L, Dong Heon K, Albert V:Davydov: patterned
growth of TiO2nanowires on titanium substrates.Appl Phys Express2011, 4:065002.
13. Zhang M, Yu X, Lu D, Yang J:Facile synthesis and enhanced visible light photocatalytic activity of N and Zr co-doped TiO2nanostructures from nanotubular titanic acid precursors.Nanoscale Res Lett2013,8:543. 14. Reszczyńska J, Grzyb T, Sobczak JW, Lisowski W, Gazda M, Ohtani B, Zaleska A:
Lanthanide co-doped TiO2: the effect of metal type and amount on surface properties and photocatalytic activity.Appl Surf Sci2014,307:333–345. 15. Matsumoto Y, Murakami M, Shono T, Hasegawa T, Fukumura T, Kawasaki M,
Ahmet P, Chikyow T, Koshihara S-y, Koinuma H:Room-temperature ferromagnetism in transparent transition metal-doped titanium dioxide.
Science2001,291:854–856.
16. Bussian DA, Crooker SA, Yin M, Brynda M, Efros AL, Klimov VI:Tunable magnetic exchange interactions in manganese-doped inverted core-shell ZnSe-CdSe nanocrystals.Nat Mater2009,8:35–40.
17. Yu JH, Liu X, Kweon KE, Joo J, Park J, Ko K-T, Lee DW, Shen S, Tivakornsasi-thorn K, Son JS, Park JH, Kim YW, Hwang GS, Dobrowolska M, Furdyna JK, Hyeon T:Giant Zeeman splitting in nucleation-controlled doped CdSe: Mn2+quantum nanoribbons.Nat Mater2010,9:47–53.
18. Jiang BZ, Phan TL, Yang DS, Lee KW, Yu SC:Magnetism in Co-doped rutile TiO2nanoparticles.Solid State Commun2010,150:1932–1935.
19. Melghit K, Bouziane K:Room temperature ferromagnetism of iron-doped rutile TiO2nanorods synthesized by a low temperature method.J Alloys Compounds2008,453:102–107.
20. Patel SKS, Gajbhiye NS, Date SK:Ferromagnetism of Mn-doped TiO2 nanorods synthesized by hydrothermal method.J Alloys Compounds
2011,509(Supplement 1):S427–S430.
21. Patel SKS, Gajbhiye NS:Room temperature magnetic properties of Cu-doped titanate, TiO2(B) and anatase nanorods synthesized by hydrothermal method. Mater Chem Phys2012,132:175–179.
22. Liu B, Chen HM, Liu C, Andrews SC, Hahn C, Yang P:Large-scale synthesis of transition-metal-doped TiO2nanowires with controllable
overpotential.J Am Chem Soc2013,135:9995–9998.
23. Kimura T:Molten salt synthesis of ceramic powders.InAdvances in Ceramics - Synthesis and Characterization, Processing and Specific Applications.
24. Roy B, Ahrenkiel SP, Fuierer PA:Controlling the size and morphology of TiO2powder by molten and solid salt synthesis.J Am Ceramic Soc2008, 91:2455–2463.
25. Ramamoorthy M, Vanderbilt D, King-Smith RD:First-principles calculations of the energetics of stoichiometric TiO2surfaces.Phys Rev B1994, 49:16721–16727.
26. Oliver PM, Watson GW, Toby Kelsey E, Parker SC:Atomistic simulation of the surface structure of the TiO2polymorphs rutile and anatase.J Mater Chem1997,7:563–568.
27. Barakat MA, Hayes GS, Ismat S:Effect of cobalt doping on the phase transformation of TiO2nanoparticles.J Nanosci Nanotech2005,X:1–7.
28. Riyas S, Krishnan G, Das PNM:Anatase–rutile transformation in doped titania under argon and hydrogen atmospheres.Adv Appl Ceramics2007,
106:255–264.
29. Biesinger MC, Payne BP, Hart BR, Grosvenor AP, McIntryre NS, Lau LWM, Smart RSC:Quantitative chemical state XPS analysis of first row transition metals, oxides and hydroxides.J Phys2008,100:012025.
30. Biesinger MC, Lau LWM, Gerson AR, Smart RSC:Resolving surface chemical states in XPS analysis of first row transition metals, oxides and hydroxides: Sc, Ti, V, Cu and Zn.Appl Surf Sci2010,257:887–898. 31. Biesinger MC, Payne BP, Grosvenor AP, Lau LWM, Gerson AR, Smart RSC:
Resolving surface chemical states in XPS analysis of first row transition metals, oxides and hydroxides: Cr, Mn, Fe, Co and Ni.Appl Surf Sci2011,
257:2717–2730.
32. Gong B, Luo X, Bao N, Ding J, Li S, Yi J:XPS study of cobalt doped TiO2 films prepared by pulsed laser deposition.Surf Interface Anal2014,
46:1043–1046.
33. Riva R, Miessner H, Vitali R, Del Piero G:Metal–support interaction in Co/SiO2 and Co/TiO2.Appl Cata A2000,196:111–123.
34. Towle SN, Bargar JR, Brown GE Jr, Parks GA:Surface precipitation of Co(II) (aq) on Al2O3.J Colloid Interface Sci1997,187:62–82.
35. Jauch W, Reehuis M:Electron density distribution in paramagnetic and antiferromagnetic CoO: aγ-ray diffraction study.Phys Rev B2002,
65:125111.
36. Batakrushna S, Giri PK, Soumen D, Kenji I, Fujii M:Oxygen vacancy-mediated enhanced ferromagnetism in undoped and Fe-doped TiO2nanoribbons. J Phys D Appl Phys2014,47:235304.
37. Bai Y, Chen Q:First principle study of the cation vacancy in anatase TiO2. Physica Status Solidi (RRL) Rapid Res Lett2008,2:25–27.
38. Zhang S, Ogale SB, Yu W, Gao X, Liu T, Ghosh S, Das GP, Wee ATS, Greene RL, Venkatesan T:Electronic manifestation of cation-vacancy-induced magnetic moments in a transparent oxide semiconductor: anatase Nb: TiO2.Adv Mater2009,21:2282–2287.
39. Bao NN, Fan HM, Ding J, Yi JB:Room temperature ferromagnetism in N-doped rutile TiO2films.J Appl Phys2011,109:07C302.
40. Bao NN, Yi JB, Fan HM, Qin XB, Zhang P, Wang BY, Ding J, Li S: Vacancy-induced room-temperature ferromagnetism in Ga–TiO2.Scripta Materialia
2012,66:821–824.
41. Zhou S,Čižmár E, Potzger K, Krause M, Talut G, Helm M, Fassbender J, Zvyagin SA, Wosnitza J, Schmidt H:Origin of magnetic moments in defective TiO2single crystals.Phys Rev B2009,79:113201.
42. Yang K, Dai Y, Huang B, Feng YP:Density-functional characterization of antiferromagnetism in oxygen-deficient anatase and rutile TiO2. Phys Rev B2010,81:033202.
43. Yang G, Gao D, Zhang J, Zhang J, Shi Z, Xue D:Evidence of vacancy-induced room temperature ferromagnetism in amorphous and crystalline Al2O3 nanoparticles.J Phys Chem C2011,115:16814–16818.
44. Ma YW, Lu YH, Yi JB, Feng YP, Herng TS, Liu X, Gao DQ, Xue DS, Xue JM, Ouyang JY, Ding J:Room temperature ferromagnetism in Teflon due to carbon dangling bonds.Nat Commun2012,3:727.
45. Gao D, Si M, Li J, Zhang J, Zhang Z, Yang Z, Xue D:Ferromagnetism in freestanding MoS2nanosheets.Nanoscale Res Lett2013,8:129.
46. Miyako Y, Kazumata Y:Electron spin resonance on rutile TiO2with cobalt ions combined with oxygen vacancies.J Phys Soci Japan1971,31:1727–1731. 47. Guskos N, Guskos A, Typek J, Berczynski P, Dolat D, Grzmil B, Morawski A:
Influence of annealing and rinsing on magnetic and photocatalytic properties of TiO2.Mater Sci Eng B2012,177:223–227.
48. Zhang S, Li W, Jin Z, Yang J, Zhang J, Du Z, Zhang Z:Study on ESR and inter-related properties of vacuum-dehydrated nanotubed titanic acid.
J Solid State Chem2004,177:1365–1371.
49. Sterrer M, Fischbach E, Risse T, Freund H-J:Geometric characterization of a singly charged oxygen vacancy on a single-crystalline MgO(001) film by electron paramagnetic resonance spectroscopy.Phys Rev Lett2005,
94:186101.
50. Chong SV, Kadowaki K, Xia J, Idriss H:Interesting magnetic behavior from reduced titanium dioxide nanobelts.Appl Phys Lett2008,92:232502. 51. Kheamrutai T, Weeranut K, Limsuwan P:Application of ESR technique to
distinguish the phase and size of TiO2powders.J Electronic Sci Tech China
2010,8:31–34.
52. Ghosh S, Khan GG, Mandal K, Samanta A, Nambissan PMG:Evolution of vacancy-type defects, phase transition, and intrinsic ferromagnetism during annealing of nanocrystalline TiO2studied by positron annihilation spectroscopy.J Phys Chem C2013,117:8458–8467.
doi:10.1186/1556-276X-9-673
Cite this article as:Tsenget al.:Doping concentration dependence of microstructure and magnetic behaviours in Co-doped TiO2nanorods. Nanoscale Research Letters20149:673.
Submit your manuscript to a
journal and benefi t from:
7Convenient online submission
7Rigorous peer review
7Immediate publication on acceptance
7Open access: articles freely available online
7High visibility within the fi eld
7Retaining the copyright to your article
![Figure 3 Growth mechanism of molten salt synthesis. (a) Solution-precipitation process and (b) solution-diffusion process (modifiedfrom [23]).](https://thumb-us.123doks.com/thumbv2/123dok_us/8863514.939228/4.595.56.543.502.720/figure-mechanism-synthesis-solution-precipitation-solution-diffusion-modifiedfrom.webp)