© 2017, IRJET | Impact Factor value: 5.181 | ISO 9001:2008 Certified Journal | Page 2096
Prediction of noise levels using FHWA Model for National highway 150
A (NH 150-A)
Sagar Pashupatihal, Sneha R, Sumanth K
1
(Dept. of Environmental Engineering, Manipal Institute of Technology, Manipal, India)
2
(Dept. of Civil Engineering, Manipal Institute of Technology, Manipal, India)
3
(Senior highway Engineer, C V Kand Consultants Pvt. Ltd, Bengaluru, India)
---***---Abstract -
Population growth and development of activitiesin cities have a great influence on the development of transportation sector. The high growth rate of private vehicles is mainly due to increase in the population. This condition has enlarged environmental degradation, not only in terms of fuel consumption but also in terms of air pollution and traffic noise generated by vehicles. Noise generated by traffic is having many adverse effects such as increase of stress, sleep disturbance, communication difficulty and also hearing problem. In order to overcome these problems, it is required to estimate the level of traffic noise produced by traffic volume and average speed of the vehicles. In the present work, the traffic noise along a highway corridor on NH-150A passing through Nanjanagudu city of Mysuru district has been considered and two sampling stations were held, One at Nanjanagudu and the other at Mahadeva Nagar and Noise monitoring was done through noise level meters. The traffic noise prediction for the year 2027 and 2037 is done with the help of Federal Highway Administration (FHWA) model using the traffic volume and speed data recorded at those two sampling stations. The analysis of data has shown that the observed noise levels along a highway corridor NH 150a in the year 2027 and 2037 are alarmingly high.
Key Words: FHWA Model, Noise modeling, Traffic noise
prediction, NH-150 a, Nanjanagudu, Mahadeva Nagar and noise monitoring.
1. INTRODUCTION
Roadway noise is the collective sound energy originating from motor vehicles. It consists mainly of road surface, tire, engine/transmission, aerodynamic, and decelerating elements. Tire pavement noise is found to be the major contributor of highway noise. Traffic operations noise is affected expressively by vehicle speeds, since sound energy unevenly doubles for each increment of ten miles an hour in vehicle velocity; an exception to this rule occurs at very low speeds where decelerating and acceleration noise dominate over aerodynamic noise. Many cities have faced problems of increasing use of motor vehicles. High use of motor vehicles has increased environmental problems such as air pollution and traffic noise. Continuous exposure to unacceptable noise levels may lead to the environmental problems which might affect quality of life of the residents such as depression, sleep
disturbance, annoyance, poor working efficiency and adverse health effects. Road traffic noise is one of the main environmental problem that has been experienced by residents in many cities in the world. The growth proportion of motor vehicles is at the rate of 10 percent per year. This high increase in motor vehicles ownership has increased environmental problems such as air pollution and noise level. The contribution of highway noise is 70%, airway contributes 20% and railway contributes about 10% to overall traffic noise. There is mixed traffic on most of the Indian highways with a wide variation in traffic volume, speed and other road and traffic related parameters. Traffic noise prediction is done with the help of Federal Highway Administration Model (FHWA Model) using traffic volume and speed recorded at several samplings stations and the FHWA model is found to be applicable for the prediction of traffic noise in India with some degree of accuracy. The enormous progress in the Road Transportation Division in India has been a key element in the economic development In India; the national highways are the primary long-distance roadways. They are upheld by the Central Government, and the majority is two-lane. India has a large road network of over 3.314 million kilometers of roadways (2.1 million miles), which makes it a country with the third largest road network in the world.
2. FHWA Model
Federal Highway Administration (FHWA) was used to develop Ldn contours for all highways and major roadways in all over the world. The FHWA Model is the analytical method presently preferred for traffic noise prediction by most state and local agencies.
© 2017, IRJET | Impact Factor value: 5.181 | ISO 9001:2008 Certified Journal | Page 2097
noise, including the design of efficient, cost-effective highwaynoise barriers.
2.1 Modeling Components of FHWA
1. Five standard vehicle types, as well as user defined vehicles.
2. Constant-flow and interrupted-flow traffic.
3. Effects of different pavement types and graded roadways.
4. Sound-level computations based on a one-third octave-band database and one-third octave-octave-band
algorithms.
5. Graphically interactive noise barrier design optimization.
6. Attenuation over/through rows of buildings and dense vegetation.
7. Multiple diffraction analyses. 8. Contour analyses.
9. Parallel barrier analyses.
2.2 Data’s needed for modeling
1. First thing is to collect the traffic volume details of the study area by conducting traffic surveys
2. Proper road alignment should be known such as width of the road, type of road, Number of lanes etc.
3. Some meteorological details like temperature & humidity should be collected.
4. During Noise monitoring, the distance of the monitoring station should be calculated from the project road.
5. During Noise monitoring the number of dwelling units at the monitoring station should be Known.
6. AutoCAD drawing of road alignment for project road should be drawn and it should be converted into DXF format. So, that it would be helpful to import the drawing into the software for locating various things like noise monitoring stations, barriers, buildings, terrain lines etc.
7. The traffic data collected should be forecasted for the respective study years.
2.3 Procedure to use TNM 2.5 Software
1. First thing is to import the alignment drawing from AutoCAD in DXF format.
2. If there is no AutoCAD file for alignment of road, proper coordinates can be put so as to generate the alignment of road.
3. In the main screen of the software there is a menu bar it includes File, edit, view, setup, input, calculate, barrier analysis, tables etc. In the main screen, we can also see Tool bar. The Tool Bar provides quick access to editing and zoom features, as well as input objects.
4. So the data what we have collected should be incorporated into the input bar, the input bar contains Roadways, receivers, barriers, building rows, terrain lines, contour zones.
5. In the roadway option, coordinates of road alignment should be put. In the same option, we have traffic tab, traffic volume details and the speed of the respective given vehicles should be inputted.
6. In the input bar immediately after Roadway there is Receiver option. The coordinates of the Receiver points of the study area should be incorporated.
7. After Receiver option there is a barrier design, Building rows, Terrain lines. Similarly, the collected data have to be inputted into the respective options too.
8. Periodic input checks are desirable, because they catch potential input misunderstandings before we progress through all our input. So, there is option called as input check in the input bar.
9. TNM computations are complex and time-consuming, select Calculate after all input items have been entered and verified. When Calculate is selected, TNM automatically performs a final Input Check. TNM then calculates predicted noise levels at all receivers through a series of modifications to a reference sound level. These modifications account for the following sound propagation factors: divergence; atmospheric absorption; ground characteristics and topography; barriers; rows of buildings; and
areas of heavy vegetation. The reference sound level is based upon vehicle noise emission levels contained within the TNM Data Base.
10.The results of the obtained noise levels will be in the tables menu.
3. Study area
© 2017, IRJET | Impact Factor value: 5.181 | ISO 9001:2008 Certified Journal | Page 2098
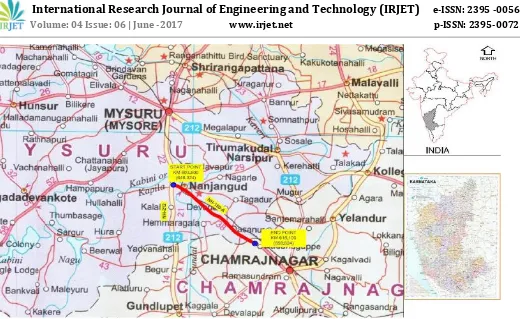
Fig. 1. Project Road Nanjanagudu to ChamarajnagNH150-AThe project road from Nanjanagudu to Chamarajanagar, is a part of NH-150A, lies in the Southernmost part of Karnataka and provides vital intrastate connectivity between Southern districts and northern districts in Karnataka. Nanjanagudu is famous for Srikanteshwara Temple and is also called as "Dakshina Kashi". Project road (NH-150A) starts at Km 603.600 (New Chainage Km 646.324) the intersection of NH-212 and Railway level crossing near Sujathapuram and ends at Km 616.100 (New Chainage Km 658.824) near Badnavalu village. The length of the project road is 12.500 Kms. Project road mainly caters to traffic arriving from National Highway – 212 (from Mysore and nearby villages) to Srikanteshwara Temple at Nanjangud, Chamarajanagar and other villages apart from catering to the commuting needs of local traffic. Traffic on the project road comprises both passenger and freight vehicles. The existing road network and road condition is inadequate. It is deficient to cater to the normal traffic and the traffic likely to be generated/ attracted after improvement. Improvements to the existing road will ensure enhanced driving comfort, level of service and safety. The total length of project road section is 12.500 km.
The project road section starts from Km 603.600 (at the intersection of NH-212 at Nanjanagudu) and ends at Km 616.100 near Badanavalu (Nanjanagudu Taluk - Mysuru Dist. border)
(New Chainage from Km 646.324 to Km 658.824). Along this corridor two samplings stations were located, one at Nanjanagudu and the other at Mahadeva nagar.
4. Indian noise standards
In India, ambient air quality standards in respect of noise level have been prescribed under Environmental Protection Act, 1986, which are also given in noise prevention and control rules 2000 and the standards of noise in residential commercial, industrial and silence areas in day and night time are given in Table 1
Table 1. Noise standards
Area code Category of area Limits in dB(A), Leq Day time Night time
A Industrial area 75 70
B Commercial zone 65 55
C Residential zone 55 45
D Silence zone 50 40
Day time- 6.00 AM to10.00 PM (16 hours), Night time- 10.00 PM to 6.00 AM (08 hours),
[image:3.595.39.559.46.365.2]© 2017, IRJET | Impact Factor value: 5.181 | ISO 9001:2008 Certified Journal | Page 2099
5. Methodology
The methodology adopted is measurement of ambient noise levels at both the sampling stations, Collections of traffic volume and speed of the vehicles at the sampling stations.
5.1 Measurement of ambient noise levels
The Noise level monitoring was carried out at two locations one near Hotel Mahadeshwara Palace near Shrikanteshwara Temple at Nanjanagudu and the other one near Mahadeva Nagar along the project corridor. Hand held noise level meters were used to monitor the noise. Noise level in dB (A) are collected for 24 hrs duration at both the stations.
5.2 Traffic volume
Traffic volume is premeditated manually at the selected observation sites. Total number of vehicles passes in each type, passing in one hour in a single direction is noted in terms of vehicles/hour.
5.3 Speed measurement
Physical method of spot speed measurement is done for the current study. For this purpose, two points are marked with a known distance (100 meters) on the road at the sampling site. With the help of a stop watch the time taken by the vehicle to cross that distance is recorded. Dividing the distance with the time taken in crossing the distance, the speed is Km/h for each type of vehicle is calculated and recorded for each hour of study.
6
.Results and discussion
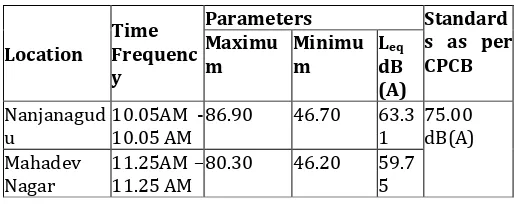
[image:4.595.306.563.222.332.2]The ambient noise levels recorded using noise level meter at the present project corridor NH 150 a has given the following results.
Table 2.
Noise level monitoring results
The noise monitoring survey shows that noise levels are closer to the upper limit of the noise standards. This may be due to mix activities as well as vehicular movement on the road. Noise, though is a major area of concern, at locations of sensitive receptors (educational establishments like schools and colleges, etc.) identified quite close to the road.
The hourly recorded noise level at various locations in the study area shows fluctuations because of change in traffic movement, construction activities and other man-made sources. The equivalent values of noise levels are 63.31 & 59.75 Which are within the prescribed norms of CPCB.
[image:4.595.34.291.592.694.2]7. FHWA model results:
TABLE 3.Predicted noise level results
The above table shows the results of predicted noise levels of present project corridor. It is observed that the noise levels in the year 2027 & 2037 at Nanjanagudu station are found to be 70.6 dB & 71.2 dB respectively. Similarly, for Mahadeva nagar station Noise level is found to be 70.8 dB & 71.4 dB respectively. The predicted noise levels can be reduced by using suitable noise barriers.
It is seen in the table that with the usage of noise barriers around 15 m from the roadways noise levels can be reduced suitably. The results obtained with noise barriers in the year 2027 & 2037 at Nanjanagudu station are found to be 65.4 dB & 66 dB respectively. Similarly, for Mahadeva nagar station noise level is found to be 64.4 dB & 64.9 dB.
8. CONCLUSIONS
Due to huge number of high-speed vehicles plying on roads, increased traffic volume and congestion near cities and urban dwellings, a sharp increase around 7 to 12 dB in noise levels has been rendered. The analysis of data has shown that the observed noise levels along a highway corridor are alarmingly high and the steps need to be taken for the control of noise by the prescribed authority. It is seen that with usage of barriers around 15m from the roadways noise level can be reduced suitably. It is obvious that the regulation of traffic volume and speed at any place may bring desired results with a view to control or minimize noise levels along a highway corridor.
It is expected that FHWA model can be used as a successful tool for predicting the noise using traffic parameters. With a view to control the traffic noise, the restrictions on traffic flow and speed can be planned especially along the highway corridors located in the vicinity of cities and urban areas, using the outcome of this study. It is also felt that the regulation of traffic volume and speed at sensitive points Location Existing
Noise levels Leq in dB
Predicted in the year (dB)
With Barriers in the year (dB)
2027 2037 2027 2037 Nanjanagudu 63.31 70.6 71.2 65.4 66 Mahadeva
Nagar 59.75 70.8 71.4 64.4 64.9
Location Time Frequenc y
Parameters Standard s as per CPCB Maximu
m Minimum LdB eq (A) Nanjanagud
u 10.05AM -10.05 AM 86.90 46.70 63.31 75.00 dB(A) Mahadev
© 2017, IRJET | Impact Factor value: 5.181 | ISO 9001:2008 Certified Journal | Page 2100
may prove to be quite helpful in reducing the noise levelsalong the highway corridors in urban areas. It is expected that the noise control along the highways by regulation of traffic volume and vehicle speed can be effectively implemented in India and elsewhere and FHWA model may prove to be of immense help in this perspective.
ACKNOWLEDGEMENT
This study was funded by the C V Kand Consultants Pvt. Ltd, Bengaluru. The authors wish to gratefully acknowledge Sunil Kand (Director of C V Kand Consultants Pvt. Ltd, Bengaluru) for giving a chance to work with the company.
REFERENCES
[1] Zannin, P. H., Ferreira, C. A. M. & Szermetta, B. (2006). Evaluation of noise pollution in urban parks. Environmental Monitoring and Assessment, 118, 423–433.
[2] Agrawal, S. and Swami, B.L. (2011). ―Comprehensive approach for the development of traffic noise prediction model for Jaipur city‖. Environ Monit Assess, 172:113-120.
[3] Rao, R. P. & Rao, S. M. G. (1991b). Prediction of LA10T traffic noise levels in the city of Visakhapatnam, India. Applied Acoustics, 34, 101–110.
[4] Alberola J, Flindell H, Bullmore J. (2005), ―Variability in road traffic noise levels‖, Elsevier Applied Acoustics 66 (2005) 1180–1195.
[5] Piccolo, A., Plutino, D. & Cannistraaro, G. (2004). Evaluation and analysis of the environmental noise of Messina, Italy. Applied Acoustics, 65, 343–364.
[6] Phatak, V., Tripathi, B. D. & Mishra, V. K. (2008b). Evaluation of traffic noise prediction and attitudes of exposed individuals in working place. Atmospheric
Environment, 42, 3892–3898.
[7] Michaud, D. S., Keith, S. E. & Mcmurchy, D. (2008). Noise annoyance in Canada. Noise and Health, 7(27), 39–47. [8] E. Chevallier, A. Can, M. Nadji, L. Leclercq, ―Improving
noise assessment at intersections by modeling traffic dynamics‖, Transportation Research Part D 14 (2009) 100–110
[9] Steele, C. 2001. ―A critical review of some traffic noise prediction models‖, Applied Acoustics 62, pp. 271-287. [10] IRC: 104-1988. (1989). ―Guidelines for
Environmental Impact Assessment of Highway Project‖. The Indian Roads Congress, Jamnagar House, New Delhi. [11] IS: 10399-1982. (1983). ―Methods for