dynamics and metastasis of cancer cells
M. Cecilia Caino, … , Silvano Bosari, Dario C. Altieri
J Clin Invest.
2013;123(7):2907-2920. https://doi.org/10.1172/JCI67841.
Metabolic reprogramming is an important driver of tumor progression; however, the
metabolic regulators of tumor cell motility and metastasis are not understood. Here, we
show that tumors maintain energy production under nutrient deprivation through the function
of HSP90 chaperones compartmentalized in mitochondria. Using cancer cell lines, we
found that mitochondrial HSP90 proteins, including tumor necrosis factor receptor–
associated protein-1 (TRAP-1), dampen the activation of the nutrient-sensing AMPK and its
substrate UNC-51–like kinase (ULK1), preserve cytoskeletal dynamics, and release the cell
motility effector focal adhesion kinase (FAK) from inhibition by the autophagy initiator
FIP200. In turn, this results in enhanced tumor cell invasion in low nutrients and metastatic
dissemination to bone or liver in disease models in mice. Moreover, we found that
phosphorylated ULK1 levels were correlated with shortened overall survival in patients with
non–small cell lung cancer. These results demonstrate that mitochondrial HSP90
chaperones, including TRAP-1, overcome metabolic stress and promote tumor cell
metastasis by limiting the activation of the nutrient sensor AMPK and preventing autophagy.
Research Article
Oncology
Find the latest version:
Research article
Metabolic stress regulates cytoskeletal
dynamics and metastasis of cancer cells
M. Cecilia Caino,1 Young Chan Chae,1 Valentina Vaira,1,2 Stefano Ferrero,3 Mario Nosotti,4
Nina M. Martin,1 Ashani Weeraratna,5 Michael O’Connell,5 Danielle Jernigan,6
Alessandro Fatatis,6,7,8 Lucia R. Languino,1,8,9 Silvano Bosari,10 and Dario C. Altieri1
1Prostate Cancer Discovery and Development Program, The Wistar Institute, Philadelphia, Pennsylvania, USA. 2Division of Pathology,
Fondazione IRCCS Ca’ Granda Ospedale Maggiore Policlinico, Milan, Italy. 3Department of Biomedical, Surgical and Dental Sciences,
University of Milan Medical School and Division of Pathology, and 4Department of Clinical/Surgical Pathophysiology and Organ Transplant,
University of Milan Medical School and Division of Thoracic Surgery and Lung Transplantation, Fondazione IRCCS Ca’ Granda Ospedale Maggiore Policlinico, Milan, Italy. 5Melanoma Research Center, The Wistar Institute, Philadelphia, Pennsylvania, USA. 6Department of Pharmacology and Physiology, and 7Department of Pathology, Drexel University College of Medicine, Philadelphia, Pennsylvania, USA. 8Kimmel Cancer Center and 9Department of Cancer Biology,
Thomas Jefferson University, Philadelphia, Pennsylvania, USA. 10Department of Clinical/Surgical Pathophysiology and Organ Transplant,
University of Milan Medical School and Division of Pathology, Fondazione IRCCS Ca’ Granda Ospedale Maggiore Policlinico, Milan, Italy.
Metabolic reprogramming is an important driver of tumor progression; however, the metabolic regulators of
tumor cell motility and metastasis are not understood. Here, we show that tumors maintain energy production
under nutrient deprivation through the function of HSP90 chaperones compartmentalized in mitochondria.
Using cancer cell lines, we found that mitochondrial HSP90 proteins, including tumor necrosis factor
recep-tor–associated protein-1 (TRAP-1), dampen the activation of the nutrient-sensing AMPK and its substrate
UNC-51–like kinase (ULK1), preserve cytoskeletal dynamics, and release the cell motility effector focal
adhe-sion kinase (FAK) from inhibition by the autophagy initiator FIP200. In turn, this results in enhanced tumor
cell invasion in low nutrients and metastatic dissemination to bone or liver in disease models in mice.
More-over, we found that phosphorylated ULK1 levels were correlated with shortened overall survival in patients
with non–small cell lung cancer. These results demonstrate that mitochondrial HSP90 chaperones, including
TRAP-1, overcome metabolic stress and promote tumor cell metastasis by limiting the activation of the
nutri-ent sensor AMPK and prevnutri-enting autophagy.
Introduction
Metabolic reprogramming of tumors (1) is being increasingly rec-ognized as an important disease driver, controlling various aspects of malignant development and progression (2). Although energeti-cally unfavorable (3), cancer metabolism contributes to biomass expansion (4), oncogenic signaling (5), generation of biochemical defects that further the malignant phenotype (6, 7), and trans-formation-associated epigenetic changes (8, 9). How tumor cells exploit a bioenergetics program to regulate malignant growth is beginning to emerge (10), but the regulators of this process are still elusive and their link to mechanisms of advanced disease, for instance, metastasis (11), has not been clearly elucidated.
In this context, tumors grow in acutely unfavorable environments, constantly exposed to oxidative stimuli and chronically depleted of oxygen and nutrients (12). Stress signals generated under these condi-tions antagonize tumor growth via activation of tumor suppressors (13), including liver kinase B1 (LKB1)/AMPK (14), inhibition of onco-genes, for instance, the mammalian target of rapamycin complex-1 (mTORC1) (15), and induction of autophagy (16), a process of cel-lular self digestion (17) that is often a barrier to transformation (18). Notwithstanding, nutrient-starved tumors circumvent these chal-lenges and manage to acquire highly energetically demanding traits, such as invasiveness, which heralds metastatic and lethal disease (19).
In this study, we explored whether metabolic reprogramming of mitochondrial bioenergetics influenced mechanisms of tumor cell invasion and metastasis in vivo. We focused on a network of
heat shock protein-90 (Hsp90) chaperones (20) that is preferen-tially, if not exclusively, found in mitochondria of tumor cells (21). Functionally, these molecules oversee the organelle protein folding environment in tumors, antagonizing cyclophilin D–dependent (CypD-dependent) permeability transition (22), and maintaining energy production via retention of the glycolytic enzyme, hexoki-nase II, to the mitochondrial outer membrane (23).
Results
Mitochondrial Hsp90 regulation of tumor cell motility. To begin investi-gating a role of mitochondrial Hsp90s in tumor cell movements, we used Gamitrinib (GA mitochondrial matrix inhibitor), a small molecule Hsp90 ATPase antagonist engineered to accumulate selectively in mitochondria (24). In these experiments, noncyto-toxic concentrations of Gamitrinib (23) suppressed the migration (Figure 1A and Supplemental Figure 1A; supplemental material available online with this article; doi:10.1172/JCI67841DS1), and invasion (Figure 1B and Supplemental Figure 1B) of tumor cell types. When tested in a more physiologic 3D model of cellular motil-ity, Gamitrinib blocked tumor cell invasion in organotypic spher-oids embedded in a collagen matrix (Figure 1C), with nearly com-plete suppression of invasive length and invasive areas (Figure 1D). In control experiments, Gamitrinib did not reduce tumor cell pro-liferation, compared with vehicle-treated culture cells (Figure 1E). Overall cell viability in a 3D microenvironment was also not affect-ed by calcein-AM staining and 2-photon microscopy imaging of organotypic spheroids (Figure 1F). Consistent with these find-ings, Gamitrinib also inhibited tumor cell migration in a wound closure assay at both 16- and 24-hour time intervals (Figure 1G).
Conflict of interest: The authors have declared that no conflict of interest exists.
This effect was specific for the tumor cells, as normal human fibroblasts treated with a broad range of Gamitrinib concentra-tions showed no changed in migration in a wound closure assay at comparable time intervals (Figure 1H).
As an independent approach, we next knocked down the expres-sion of one of the targets of Gamitrinib in mitochondria, the Hsp90-like chaperone tumor necrosis factor receptor–associated protein-1 (TRAP-1) (21). TRAP-1 silencing using pooled siRNAs (Figure 2A) reproduced the effect of Gamitrinib and suppressed tumor cell migration (Figure 2B). In contrast, TRAP-1 knockdown did not affect tumor cell proliferation, compared with cultures transfected with nontargeting siRNA (Figure 2C). To validate the specificity of these findings, we next silenced TRAP-1 in tumor cell types using individual siRNA sequences (Figure 2D). TRAP-1 knockdown under these conditions was also associated with significant inhibition of tumor cell migration (Figure 2E) and invasion (Figure 2F), whereas a control nontargeting siRNA was without effect.
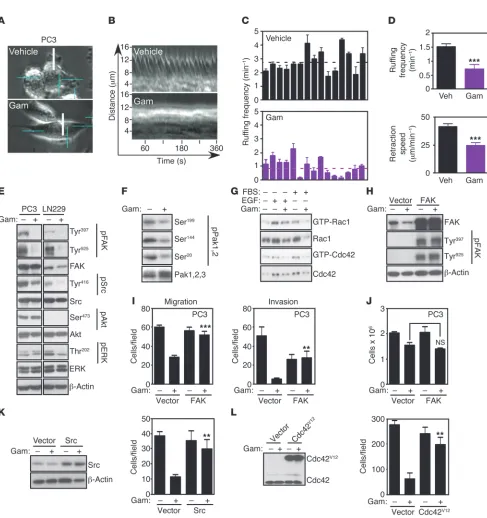
Cellular requirements of mitochondrial Hsp90 control of tumor cell motility. Consistent with inhibition of cell motility, exposure of tumor cells to Gamitrinib suppressed actin cytoskeletal assembly, with appearance of a rounded cell morphology, devoid of stress fibers and filopodia, by fluorescence microscopy (Supplemental Figure 2). Accordingly, Gamitrinib treatment resulted in nearly complete loss of cytoskeletal lamella dynamics, as evidenced by single-cell, time-lapse videomicros-copy analysis (Figure 3, A–C, and Supplemental Figure 3, A–C), with profound inhibition of ruffling frequency and retraction speed in tumor cells (Figure 3D). When analyzed for biochemical markers of cell motility, Gamitrinib-treated tumor cells exhibited loss of phos-phorylation of focal adhesion kinase (FAK) (25) on its autophosphor-ylation site, Tyr397 (26), and Src-phosphorautophosphor-ylation site, Tyr925 (ref. 27 and Figure 3E). Gamitrinib also inhibited the phosphorylation of other cell motility kinases, including Src on Tyr416 (Figure 3E), and of group I p21-activated kinases, Pak1,2 (28) on Ser199, Ser144, and Ser20 (Figure 3F). The activation of Rho family small GTPases, Rac1 and Cdc42, which coordinate actin cytoskeleton reorganization, lamellipodia protrusion and directional cell move-ment (29), was also impaired by Gamitrinib treatmove-ment (Figure 3G). Instead, Akt or ERK phosphorylation was not affected, and the total levels of these kinases remained unchanged (Figure 3E).
We next asked whether modulation of signaling kinases participat-ed in mitochondrial Hsp90 regulation of tumor cell motility. When transfected in tumor cells, recombinant FAK was phosphorylated, i.e., activated on Tyr397 and Tyr925, compared with the endog-enous pool of the molecule (Figure 3H). Under these conditions, transfection of FAK nearly completely restored tumor cell migration and invasion in the presence of Gamitrinib (Figure 3I). In contrast, transfected FAK had no effect on tumor cell proliferation in the presence or absence of Gamitrinib (Figure 3J). Similarly, transfec-tion of Src (Figure 3K), or constitutively active Cdc42Val12 mutant
(Figure 3L) rescued the inhibition of tumor cell motility mediated by Gamitrinib (Figure 3, K and L). Conversely, transfection of con-stitutively active RacVal12 did not reverse the effect of Gamitrinib on
tumor cell invasion (Supplemental Figure 3D).
Bioenergetics requirement of mitochondrial Hsp90-directed tumor cell motility. In addition to opposing CypD-dependent permeability transition (21), mitochondrial Hsp90s maintain ATP production in tumor cells via retention of HK-II to the organelle outer membrane (23). To test whether this function in bioenergetics was important for tumor cell motility, we next treated tumor cells with the mito-chondrial uncoupler carbonyl cyanide 3-chlorophenylhydrazone
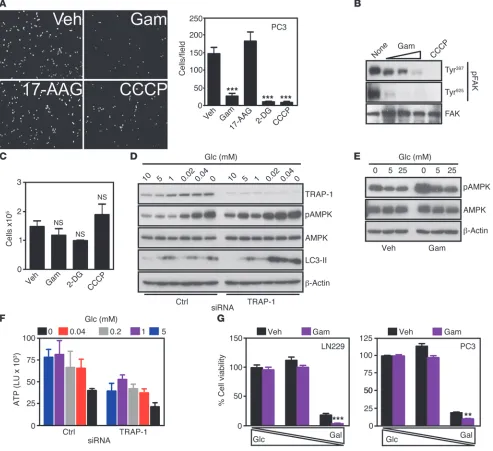
(CCCP) and looked for changes in cell motility. In these experi-ments, CCCP suppressed tumor cell migration (Supplemental Fig-ure 4, A and B) and invasion (FigFig-ure 4A), and abolished FAK phos-phorylation on Tyr397 and Tyr925 (Figure 4B). Similar results were obtained in response to energy starvation induced by the nonhy-drolyzable glucose analog 2 deoxyglucose (2-DG), which also sup-pressed tumor cell migration (Supplemental Figure 4, A and B) and invasion (Figure 4A). Conversely, inhibition of Hsp90 chaperone activity in cytosol, but not mitochondria, with 17-allylamino deme-thoxygeldanamicyn (17-AAG), (24) did not affect tumor cell migra-tion or invasion (Figure 4A and Supplemental Figure 4, A and B). As control for these experiments, treatment of tumor cells with CCCP, 2-DG, or Gamitrinib did not affect cell proliferation (Figure 4C) or cell death as determined by Trypan blue exclusion (Supplemen-tal Figure 4C) compared with vehicle-treated cultures.
research article
Figure 1
Gamitrinib inhibition of tumor cell motility. (A and B) Gamitrinib-treated (Gam) (5 μM) PC3 cells were analyzed for cell migration (A) or
inva-sion (B). Mean ± SEM (n = 3), ***P < 0.0001. (C and D) 3D organotypic LN229 spheroids treated with vehicle or Gamitrinib (1.25–2.5 μM) were analyzed by phase contrast microscopy (C, top), and mask-inverted images (C, bottom) were used to quantify the length and area between the
core and the invasive cores (D). Mean ± SEM (n = 3), *P = 0.0171–0.0295; ***P < 0.0001. Original magnification, ×20 (A and B); ×4 (C). (E) PC3
cells were treated with vehicle or Gamitrinib as in A and B and analyzed for cell proliferation by direct cell counting. Mean ± SEM (n = 3). (F)
LN229 spheroids were stained with calcein-AM (live cells, green) and Topro-3 (dead cells, blue) and analyzed by 2-photon microscopy. Original magnification, ×20. (G) PC3 cells were treated with vehicle or Gamitrinib (5 μM) and analyzed in a wound-closure assay after 16 or 24 hours. Representative micrographs (top) and quantification of cell motility (bottom) are shown. The leading front of cell migration is indicated by dotted lines. Mean ± SEM (n = 3), ***P < 0.0001–0.0004. Original magnification, ×5. (H) The experimental conditions are the same as in G except that
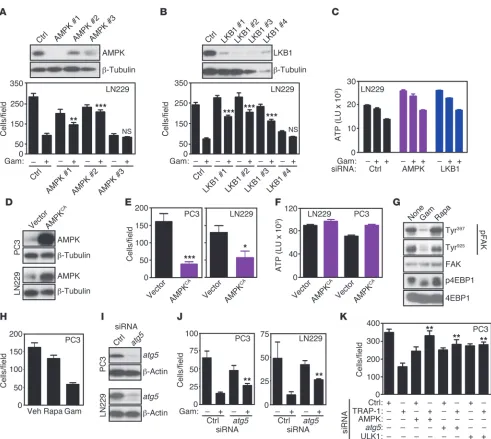
Control of tumor cell motility by AMPK-autophagy signaling. The data above have shown that AMPK phosphorylation correlates inverse-ly with tumor and normal cell movements (Figure 5, A and C), and this response was further investigated. Silencing of AMPK using independent siRNA sequences partially restored tumor cell motility in the presence of Gamitrinib (Figure 6A), suggesting that AMPK activation was required for this response. siRNA knock-down of the upstream AMPK activator and tumor suppressor, liver kinase B1 (LKB1) (Figure 6B and ref. 14), produced the same effect and rescued the inhibition of tumor cell invasion in the pres-ence of Gamitrinib (Figure 6B). We next asked whether a require-ment by LKB1/AMPK signaling in this pathway involved de novo energy production. In these experiments, Gamitrinib inhibited ATP production in tumor cells in a concentration-dependent man-ner (Figure 6C). In contrast, siRNA silencing of AMPK or LKB1 did not affect this response (Figure 6C). Next, we performed the reciprocal experiments and transfected tumor cells with vector or a constitutively active AMPK cDNA (AMPKCA) (Figure 6D). Forced
expression of active AMPK was sufficient to reproduce the effect
of Gamitrinib and inhibited tumor cell migration (Supplemental Figure 6A) and invasion (Figure 6E). Similar to the data reported above for LKB1/AMPK signaling (Figure 6C), constitutive expres-sion of AMPKCA was not associated with significant changes in
ATP production in tumor cells (Figure 6F). A control vector had no effect (Figure 6, E and F).
Next, we looked downstream of LKB1/AMPK signaling (14) and asked whether activation of the mTORC1 pathway (15), and/or autophagy (31) contributed to tumor cell motility. Con-sistent with previous observations (15), inhibition of mTORC1 with rapamycin suppressed 4EBP1 phosphorylation in tumor cells (Figure 6G). However, this had no effect on FAK phos-phorylation (Figure 6G) or tumor cell migration (Figure 6H). Conversely, siRNA silencing of the essential autophagy gene atg5
[image:5.585.54.534.80.428.2](Figure 6I) partially rescued tumor cell invasion in the presence of Gamitrinib (Figure 6J), indicating that activation of autoph-agy was required for mitochondrial Hsp90 regulation of tumor cell motility. To validate the role of autophagy in this pathway, we next silenced the expression of TRAP-1 together with AMPK
Figure 2
Mitochondrial chaperone TRAP-1 regulation of tumor cell motility. (A and B) The indicated tumor cell lines were transfected with control nontargeting
(Ctrl) or TRAP-1–directed pooled siRNA and analyzed by Western blotting (A) or cell migration (B). Top panels, phase contrast microscopy. Bottom
panels, quantification of cell migration. Mean ± SEM (n = 3). ***P < 0.0001. Original magnification, ×20. (C) The indicated tumor cell types were
trans-fected with control siRNA or siRNA directed to TRAP-1 and analyzed for cell proliferation by direct cell counting. Mean ± SEM (n = 3). (D) The
indi-cated tumor cell lines were transfected with control nontargeting siRNA or individual siRNA sequences to TRAP-1 and analyzed by Western blotting. (E and F) The indicated tumor cell types were transfected with control siRNA, individual siRNA sequences (nos. 1–4) to TRAP-1, or pooled siRNA
research article
Figure 3
Cellular requirements of mitochondrial Hsp90-directed tumor cell migration. (A) Representative images from video sequences of FBS-stimulated
PC3 cells treated with vehicle or Gamitrinib (5 μM) and analyzed by real-time quantification of membrane ruffling (lamellipodia growth and retraction) by stroboscopic imaging. Scale bars: 16.2 μm length. (B) Stroboscopic images representing an area of analysis (white line in A) for
the indicated time intervals. (C) Quantification of membrane ruffling frequency. Each bar corresponds to an individual cell. Broken lines, average
values. (D) Average ruffling frequency (top), and quantification of speed of lamellipodia retraction in μm/min (bottom). Mean ± SEM (n = 15). ***P < 0.0001. (E and F) Tumor cells treated with (+) or without (–) Gamitrinib (5 μM) were analyzed by Western blotting. p, phosphorylated. (G)
Serum-starved A549 cells were stimulated with EGF (100 ng/ml, 2 minutes) or FBS (10%, 5 minutes), treated with (+) or without (–) Gamitrinib (5 μM), and analyzed for GTP-bound Rac1 or Cdc42. (H) PC3 cells were transfected with vector or cDNA encoding FAK and analyzed by Western
blotting. p, phosphorylated. (I and J), PC3 cells transfected as in (H) and treated with (+) or without (–) Gamitrinib (5 μM) were analyzed for cell migration (left) or invasion (right) (I), or cell proliferation (J). Mean ± SEM (n = 3), ***P < 0.0001. (K and L) PC3 cells were transfected with
or atg5 (Supplemental Figure 6B) and we looked at changes in tumor cell motility. Simultaneous siRNA knockdown of AMPK or atg5 restored tumor cell migration in the presence of TRAP-1 silencing by siRNA (Figure 6K). In these experiments, simultane-ous knockdown of the autophagy initiating UNC-51–like kinase (ULK1) (32) also rescued the inhibitory effect of TRAP-1 silencing on tumor cell motility (Figure 6K).
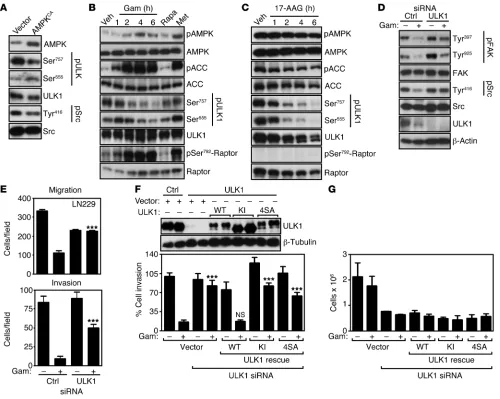
ULK1-FIP200 regulation of tumor cell motility. The data above suggest that the upstream autophagy regulator, ULK1, controlled tumor cell motility during bioenergetics stress, and this possibility was next investigated. Consistent with this model, expression of con-stitutively active AMPKCA in tumor cells resulted in strong
[image:7.585.50.543.85.536.2]phos-phorylation of ULK1 on Ser555, which has been implicated as a potential AMPK phosphorylation site (refs. 31, 32, and Figure 7A).
Figure 4
Metabolic stress control of tumor cell invasion. (A) PC3 cells were treated with Gamitrinib (5 μM), 17-AAG (5 μM), or CCCP (12.5 μM, or 2-DG (25 mM) and analyzed for cell invasion. Left, representative image of stained nuclei. Right, quantification. Mean ± SEM (n = 3). ***P < 0.0001. Original magnification, ×20. (B) PC3 cells were treated with Gamitrinib (1.25–5 μM) or CCCP (12.5 μM) and analyzed by Western blotting. (C)
PC3 cells were treated as in A and analyzed for cell proliferation. Mean ± SEM (n = 3). (D) LN229 cells were transfected with control siRNA or
TRAP-1–directed siRNA and analyzed by Western blotting with or without glucose (Glc). (E) LN229 cells were treated with vehicle or Gamitrinib
(5 μM) and analyzed by Western blotting with or without glucose. (F) LN229 cells were transfected with control or TRAP-1–directed siRNA and
analyzed for ATP production in the presence of the indicated concentrations of glucose. LU, luciferase units. Mean ± SEM (n = 3). (G) LN229
research article
In contrast, transfection of AMPKCA reduced ULK1
phosphoryla-tion on Ser757, a potential mTORC1, (31) compared with vector control cells (Figure 7A). Src phosphorylation on Tyr416 was also attenuated by expression of constitutively active AMPK, whereas the total levels of the kinases were not affected (Figure 7A). We next asked whether energy starvation induced by Gamitrinib pro-duced similar changes in ULK1 phosphorylation status. In these experiments, Gamitrinib induced early phosphorylation of AMPK and of its downstream substrate, ACC (Figure 7B), in agreement with recent observations (23). This was associated with significant changes in the ratio of AMPK (Ser555)/mTORC1 (Ser757) phorylation, with rapid, i.e., within 1 to 2 hours of treatment, phos-phorylation of ULK1 on Ser555 and decreased phosphos-phorylation on Ser757 (Figure 7B). Consistent with a model of ULK1 activation under these conditions, Gamitrinib also induced strong phosphor-ylation of Raptor (33) on its inhibitory site, Ser792, whereas the total level of ULK1 was not affected (Figure 7B). As control, treat-ment of tumor cells with the AMPK activator metformin produced similar results, with activation of AMPK and ACC, increased ULK1 phosphorylation on Ser555, and inhibition of mTORC1 signal-ing due to phosphorylation of Raptor on Ser792 and concomitant decreased phosphorylation of ULK1 on Ser757 (Figure 7B).
We next asked whether these responses were specific to modula-tion of mitochondrial bioenergetics, and we treated tumor cells with 17-AAG, which inhibits Hsp90 chaperone activity in the cytosol, but
not mitochondria. At variance with Gamitrinib, 17-AAG did not affect AMPK or ACC phosphorylation in tumor cells (Figure 7C). Also, the ratio of ULK1 phosphorylation on the AMPK (Ser555)/ mTORC1 (Ser757) site was unaffected, as 17-AAG equally reduced ULK1 phosphorylation on Ser757 and Ser555 and Raptor remained unphosphorylated on Ser792 (Figure 7C). Although at the time points of this experiment, total ULK1 levels were not affected, a lon-ger, 24-hour exposure of tumor cells to 17-AAG caused ULK1 deg-radation (not shown), in agreement with recent observations (34).
[image:8.585.47.541.77.383.2]We next silenced the expression of ULK1 by siRNA (Supplemental Figure 6C) and looked at biochemical and functional markers of cell motility in the presence or absence of Gamitrinib. ULK1 knockdown in tumor cells was sufficient to reactivate phosphorylation of FAK on Ty397 and Tyr925 and of Src on Tyr416 despite the presence of Gamitrinib (Figure 7D). Functionally, this was associated with rescue of tumor cell migration and invasion (Figure 7E) from the inhibi-tory effect of Gamitrinib. To confirm that this response was specific, we next used ULK1-silenced tumor cells reconstituted with siRNA-insensitive vectors. Expression of WT ULK1 in these cells restored the inhibition of tumor cell motility mediated by Gamitrinib (Figure 7F). In contrast, expression of non-AMPK phosphorylatable ULK1 mutant (4SA) or a kinase-inactive (KI) ULK1 mutant was ineffective in the presence of Gamitrinib (Figure 7F). As control, reconstitution studies with the various siRNA-insensitive ULK1 cDNAs did not sig-nificantly affect tumor cell proliferation (Figure 7G).
Figure 5
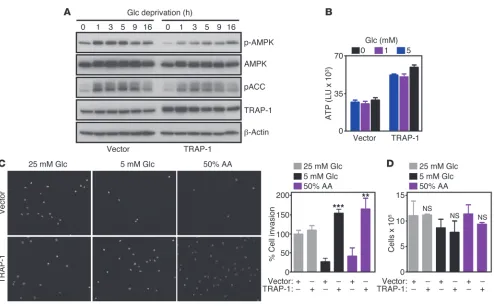
Metabolic stress control of cell motility. (A) NIH3T3 fibroblasts were transfected with vector or TRAP-1 cDNA, and analyzed by Western blotting.
(B) The experimental conditions are as in A except that control or TRAP-1–transfected cells were analyzed for ATP production at the indicated
glucose concentrations. LU, luciferase units. Mean ± SEM (n = 3). (C) NIH3T3 fibroblasts transfected as in A were analyzed by DAPI staining of
invading cells under the indicated conditions. Right, quantification of cell invasion. Mean ± SEM (n = 3). **P = 0.0029; ***P < 0.0001. (D) NIH3T3
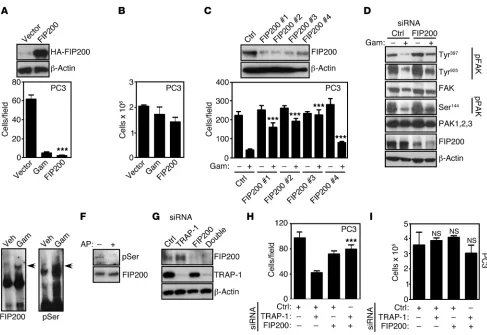
In addition to atg13, ULK1 forms a complex with FIP200 (35), a molecule first identified as an endogenous inhibitor of FAK (36), and more recently implicated in autophagy (37), especially autophagosome formation (38, 39). Therefore, we next asked whether FIP200 functioned downstream of AMPK-ULK1 to con-trol tumor cell motility. Consistent with this possibility, transfec-tion of a FIP200 cDNA (Figure 8A) abolished tumor cell migratransfec-tion
[image:9.585.46.537.77.516.2](Supplemental Figure 6D), and invasion (Figure 8A) compared with control transfectants. In contrast, tumor cell proliferation was not affected (Figure 8B). In reciprocal experiments, we silenced the expression of FIP200 using siRNA pools (Supplemental Fig-ure 7A) or individual siRNA sequences (FigFig-ure 8C) and looked at tumor cell motility. In these studies, FIP200 knockdown reversed the inhibitory effect of Gamitrinib on tumor cell migration and
Figure 6
LKB1/AMPK regulation of tumor cell motility. (A and B) LN229 cells were transfected with individual siRNA sequences to AMPK (A) or LKB1
(B) and analyzed by Western blotting (top), cell migration (A), or invasion (B) with (+) or without (–) Gamitrinib (5 μM). Mean ± SEM (n = 3). **P = 0.0011; ***P < 0.0001. (C) LN229 cells were transfected with control siRNA or individual siRNA sequences to AMPK or LKB1 and analyzed for
ATP production with (+) or without (–) Gamitrinib (5–10 μM). Mean of replicates of a representative experiment out of at least 3 independent deter-minations. (D and E) Tumor cell types transfected with control or constitutively active AMPK (AMPKCA) cDNA were analyzed by Western blotting (D) or cell invasion (E). Mean ± SEM (n = 3). *P = 0.0295; ***P < 0.001. (F) The experimental conditions are as in D, except that transfected LN229 or
PC3 cells were analyzed for ATP production. Mean ± SEM (n = 3). (G and H) PC3 cells were treated with rapamycin (Rapa, 0.1 μM) or Gamitrinib (5 μM), and analyzed by Western blotting for differential phosphorylation of the indicated kinases (G) or cell migration after 6 hours (H). Mean ± SEM
(n = 3). (I and J) The indicated tumor cell lines were transfected with control siRNA or atg5-directed siRNA and analyzed by Western blotting (I)
or cell invasion (J). Mean ± SEM (n = 3). **P < 0.001. (K) PC3 cells were transfected with control nontargeting siRNA or TRAP-1–directed siRNA
research article
invasion (Supplemental Figure 7B and Figure 8C), and restored the activating phosphorylation of FAK and Pak1, 2 (Ser144) compared with control siRNA transfectants (Figure 8D). The regulation of FIP200 function has not been completely elucidated, but may involve a ULK1-dependent phosphorylation step. Consistent with this model, FIP200 analyzed from Gamitrinib-treated cells exhib-ited gel mobility retardation, suggestive of increased phosphoryla-tion (Figure 8E), and, accordingly, reacted with an antibody to pan-phosphorylated Ser (Figure 8E). Conversely, alkaline phosphatase treatment abolished Ser-phosphorylated reactivity with FIP200 immunoprecipitated from Gamitrinib-treated PC3 cells (Fig-ure 8F). Functionally, siRNA silencing of FIP200 (Fig(Fig-ure 8G)
rescued the tumor cell migration in TRAP-1–depleted cells (Figure 8H), mimicking the results obtained with Gamitrinib. In control exper-iments, FIP200 or TRAP-1 silencing, alone or in combination, did not affect tumor cell proliferation (Figure 8I).
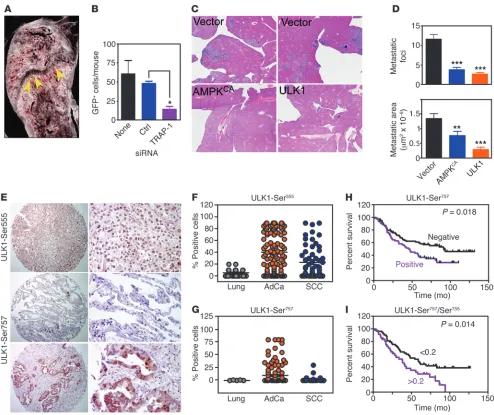
Mitochondrial Hsp90s control metastasis, in vivo. We next examined the impact of mitochondrial Hsp90 regulation of tumor cell motil-ity in disease settings. First, we used a model of bone metastasis in which we silenced the expression of TRAP-1 in breast adenocar-cinoma (AdCa) MDA-231 cells labeled with GFP (Figure 2A) and injected them in the left ventricle of immunocompromised mice to look at their dissemination to the knee joint after 72 hours. GFP+
[image:10.585.45.545.81.480.2]cells transfected with nontargeting siRNA homed to the bone of
Figure 7
ULK1 control of tumor cell motility. (A) PC3 cells were transfected with vector or constitutively active AMPK cDNA (AMPKCA) and analyzed by Western blotting for changes in phosphorylation of the indicated kinases. (B) PC3 cells were treated with vehicle, rapamycin (0.1 μM for 1 hour), metformin (5 mM for 6 hours), or Gamitrinib (5 μM for the indicated time intervals) and analyzed by Western blotting. (C) PC3 cells were treated
with 17-AAG (5 μM) for the indicated time intervals and analyzed by Western blotting. (D) PC3 cells transfected with control or ULK1-directed
siRNA were treated with (+) or without (–) Gamitrinib (5 μM) and analyzed by Western blotting for differential phosphorylation of the indicated kinases. (E) LN229 cells were transfected as in D and analyzed for cell migration (top) or invasion (bottom) in the presence (+) or absence (–)
of Gamitrinib. Mean ± SEM (n = 3). ***P < 0.0001. (F) PC3 cells transfected with control siRNA or ULK1-directed siRNA were reconstituted with
siRNA-insensitive WT ULK1, KI ULK1, or non-AMPK phosphorylatable ULK1 (4SA) cDNA and analyzed by Western blotting (top) or cell invasion (bottom). Mean ± SEM (n = 3). ***P < 0.0001. (G) The experimental conditions are as in F, except that transfected and reconstituted PC3 cells
Immunoreactivity for phosphorylated ULK1 on Ser555 (Figure 9, E and F) or Ser757 (Figure 9, E and G) was also increased in NSCLC patients compared with normal lung, predominantly in AdCa (Figure 9, F and G). When stratified for disease outcome, phosphoryla-tion of ULK1 on Ser757 was associated with shortened OS (Figure 9H, Supplemental Figure 8C, and Supplemental Table 2). This trend was mostly observed in patients with AdCa histotype (Supplemental Figure 8D) independently of tumor size or lymph node involvement (Supplemental Figure 8E). In these cases, preferential activation of the mTORC1 (Ser757) over AMPK (Ser555) pathway in ULK1 (31, 32) correlated with larger tumor size (Supplemental Figure 8F and Sup-plemental Table 2), and decreased OS (Figure 9I).
Discussion
In this study, we have shown that tumor cells utilize mitochon-drial Hsp90-directed protein folding (21) to produce ATP (23) under conditions of stress, such as nutrient deprivation or amino acid shortage (12). In spite of nutrient starvation, this adaptive injected animals as efficiently as nontransfected cultures (Figure 9,
A and B). In contrast, siRNA silencing of TRAP-1 suppressed tumor cell localization to bone (Figure 9, A and B). In a second model of metastasis, we targeted the AMPK/ULK1 pathway, and we transfected lung AdCa H460 cells with ULK1 or constitutively active AMPKCA cDNA. Injection of cells transfected with control
vector into the spleen of immunocompromised mice gave rise to extensive metastatic foci in the liver within 11 days (Figure 9, C and D). In contrast, transfection of AMPKCA or ULK1 cDNA
reduced both the number and surface area of liver metastasis in reconstituted animals (Figure 9, C and D).
[image:11.585.52.539.78.413.2]Based on these results, we next asked whether AMPK-ULK1 regula-tion of cell motility was important in human tumors, and we studied a series of non–small cell lung cancer (NSCLC) patients with avail-able clinical outcome data (Supplemental Tavail-able 1). ULK1 expression was elevated in NSCLC, especially AdCa histotypes, compared with squamous cell carcinoma (SCC) (Supplemental Figure 8A), but did not correlate with overall survival (OS) (Supplemental Figure 8B).
Figure 8
FIP200 regulation of tumor cell motility. (A) PC3 cells were transfected with vector or FIP200 cDNA and analyzed by Western blotting (top) or cell
invasion (bottom). Mean ± SEM (n = 3). ***P < 0.0001. (B) PC3 cells transfected as in A were analyzed for cell proliferation by direct cell counting.
Mean ± SEM (n = 3). (C) PC3 cells were transfected with control siRNA or the indicated individual siRNA sequences to FIP200 and analyzed by
Western blotting (top) or cell invasion (bottom) in the presence (+) or absence (–) of Gamitrinib. Mean ± SEM (n = 3). ***P < 0.0001. (D) PC3 cells
were transfected with control siRNA or FIP200-directed siRNA and analyzed by Western blotting in the presence (+) or absence (–) of Gamitrinib. (E) PC3 cells were treated with vehicle or Gamitrinib (5 μM) and analyzed for gel mobility shift by Western blotting using antibodies to FIP200 (left) or pan-phosphorylated Ser residues (right). Arrows, phosphorylated isotypes of FIP200. (F) FIP200 immune complexes precipitated from
Gamitrinib-treated PC3 cells were incubated with (+) or without (–) alkaline phosphatase (AP) and analyzed by Western blotting. (G) PC3 cells
were transfected with control siRNA, FIP200- or TRAP-1–directed siRNA alone or in combination and analyzed by Western blotting. (H and I) The
research article
translated to enhanced tumor cell invasion, in vivo, metastatic dissemination to bone or liver in mouse models of disease, and shortened OS in patients with NSCLC (Figure 10).
The crosstalk between bioenergetics stress imposed by nutrient deprivation, activation of AMPK, and induction of autophagy in the dynamics of tumor growth is complex and likely carries differ-ent functional implications depending on disease stage and cellular context. Accordingly, these mechanisms have been variously linked mechanism is sufficient to dampen the activation of the energy
[image:12.585.46.540.80.495.2]sensor and tumor suppressor AMPK (14, 15) and limit the induc-tion of another tumor-suppression mechanism, autophagy (ref. 18 and Figure 10). When analyzed in the context of cell movements, this pathway maintained cytoskeletal dynamics through persis-tent phosphorylation of multiple cell motility kinases and released FAK (25, 26) from inhibition by an ULK1-FIP200 autophagy-ini-tiating complex (refs. 38, 39, and Figure 10). Functionally, this
Figure 9
Metabolic control of metastasis. (A) Representative image of single GFP-labeled breast AdCa MDA-231 cells (arrows) lodged near the growth
cartilage of the femora and tibiae of inoculated CB17 SCID mice. Original magnification, ×100 (left). (B) Quantification of bone homing of
GFP-labeled MDA-231 cells transfected with control siRNA or TRAP-1–directed siRNA. Mean ± SEM (5 animals/group). *P = 0.034. None, untrans-fected cells. (C) Representative histologic image of livers from animals injected intrasplenically with H460 cells transfected with vector, AMPKCA or ULK1 cDNA. Original magnification, ×1. (D) Quantification of number of metastatic foci (top) and metastatic surface area (bottom) per each
condition tested. Mean ± SEM (3–4 animals/group). ***P < 0.0001; **P = 0.009. (E) Representative images of immunohistochemical expression
of ULK1-Ser555 or ULK1-Ser757 in NSCLC TMA sections. Middle panels, representative sections of normal lung weakly positive (<10% stained cells) for ULK1-Ser757 expression. Original magnification, ×50 (left panels); ×200 (right panels). (F and G) Summary of ULK1-Ser555 (F) or
ULK1-Ser757 (G) immunoreactivity in NSCLC patients. The analysis parameters are as follows: (F) ULK1-Ser555, n = 173; positive, 98 (AdCa), 40 (SCC); negative, 20 (AdCa), 15 (SCC); (G) ULK1-Ser757 (cytosolic reactivity), n = 178; positive, 38 (AdCa), 5 (SCC); negative, 83 (AdCa), 52 (SCC). (H and I) Kaplan-Meier survival curves of NSCLC patients according to expression of Ser757-phosphorylated ULK1 (H) or differential ratio
sive network and enables FAK-dependent tumor cell invasion in the face of nutrient deprivation. Mechanistically, this pathway involves retention of the first enzyme of the glycolytic cascade, HK-II, to the mitochondrial outer membrane (4) via regulation of CypD folding (23). However, other mechanisms of energy produc-tion are also plausible, and galactose challenge experiments pre-sented here pointed to a role of mitochondrial Hsp90s in main-taining a residual level of oxidative phosphorylation, consistent with a role of these molecules in oxygen consumption (23).
The pathogenetic context for these observations (Figure 10) resides in the highly unfavorable conditions of tumor growth in vivo, chronically depleted of oxygen and nutrients and constant-ly exposed to oxidative stresses (12). Despite these challenges, a nutrient-impaired microenvironment has been causally linked to tumor progression (1), and, accordingly, mitochondrial Hsp90-directed bioenergetics under energy deprivation enabled meta-static dissemination in vivo. Conversely, loss of TRAP-1 expression in mitochondria or gain of activity by the autophagy regulators, AMPK or ULK1 antagonized tumor cell motility and suppressed metastatic dissemination in mice. Despite the ambivalent nature of autophagy in tumor progression (17), there is now considerable effort to target the regulators of this pathway for cancer therapy. Our data highlight the complexity of this approach and suggest that disabling autophagy-initiating molecules, in particular ULK1, may have detrimental contraindications, not only by removing to tumor suppression (40) or, conversely, cell survival under
meta-bolic stress (41) or tumor adaptation (18). Our results show that AMPK activation, while potentially important for cell survival (41), also provides a strong barrier against tumor cell motility and metas-tasis in a pathway reversed by mTORC1 activation (15). This model is in line with developmental roles of AMPK (42) and LKB1 (43) in epithelial polarity and cytoskeletal remodeling during metabolic stress (44) and antimetastatic properties proposed for LKB1 (45).
A key effector of tumor cell motility under nutrient deprivation downstream of AMPK was identified here as the ULK1-FIP200 complex (32). Together with atg13, this multiprotein interactor functions as an upstream initiator of autophagy (37, 38), poten-tially coordinating the process of autophagosome formation (38). How FIP200 is regulated in this complex is still being worked out, but there is evidence for a role of ULK1-mediated phosphoryla-tion (39) consistent with our findings that ULK1 kinase activity is required for tumor cell motility and that FIP200 exhibits phos-phorylation-dependent gel retardation in energy-impaired tumor cells. In parallel with its role in autophagy (38), activated FIP200 also functions as an endogenous inhibitor of FAK (37), shutting off the multifunctional properties of this kinase in cell motility, invasion, proliferation, and survival (25) that are often exploited in disparate cancers (26).
Mitochondrial Hsp90-directed bioenergetics emerged here as an adaptive mechanism that overcomes this global
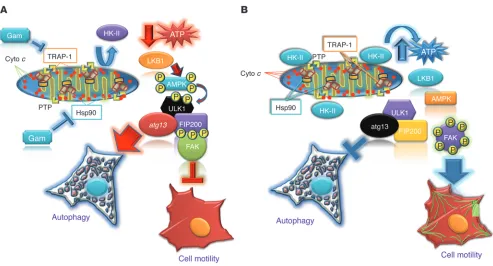
tumor-suppres-Figure 10
Schematic representation of bioenergetics stress control of tumor cell motility. (A) Inhibition of mitochondrial Hsp90-directed protein folding
by Gamitrinib induces a bioenergetics imbalance due to detachment of HK-II from the mitochondrial outer membrane. In turn, this results in decreased ATP production, activation of the energy sensor LKB-1-AMPK kinase cascade, and AMPK-dependent phosphorylation of ULK1, a component of the upstream autophagy initiator complex. Active ULK1 mediates phosphorylation and activation of FIP200, which in turn inhibits FAK-directed tumor cell motility and metastasis. (B) Despite limited nutrient availability, mitochondrial Hsp90s maintain HK-II tethered to the
[image:13.585.46.539.79.345.2]research article
concentration in each extract was determined in a microplate luminometer (Beckman Coulter) against standard ATP solutions used as a reference.
Animal models of skeletal or liver metastasis. All experiments in vivo were car-ried out in accordance with the Guide for the Care and Use of Laboratory Animals of the NIH. Protocols were approved by an IACUC. For an ani-mal model of skeletal metastasis (51, 52), 5-week-old feani-male CB17-SCID mice were obtained from Taconic and housed in a germ-free barrier. At 6 to 8 weeks of age, mice were anesthetized with the combined adminis-tration of ketamine (80 mg/kg) and xylazine (10 mg/kg) administered by intraperitoneal route and then inoculated in the left cardiac ventricle with breast AdCa MDA-231 cells. Cell inoculation was performed using an insu-lin syringe with a 30-gauge needle. The correct penetration of the cardiac wall was established by the appearance of fresh arterial blood in the Luer-Lok fitting of the hypodermic needle. In addition, blue-fluorescent polysty-rene beads (10 μm diameter; Invitrogen, Molecular Probes) were coinjected with cancer cells and their detection in the adrenal glands was utilized to confirm successful inoculation in the blood circulation (51, 52). Animals were sacrificed after 72 hours, and adrenal glands and bones were fixed in 4% formalin for 48 hours. Femora and tibiae were decalcified in 0.5 M EDTA for 4 days, and tissues were frozen in O.C.T. embedding medium (Electron Microscopy Sciences) after a cryoprotection step in 25% sucrose for 24 hours. Serial tissue sections of 80-μm thickness were prepared using a Microm HM550 cryostat (Mikron). Sections of each hind leg and soft-tis-sue organs were transferred on glass slides, stored at –20°C, and examined for cancer cells using a Zeiss AX10 fluorescence microscope connected to a Nuance multispectral imaging system (CRI) with a measurement mod-ule included in the analysis software (v. 2.4). Bright field and fluorescence images were acquired with an Olympus DT70 CCD color camera (51, 52).
For an animal model of liver metastasis (53), 6- to 8-week-old female SCID/beige mice were anesthetized with ketamine hydrochloride; the abdominal cavity was exposed by laparotomy and injected into the spleen with 4 × 10⁶ H460 cells previously transfected with control plasmid, ULK1 cDNA, or constitutively active AMPKCA cDNA. Spleens were removed the following day to minimize effects on metastasis due to variable growth of primary tumors. Animals were sacrificed at 11 days after injection, and their livers were resected, fixed in formalin, and paraffin embedded. Liver sections were stained with H&E and analyzed histologically. Metastatic foci were quantified in serial tissue sections by histology and expressed as number of lesions and surface areas of tumor growth (53).
Patient samples. Samples from a series of 180 consecutive patients surgi-cally treated for NSCLC at Fondazione IRCCS Ca’ Granda Hospital between 2000 and 2004 were available for this study. This patient series included 123 cases of AdCa and 57 cases of SCC of the lung. Clinical outcome data were available for all patients. NSCLC cases were staged according to the current TNM classification of malignant tumors (54). The follow-up period ranged from 0 to 132 months (average 55.2 months). At the last follow-up (January 2011), 103 patients were deceased from progression of NSCLC, whereas 77 patients were alive. Patients’ characteristics are summarized in Supplemen-tal Table 1. SupplemenSupplemen-tal Methods are available online.
Statistics. Data were analyzed using 2-sided unpaired t tests using a GraphPad software package (Prism 4.0) for Windows. For analysis of patient samples, groups were compared using Student’s t tests as univari-ate statistics. For OS analysis, the Kaplan-Meier method was used. Patients negative for ULK1-Ser757 were plotted separately from ULK1-Ser757–pos-itive cases, and the 2-sided log-rank test was used to compare the 2 curves. The phosphorylation event at Ser757 or Ser555 had opposite effects on ULK1 function. When the immunoreactivity of both phosphorylated forms was considered, a score was computed for each sample summing Ser757 immunoreactivity in the cytoplasm and in nuclei and dividing for a Ser555 immunoreactivity value. Kaplan-Meier curves for patient OS under
autophagy-associated tumor cell death (17), but also by unre-straining FAK from FIP200 inhibition (36), promoting paradoxi-cal tumor cell invasion and metastasis.
As a pivotal effector of this response, there is evidence that ULK1 regulation is achieved by differential phosphorylation, but con-troversy exists as to the reciprocal roles of AMPK or mTORC1 kinases in this process (35) and whether these modifications have disease relevance in vivo. The data here suggest that a relative ratio of ULK1 phosphorylation on putative AMPK (Ser555) (31, 32) or mTORC1 (Ser757) (31) site(s) may better predict downstream responses of autophagy and, consequently, tumor cell motility and invasion. This approach may have clinical utility, as we observed that preferential ULK1 phosphorylation by mTORC1 over AMPK correlates with disease progression and shortened OS in NSCLC patients. These data are consistent with a role of mTORC1 sig-naling (15) as a disease driver and potential therapeutic target in lung cancer (46), and suggest that AMPK activation in established malignancies in vivo may continue to provide a tumor suppressor function, possibly linked to activation of autophagy (14) and inhi-bition of metastasis (this study).
In sum, mitochondrial Hsp90-directed tumor cell metabolism (23) functions as a pivotal mediator of tumor cell motility and invasion when nutrients are scarce, consistent with the nearly ubiquitous overexpression of these chaperones in advanced dis-ease in vivo (21). Although there has been considerable progress in mapping the transcriptional requirements of metastasis (47) and the cellular (48) and genetic (49, 50) aspects of this process have come into better focus, disseminated tumors are incurable, carry-ing considerable morbidity and mortality. Instead, subcellular tar-geting of mitochondrial Hsp90s as upstream regulators of tumor bioenergetics (Figure 10) is feasible (30) and may simultaneously disable key signaling nodes of tumor energy production (23) and cell survival (21), indispensable for metastatic competency, in vivo.
Methods
Cell culture. Human glioblastoma LN229, prostate AdCa PC3 and PC3-ML subline, lung AdCa H1299, H1437, H460, and A549, breast AdCa MDA-MB-231, melanoma 1205Lu, and WM793, or normal NIH3T3 and MRC-5 fibroblasts were obtained from ATCC and maintained in culture according to the supplier’s specifications. For metabolic stress experi-ments, cells were incubated in MEM-based medium containing glucose, essential and nonessential amino acids, and vitamin concentrations iden-tical to those of DMEM, plus 4 mM L-glutamine, 1 mM sodium pyruvate, 10 mM HEPES, and 10% 10 K dialyzed FBS (Gibco; Invitrogen). Three conditions were tested: 25 mM glucose (complete medium), 5 mM glu-cose, or 50% amino acid deprivation compared with DMEM. Galactose challenge experiments were performed by culturing the cells in DMEM No Glucose Medium supplemented with 4 mM L-glutamine, 10% 10-K dialyzed FBS, and the indicated mixtures of glucose and D-(+)-galactose to a final concentration of 25 mM.
Protein analysis. Protein lysates were prepared in RIPA buffer containing 150 mM NaCl, 1.0% Triton X-100, 0.5% sodium deoxycholate, 0.1% SDS, and 50 mM Tris, pH 8.0, in the presence of EDTA-free protease inhibi-tor cocktail (Roche) and phosphatase inhibiinhibi-tor cocktail 2 and 3 (Sigma-Aldrich). Equal amounts of protein lysates were separated by SDS gel electrophoresis, transferred to PVDF membranes, and incubated with primary antibodies of various specificities. Protein bands were detected by chemiluminescence, as described (21).
Russell Delgiacco for histotechnology slide preparation (Wistar). This work was supported by NIH grants CA140043, HL54131, CA78810, and CA118005. Support for Core Facilities utilized in this study was provided by Cancer Center Support Grant (CCSG) CA010815 to The Wistar Institute.
Received for publication November 14, 2012, and accepted in revised form April 11, 2013.
Address correspondence to: Dario C. Altieri, The Wistar Institute Cancer Center, 3601 Spruce Street, Philadelphia, Pennsylvania 19104, USA. Phone: 215.495.6970; Fax: 215.495.6863; E-mail: daltieri@wistar.org.
the various conditions examined were then generated. Data are expressed as mean ± SD or mean ± SEM of at least 3 independent experiments.
P < 0.05 was considered statistically significant.
Study approval. All experiments in vivo were carried out in accordance with the Guide for the Care and Use of Laboratory Animals of the NIH. Animal studies were approved by an IACUC from The Wistar Institute or Drexel University College of Medicine. For studies using human samples, informed consent was obtained from all patients enrolled, and the study was approved by an Institutional Review Board of the Fondazione IRCCS Ca’ Granda.
Acknowledgments
We thank Frederick Keeney (Wistar) for help with time-lapse imag-ing and quantification of 3D models of tumor-cell invasion and
1. Kroemer G, Pouyssegur J. Tumor cell metabo-lism: cancer’s Achilles’ heel. Cancer Cell. 2008; 13(6):472–482.
2. Buchakjian MR, Kornbluth S. The engine driving the ship: metabolic steering of cell proliferation and death. Nat Rev Mol Cell Biol. 2010;11(10):715–727. 3. Koppenol WH, Bounds PL, Dang CV. Otto
War-burg’s contributions to current concepts of cancer metabolism. Nat Rev Cancer. 2011;11(5):325–337. 4. Vander Heiden MG, Cantley LC, Thompson CB.
Understanding the Warburg effect: the metabolic requirements of cell proliferation. Science. 2009; 324(5930):1029–1033.
5. Gordan JD, et al. HIF-alpha effects on c-Myc distin-guish two subtypes of sporadic VHL-deficient clear cell renal carcinoma. Cancer Cell. 2008;14(6):435–446. 6. Dang L, et al. Cancer-associated IDH1 muta-tions produce 2-hydroxyglutarate. Nature. 2009; 462(7274):739–744.
7. Zhao S, et al. Glioma-derived mutations in IDH1 dominantly inhibit IDH1 catalytic activity and induce HIF-1alpha. Science. 2009;324(5924):261–265. 8. Koivunen P, et al. Transformation by the (R)-enan-tiomer of 2-hydroxyglutarate linked to EGLN acti-vation. Nature. 2012;483(7390):484–488. 9. Lu C, et al. IDH mutation impairs histone
demeth-ylation and results in a block to cell differentiation. Nature. 2012;483(7390):474–478.
10. Wellen KE, Thompson CB. A two-way street: recip-rocal regulation of metabolism and signalling. Nat Rev Mol Cell Biol. 2012;13(4):270–276.
11. Schafer ZT, et al. Antioxidant and oncogene res-cue of metabolic defects caused by loss of matrix attachment. Nature. 2009;461(7260):109–113. 12. Laderoute KR, et al. 5′-AMP-activated protein
kinase (AMPK) is induced by low-oxygen and glucose deprivation conditions found in solid-tumor microenvironments. Mol Cell Biol. 2006; 26(14):5336–5347.
13. Yoo LI, Chung DC, Yuan J. LKB1 — a master tumour suppressor of the small intestine and beyond. Nat Rev Cancer. 2002;2(7):529–535. 14. Mihaylova MM, Shaw RJ. The AMPK signalling
pathway coordinates cell growth, autophagy and metabolism. Nat Cell Biol. 2011;13(9):1016–1023. 15. Wullschleger S, Loewith R, Hall MN. TOR
sig-naling in growth and metabolism. Cell. 2006; 124(3):471–484.
16. Behrends C, Sowa ME, Gygi SP, Harper JW. Net-work organization of the human autophagy system. Nature. 2010;466(7302):68–76.
17. Kimmelman AC. The dynamic nature of autophagy in cancer. Genes Dev. 2011;25(19):1999–2010. 18. White E. Deconvoluting the context-dependent
role for autophagy in cancer. Nat Rev Cancer. 2012; 12(6):401–410.
19. Friedl P, Alexander S. Cancer invasion and the micro-environment: plasticity and reciprocity. Cell. 2011;
147(5):992–1009.
20. Taipale M, Jarosz DF, Lindquist S. HSP90 at the hub of protein homeostasis: emerging mechanistic insights. Nat Rev Mol Cell Biol. 2010;11(7):515–528. 21. Kang BH, Plescia J, Dohi T, Rosa J, Doxsey SJ, Alt-ieri DC. Regulation of tumor cell mitochondrial homeostasis by an organelle-specific Hsp90 chap-erone network. Cell. 2007;131(2):257–270. 22. Green DR, Kroemer G. The
pathophysiol-ogy of mitochondrial cell death. Science. 2004; 305(5684):626–629.
23. Chae YC, et al. Control of tumor bioenergetics and survival stress signaling by mitochondrial HSP90s. Cancer Cell. 2012;22(3):331–344.
24. Kang BH, et al. Combinatorial drug design tar-geting multiple cancer signaling networks con-trolled by mitochondrial Hsp90. J Clin Invest. 2009; 119(3):454–464.
25. Frame MC, Patel H, Serrels B, Lietha D, Eck MJ. The FERM domain: organizing the structure and function of FAK. Nat Rev Mol Cell Biol. 2010; 11(11):802–814.
26. Schaller MD. Cellular functions of FAK kinases: insight into molecular mechanisms and novel functions. J Cell Sci. 2010;123(pt 7):1007–1013. 27. Deramaudt TB, et al. FAK phosphorylation at
Tyr-925 regulates cross-talk between focal adhesion turnover and cell protrusion. Mol Biol Cell. 2011; 22(7):964–975.
28. Kumar R, Gururaj AE, Barnes CJ. p21-activated kinases in cancer. Nat Rev Cancer. 2006;6(6):459–471. 29. Raftopoulou M, Hall A. Cell migration: Rho
GTPases lead the way. Dev Biol. 2004;265(1):23–32. 30. Siegelin MD, et al. Exploiting the mitochon-drial unfolded protein response for cancer ther-apy in mice and human cells. J Clin Invest. 2011; 121(4):1349–1360.
31. Kim J, Kundu M, Viollet B, Guan K-L. AMPK and mTOR regulate autophagy through direct phosphor-ylation of Ulk1. Nat Cell Biol. 2011;13(2):132–141. 32. Egan DF, et al. Phosphorylation of ULK1 (hATG1) by
AMP-activated protein kinase connects energy sens-ing to mitophagy. Science. 2011;331(6016):456–461. 33. Kim DH, et al. mTOR interacts with raptor to form
a nutrient-sensitive complex that signals to the cell growth machinery. Cell. 2002;110(2):163–175. 34. Joo JH, et al. Hsp90-Cdc37 chaperone complex
regulates Ulk1- and Atg13-mediated mitophagy. Mol Cell. 2011;43(4):572–585.
35. Alers S, Loffler AS, Wesselborg S, Stork B. Role of AMPK-mTOR-Ulk1/2 in the regulation of autoph-agy: cross talk, shortcuts, and feedbacks. Mol Cell Biol. 2012;32(1):2–11.
36. Abbi S, et al. Regulation of focal adhesion kinase by a novel protein inhibitor FIP200. Mol Biol Cell. 2002;13(9):3178–3191.
37. Wei H, Wei S, Gan B, Peng X, Zou W, Guan JL. Suppression of autophagy by FIP200 deletion
inhibits mammary tumorigenesis. Genes Dev. 2011; 25(14):1510–1527.
38. Hara T, et al. FIP200, a ULK-interacting protein, is required for autophagosome formation in mam-malian cells. J Cell Biol. 2008;181(3):497–510. 39. Jung CH, et al. ULK-Atg13-FIP200 complexes
medi-ate mTOR signaling to the autophagy machinery. Mol Biol Cell. 2009;20(7):1992–2003.
40. van Veelen W, Korsse SE, van de Laar L, Peppelen-bosch MP. The long and winding road to ratio-nal treatment of cancer associated with LKB1/ AMPK/TSC/mTORC1 signaling. Oncogene. 2011; 30(20):2289–2303.
41. Jeon S-M, Chandel NS, Hay N. AMPK regu-lates NADPH homeostasis to promote tumour cell survival during energy stress. Nature. 2012; 485(7400):661–665.
42. Lee JH, et al. Energy-dependent regulation of cell structure by AMP-activated protein kinase. Nature. 2007;447(7147):1017–1020.
43. Martin SG, St Johnston D. A role for Drosophila LKB1 in anterior-posterior axis formation and epi-thelial polarity. Nature. 2003;421(6921):379–384. 44. Mirouse V, Swick LL, Kazgan N, St Johnston D,
Brenman JE. LKB1 and AMPK maintain epithelial cell polarity under energetic stress. J Cell Biol. 2007; 177(3):387–392.
45. Ji H, et al. LKB1 modulates lung cancer differentia-tion and metastasis. Nature. 2007;448(7155):807–810. 46. Khokhar NZ, Altman JK, Platanias LC. Emerging
roles for mammalian target of rapamycin inhibitors in the treatment of solid tumors and hematological malignancies. Curr Opin Oncol. 2011;23(6):578–586. 47. Bos PD, et al. Genes that mediate breast cancer metas-tasis to the brain. Nature. 2009;459(7249):1005–1009. 48. Valastyan S, Weinberg RA. Tumor metastasis:
molecular insights and evolving paradigms. Cell. 2011;147(2):275–292.
49. Lujambio A, Lowe SW. The microcosmos of cancer. Nature. 2012;482(7385):347–355.
50. Scott KL, et al. Proinvasion metastasis drivers in early-stage melanoma are oncogenes. Cancer Cell. 2011;20(1):92–103.
51. Jamieson-Gladney WL, Zhang Y, Fong AM, Meucci O, Fatatis A. The chemokine receptor CX(3)CR1 is directly involved in the arrest of breast cancer cells to the skeleton. Breast Cancer Res. 2011;13(5):R91. 52. Russell MR, Jamieson WL, Dolloff NG, Fatatis A.
The alpha-receptor for platelet-derived growth fac-tor as a target for antibody-mediated inhibition of skeletal metastases from prostate cancer cells. Oncogene. 2009;28(3):412–421.
53. Mehrotra S, Languino LR, Raskett CM, Mercurio AM, Dohi T, Altieri DC. IAP regulation of metastasis. Cancer Cell. 2010;17(1):53–64.