Mechanism for leptin’s acute
insulin-independent effect to reverse diabetic
ketoacidosis
Rachel J. Perry, … , Gary W. Cline, Gerald I. Shulman
J Clin Invest.
2017;
127(2)
:657-669.
https://doi.org/10.1172/JCI88477
.
The mechanism by which leptin reverses diabetic ketoacidosis (DKA) is unknown. We
examined the acute insulin-independent effects of leptin replacement therapy in a
streptozotocin-induced rat model of DKA. Leptin infusion reduced rates of lipolysis, hepatic
glucose production (HGP), and hepatic ketogenesis by 50% within 6 hours and were
independent of any changes in plasma glucagon concentrations; these effects were
abrogated by coinfusion of corticosterone. Treating leptin- and corticosterone-infused rats
with an adipose triglyceride lipase inhibitor blocked corticosterone-induced increases in
plasma glucose concentrations and rates of HGP and ketogenesis. Similarly,
adrenalectomized type 1 diabetic (T1D) rats exhibited decreased rates of lipolysis, HGP,
and ketogenesis; these effects were reversed by corticosterone infusion. Leptin-induced
decreases in lipolysis, HGP, and ketogenesis in DKA were also nullified by relatively small
increases (15 to 70 pM) in plasma insulin concentrations. In contrast, the chronic
glucose-lowering effect of leptin in a STZ-induced mouse model of poorly controlled T1D was
associated with decreased food intake, reduced plasma glucagon and corticosterone
concentrations, and decreased ectopic lipid (triacylglycerol/diacylglycerol) content in liver
and muscle. Collectively, these studies demonstrate marked differences in the acute
insulin-independent effects by which leptin reverses fasting hyperglycemia and ketoacidosis in a
rodent model of DKA versus the chronic pleotropic effects by which leptin reverses
hyperglycemia in a non-DKA rodent model of T1D.
Concise Communication
Endocrinology
Metabolism
Find the latest version:
Introduction
Recent studies have demonstrated that leptin, administered either systemically or into the cerebroventricular or hypothalamic space, can lower plasma glucose concentrations and prolong life in insulinopenic rodent models of poorly controlled type 1 dia-betes (T1D) (1–4). However, the mechanism by which this occurs has been the subject of recent debate and has been attributed to suppression of hyperglucagonemia or glucagon responsiveness (1, 2, 5–8), improvements in insulin sensitivity (7, 9), and activation of Creb-regulated transcription coactivator 1 signaling (10). Fur-thermore, even less is known regarding the mechanism by which leptin reverses ketaoacidosis in diabetic rodents. In this regard, hepatic ketogenesis is thought to be regulated mostly by malonyl CoA, a key regulator of carnitine palmitoyl transferase-I (CPT-I) activity, which in turn regulates fatty acid transport into the mito-chondria (11). However, until recently, the small pool size and lability of hepatic malonyl CoA have prevented direct measure-ments of malonyl CoA concentrations, making it difficult to exam-ine the role of malonyl CoA in ketogenesis as well as to determexam-ine whether leptin-induced increases in hepatic malonyl CoA con-centrations are responsible for leptin’s ability to reverse ketoaci-dosis in rodent models of diabetic ketoaciketoaci-dosis (DKA). In a recent study, we found that acute leptin replacement therapy reduces
plasma glucose concentrations by suppressing plasma corticoste-rone concentrations, resulting in lower rates of lipolysis, which in turn leads to reductions in hepatic acetyl CoA content and hepat-ic gluconeogenesis in 3 rat models of poorly controlled diabetes (12). However, the role of leptin-mediated suppression of hyper-corticosteronemia as necessary or sufficient to mediate leptin’s acute, insulin-independent effect in T1D has recently been called into question (13) by Morton et al. They found that leptin as well as glucocorticoid receptor blockade had no effect on plasma glu-cose concentrations in a streptozotocin-treated (STZ-treated) rat model of T1D and that adrenalectomized T1D rats did not exhibit lower plasma glucose concentrations than nonadrenalectomized T1D rats. From these results, they concluded that lowering plasma corticosterone concentrations is neither necessary nor sufficient to mediate leptin’s effects to lower plasma glucose concentra-tions in T1D rodents. However, there are major differences in the STZ-treated T1D rat model that Morton et al. used in their stud-ies compared with the STZ-treated T1D rat model of DKA used in our studies, which could account for these different results. Spe-cifically, Morton et al. used rats that are less insulinopenic than ours and performed mostly chronic studies in fed rats, whereas we performed primarily acute experiments in fasted rats with 5-fold lower plasma insulin concentrations.
In order to further characterize the mechanism by which leptin replacement therapy acutely reverses both the increased rates of hepatic glucose production and hepatic ketogenesis associated with DKA and to understand the reasons for the disparate findings between our study and that of Morton et al., we performed a series of experiments to assess the mechanisms for the effects of leptin replacement therapy on hyperglycemia and ketoacidosis under
sev-The mechanism by which leptin reverses diabetic ketoacidosis (DKA) is unknown. We examined the acute insulin-independent effects of leptin replacement therapy in a streptozotocin-induced rat model of DKA. Leptin infusion reduced rates of lipolysis, hepatic glucose production (HGP), and hepatic ketogenesis by 50% within 6 hours and were independent of any changes in plasma glucagon concentrations; these effects were abrogated by coinfusion of corticosterone. Treating leptin- and corticosterone-infused rats with an adipose triglyceride lipase inhibitor blocked corticosterone-induced increases in plasma glucose concentrations and rates of HGP and ketogenesis. Similarly, adrenalectomized type 1 diabetic (T1D) rats exhibited decreased rates of lipolysis, HGP, and ketogenesis; these effects were reversed by corticosterone infusion. Leptin-induced decreases in lipolysis, HGP, and ketogenesis in DKA were also nullified by relatively small increases (15 to 70 pM) in plasma insulin concentrations. In contrast, the chronic glucose-lowering effect of leptin in a STZ-induced mouse model of poorly controlled T1D was associated with decreased food intake, reduced plasma glucagon and corticosterone concentrations, and decreased ectopic lipid (triacylglycerol/diacylglycerol) content in liver and muscle. Collectively, these studies demonstrate marked differences in the acute insulin-independent effects by which leptin reverses fasting hyperglycemia and ketoacidosis in a rodent model of DKA versus the chronic pleotropic effects by which leptin reverses hyperglycemia in a non-DKA rodent model of T1D.
Mechanism for leptin’s acute insulin-independent
effect to reverse diabetic ketoacidosis
Rachel J. Perry,1 Liang Peng,1 Abudukadier Abulizi,1 Lynn Kennedy,1 Gary W. Cline,1 and Gerald I. Shulman1,2,3
1Department of Internal Medicine, 2Department of Cellular and Molecular Physiology, and 3Howard Hughes Medical Institute, Yale University School of Medicine, New Haven, Connecticut, USA.
Conflict of interest: The authors have declared that no conflict of interest exists.
Submitted: May 9, 2016; Accepted: October 27, 2016.
Reference information: J Clin Invest. 2017;127(2):657–669. https://doi.org/10.1172/JCI88477.
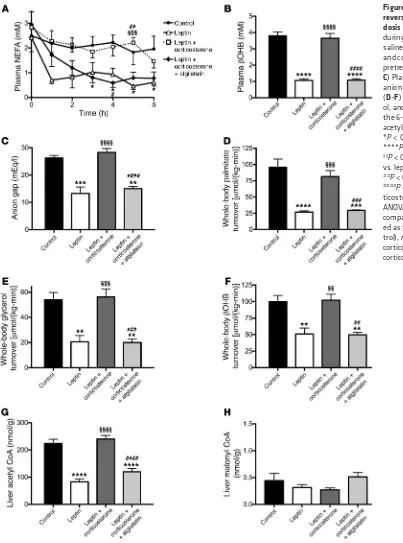
those measured in control T1D rats. This intervention increased plasma glucose concentrations and HGP to levels similar to those measured in control T1D rats without affecting plasma insulin, glucagon, epinephrine, norepinephrine, growth hormone, or IGF-1 concentrations (Figure 1, A–H, and Supplemental Figure 1, A–C).
Next, to determine the cause of the increased endogenous glu-cose production measured in T1D rats, we measured plasma nones-terified fatty acid (NEFA) and β-hydroxybutyric acid (βOHB) con-centrations and found both to be elevated in T1D rats as compared with nondiabetic controls (0.94 ± 0.11 mEq/l NEFA and 0.76 ± 0.10 mM βOHB in normal rats not treated with STZ), with leptin sup-pressing both NEFA and βOHB concentrations, and corticosterone infusion acutely restoring each to that measured in T1D rats (Figure 2, A and B). We next confirmed that our T1D control rats were in DKA, measuring an anion gap 40% greater in T1D rats than in non-diabetic rats (17 ± 2 mEq/l), and that DKA was reversed with leptin treatment, but not with leptin and corticosterone infusion (Figure 2C). To assess the potential role of increased lipolysis in mediating the glucose- and ketone-lowering effects of leptin, we performed a steady-state infusion of [13C
16] palmitate and [1,1,2,3,3-2H5] glycerol
and, consistent with our previous study (12), we found that leptin lowered rates of lipolysis in T1D rats, but replacement corticoste-rone abrogated this effect (Figure 2, D and E). Leptin-treated rats also exhibited suppression of ketogenesis, as demonstrated by a 50% reduction in the rate of βOHB turnover (Figure 2F). T1D rats exhibited decreased hepatic acetyl CoA content, but there were no changes in hepatic malonyl CoA compared to non diabetic control rats (Non diabetic control rats; hepatic acetyl-CoA: 96±5 nmol/g, malonyl-CoA: 0.51±0.08 nmol/g), and short-term leptin treatment was associated with suppression of hepatic acetyl CoA content, but no changes in hepatic malonyl CoA content (Figure 2, G and H).
Increased rates of lipolysis promote increased rates of HGP and ketogenesis in DKA. In order to determine the physiological role of
increased lipolysis in driving hyperglycemia and ketoacidosis in DKA, we next treated a group of leptin- and corticosterone-infused DKA rats with atglistatin, a small-molecule ATGL inhibitor (14, 15), prior to infusion with leptin and corticosterone. This intervention lowered rates of endogenous glucose production, lipolysis, and ketogenesis as well as hepatic acetyl CoA content similar to those measured in leptin-treated DKA rats, without affecting plasma glucagon, epinephrine, norepinephrine, growth hormone, IGF-1, hepatic malonyl CoA concentrations (Figure 1, A–H, Figure 2, A–H, and Supplemental Figure 1, A–C). In order to better understand the roles of hepatic acetyl CoA and malonyl CoA in mediating leptin’s acute effects to reverse DKA, we coinfused acetate in leptin-treated DKA rats to raise hepatic acetyl CoA concentrations to those mea-sured in untreated rats in DKA (Figure 3, A–D). Acetate infusion increased plasma glucose concentrations and HGP 2-fold (Figure 3, E and F) (15). Interestingly, the 3-fold increase in hepatic acetyl CoA concentrations induced by the acetate infusion was also associated with a striking increase in ketosis, demonstrated by a doubling in both plasma βOHB concentrations and whole-body βOHB turnover (Figure 3, G and H), without any change in hepatic malonyl CoA content (leptin-treated rats 0.54 ± 0.15, leptin plus acetate-treated rats 0.35 ± 0.08, leptin→leptin plus acetate-treated rats 0.37 ± 0.16 nmol/g; arrow denotes rats that were treated with leptin alone for 4 hours, then infused with leptin plus acetate for the final 2 hours). eral conditions. First, in order to examine the mechanism by which
leptin replacement therapy acutely reverses DKA in an insulin- independent manner, we examined the effects of leptin treatment on rates of lipolysis, hepatic glucose production, ketogenesis, hepat-ic acetyl CoA, and malonyl CoA content in a rat model of STZ- induced DKA. Secondly, to determine whether lipolysis mediates increases in hepatic glucose production (HGP) and ketogenesis, we treated leptin- and corticosterone-infused rats in DKA with a small molecule inhibitor of adipose triglyceride lipase (ATGL). Next, in order to examine the role of corticosterone in driving DKA, we assessed rates of lipolysis, ketogenesis, and HGP in an adrenalecto-mized STZ-induced diabetic rat model with and without corticos-terone replacement in both the fed and fasted state. So as to further characterize the impact of insulin and feeding on these leptin- mediated effects, we then examined the acute effect of leptin replacement therapy on glucose turnover and ketogenesis in DKA rats when plasma insulin concentrations were increased from approximately 15 pM to approximately 70 pM by an infusion of insu-lin under both fed and fasted conditions. Finally, in order to exam-ine the mechanism or mechanisms by which chronic leptin replace-ment therapy reduces blood glucose concentrations, we evaluated the effects of chronic leptin replacement therapy on plasma glucose, glucagon, and glucocorticoid concentrations as well as food intake, energy expenditure, and ectopic lipid content in liver and skeletal muscle in a nonketoacidotic STZ-induced mouse model of T1D.
Results
Leptin acutely suppresses lipolysis and HGP in an insulin-independent manner by suppression of the hypothalamic-pituitary-adrenal axis.
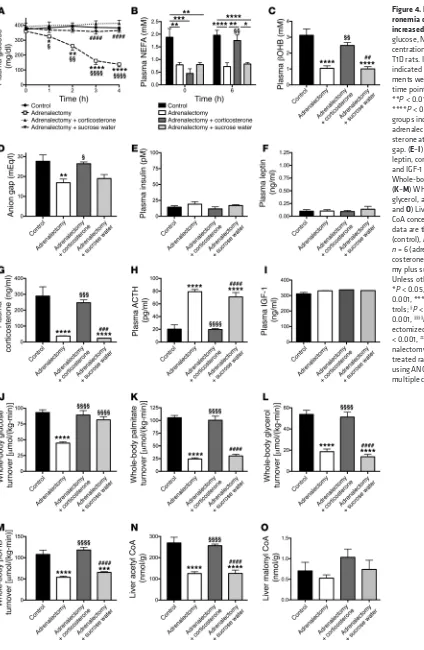
plasma corticosterone data (Figure 4, A–I, and Supplemental Figure 2, A–C). Futhermore, within 1 hour of removing the sucrose and corticosterone from their drinking water, adrenalectomized T1D rats exhibited plasma glucose concentrations lower than those of intact controls, and their plasma glucose concentrations and whole-body glucose, palmitate, glycerol, and βOHB turnover rates rapidly decreased and normalized within 4 hours of removing the sucrose and corticosterone drinking water (Figure 4, A and J–M). The low-er rates of lipolysis and ketogenesis in adrenalectomized rats wlow-ere associated with a 50% reduction in hepatic acetyl CoA content, but no change in malonyl CoA content (Figure 4, N and O).
Adrenalectomized T1D rats are protected from fasting, but not post-prandial hyperglycemia. In order to further assess the role of
hyper-corticosteronemia in driving fasting hyperglycemia and DKA, we studied adrenalectomized STZ-treated rats in DKA. Despite low or absent corticosterone, epinephrine, and norepinephrine concentra-tions and glucagon, growth hormone, and IGF-1 concentraconcentra-tions that were not different from those of STZ-treated T1D controls, adre-nalectomized rats were hyperglycemic when given water contain-ing sucrose and corticosterone. However, both plasma NEFA and
[image:4.585.44.464.51.585.2]βOHB concentrations as well as the anion gap were lower in adre-nalectomized rats as compared with diabetic controls, mirroring the
Figure 1. Leptin suppression of hypercorticosteronemia is required to mediate its glucose- lowering effects by suppressing lipolysis in DKA. (A) Plasma glucose during a 6-hour acute infusion of saline (control), leptin, or leptin and corticosterone with or without pretreatment with atglistatin. (A and H) *P < 0.05, **P < 0.01, ***P < 0.001, ****P < 0.0001 vs. controls;
§§§P < 0.001, §§§§P < 0.0001 vs.
leptin-treated rats; and ##P < 0.01, ###P < 0.001, ####P < 0.0001 vs. leptin plus corticos-terone–treated rats. (B) Fasting plasma insulin. (C–E) Plasma leptin, corticosterone, and ACTH concentrations at 0 and 6 hours of the infusion. **P < 0.01, ***P < 0.001, ****P < 0.0001 between the groups indicated;
§§P < 0.01, §§§§P < 0.0001 vs. the
same group at time zero. (F and
G) Fasting plasma glucagon and IGF-1 concentrations. (H) HGP after 6 hours. In all panels, data were compared by 1-way ANOVA with Bonferroni’s multiple com-parisons test, with data present-ed as the mean ± SEM of
n = 7 (control), n = 7 (leptin), n = 10 (leptin plus corticosterone),
in the control animals. Finally, to confirm the role of sucrose water in promoting hyperglycemia in adrenalectomized rats, as suggested by the time course of plasma glucose, we studied adre-nalectomized rats given ad libitum access to sucrose in the drink-ing water. Allowdrink-ing the rats to continue consumdrink-ing sucrose water resulted in maintenance of hyperglycemia and increased rates of whole-body glucose turnover (likely derived from both endoge-nous glucose production and exogeendoge-nous sucrose consumption) as compared with adrenalectomized rats given water without sucrose (Figure 4, A–O).
[image:5.585.36.439.53.596.2]In order to examine the role of hypercorticosteronemia in promoting hyperglycemia in DKA, we studied adrenalectomized rats infused with replacement corticosterone and found that nor-malizing plasma corticosterone to concentrations measured in intact T1D rats in DKA increased lipolysis, HGP, and ketoacidosis to levels similar to those measured in control T1D animals (Figure 4, A–O, and Supplemental Figure 3, A–C). Interestingly, plasma epinephrine, likely derived from extraadrenal sources (i.e., organ of Zuckerkandl), increased in the corticosterone-treated adrenal-ectomized animals to concentrations similar to those measured
Figure 2. Suppression of lipolysis reverses hyperglycemia and ketoaci-dosis in T1D rats. (A) Plasma NEFA during a 6-hour acute infusion of saline (control), leptin, or leptin and corticosterone with or without pretreatment with atglistatin. (B and
C) Plasma βOHB concentrations and anion gap after 6 hours of infusion. (D–F) Whole-body palmitate, glycer-ol, and βOHB turnover at the end of the 6-hour infusion. (G and H) Liver acetyl and malonyl CoA content. *P < 0.05, **P < 0.01, ***P < 0.001, ****P < 0.0001 vs. controls;
§§P < 0.01, §§§P < 0.001, §§§§P < 0.0001
tolerance test (Figure 5, A and B). The milder insulinopenia exhib-ited by the diabetic rats with fasting plasma insulin concentrations of approximately 70 pM was also associated with lower plasma
βOHB concentrations and a normal anion gap (Supplemental Fig-ure 3, A and B). To verify whether these associations demonstrat-ed a causative effect of insulin to suppress ketoacidosis, even at insufficient concentrations to prevent fasting hyperglycemia, we infused rats in DKA with insulin to raise their plasma insulin con-centrations from approximately 15 pM to approximately 70 pM. Our data demonstrate that increasing plasma insulin concentra-tions from approximately 15 pM to approximately 70 pM lowered plasma glucose, NEFA, βOHB, and anion gap, with leptin infusion
Increasing plasma insulin concentrations from 15 to 70 pM nul-lifies the effect of leptin to reduce plasma glucose and ketone concen-trations. In order to examine whether differences in plasma
[image:6.585.45.440.54.563.2]insu-lin concentrations in the STZ-T1D rat models could account for differences between our study and that of Morton et al., we next compared STZ-treated rats with plasma insulin concentrations of approximately 15 pM, as measured in our T1D rats in DKA, to those with plasma insulin of approximately 70 pM, as measured in Mor-ton et al.’s study (13). We found that, while both are significant-ly hypergsignificant-lycemic, the latter model has significant β cell reserve, demonstrated by 3- to 6-fold higher plasma insulin and 100 to 150 mg/dl lower plasma glucose concentrations throughout a glucose
Figure 3. Suppression of hepatic acetyl CoA accounts for leptin’s ability to reverse DKA. (A and B) Plasma acetate and liver acetyl CoA. (C and D) Plasma insulin and leptin. (E
and F) Plasma glucose concentrations and HGP. (G and H) Plasma βOHB concentrations and whole-body βOHB turnover. In all panels, *P < 0.05, **P < 0.01, ***P < 0.001, ****P < 0.0001 vs. leptin-treated rats; §§§P < 0.001, §§§§P < 0.0001 vs. leptin plus acetate–
Figure 4. Hypercorticoste-ronemia drives DKA through increased lipolysis. (A–C) Plasma glucose, NEFA, and βOHB con-centrations in adrenalectomized T1D rats. In all panels, unless indicated otherwise, all measure-ments were made at the 4-hour time point. (B) *P < 0.05, **P < 0.01, ***P < 0.001, ****P < 0.0001 between the groups indicated; §§P < 0.01 vs.
adrenalectomy plus cortico-sterone at time zero. (D) Anion gap. (E–I) Plasma insulin, leptin, corticosterone, ACTH, and IGF-1 concentrations. (J) Whole-body glucose turnover. (K–M) Whole-body palmitate, glycerol, and βOHB turnover. (N
and O) Liver acetyl and malonyl CoA concentrations. In all panels, data are the mean ± SEM of n = 8 (control), n = 11 (adrenalectomy),
n = 6 (adrenalectomy plus
corti-costerone), or n = 6 (adrenalecto-my plus sucrose water) per group. Unless otherwise specified, *P < 0.05, **P < 0.01, ***P < 0.001, ****P < 0.0001 vs. con-trols; §P < 0.05, §§P < 0.01, §§§P <
0.001, §§§§P < 0.0001 vs.
[image:7.585.41.465.51.701.2]only modestly reducing plasma glucose in this setting, despite a 40% reduction in plasma corticosterone in rats infused with insu-lin (Figure 5, C–F, and Supplemental Figure 3, C–E). Rates of HGP, lipolysis, and βOHB turnover as well as liver acetyl and malonyl CoA concentrations were unchanged with leptin treatment (Sup-plemental Figure 3, F–K), but with the exception of malonyl CoA
content, each parameter was lower than that measured in rats that were in DKA and had plasma insulin concentrations of approxi-mately 15 pM (Figure 1H and Figure 2, D–H).
[image:8.585.45.435.48.643.2]Next, we assessed the impact of acute leptin infusion on gly-cemia in fed (3-hour food withdrawn) rats infused with insulin to achieve plasma insulin concentrations of approximately 70 pM
Figure 5. Insulin and feeding abro-gate leptin’s effects to lower plasma glucose. (A and B) Plasma glucose and insulin during a glucose tolerance test in T1D rats with fasting plasma insulin of approximately 15 pM as compared with those with fasting plasma insulin of approximately 70 pM. (C–F) Plasma glucose, NEFA, βOHB, and anion gap before and after an infusion of insulin to achieve plasma concentrations of approximately 70 pM. (G–J) Plasma glucose, NEFA, βOHB, and anion gap in fed rats with food withdrawn at the start of the study, before and after an infusion of insulin to achieve plasma concentrations of approximately 70 pM. (A–C, and G) *P < 0.05, **P < 0.01, ***P < 0.001, ****P < 0.0001 between groups by 2-tailed unpaired Student’s
t test. (D–F and H–J) *P < 0.05, **P < 0.01, ****P < 0.0001 vs. the same group at time zero by 2-tailed paired Student’s t test. Data are the mean ± SEM of n = 6 per group (panels
(Supplemental Figure 4, A and B). Similar to what we observed in the fasted animals, despite leptin’s effect to suppress plasma corticosterone concentrations in these fed rats, leptin had no additional effect on plas-ma glucose, NEFA or βOHB concentrations, anion gap, whole-body glucose, fatty acid, glycerol, or βOHB turn-over or hepatic acetyl or malonyl CoA content, beyond the effect of insulin to suppress those parameters (Fig-ure 5, G–J and Supplemental Fig(Fig-ure 4, C–I).
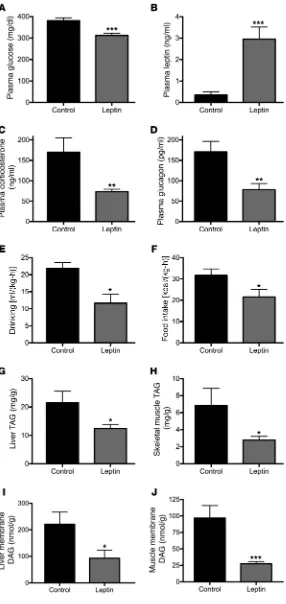
Chronic leptin treatment reduces hyperglycemia in a mouse model of T1D. In order to examine the
mech-anisms by which chronic leptin replacement therapy reverses hyperglycemia in nonketoacidotic diabet-ic rodents, we treated STZ-induced T1D mdiabet-ice with a 2-week subcutaneous infusion of either leptin or saline by ALZET pump. This intervention increased plasma leptin concentrations 6-fold and was associated with a 75 mg/dl reduction in 6-hour–fasted plasma glucose concentrations despite unchanged insulinopenia (Fig-ure 6, A and B, and Supplemental Fig(Fig-ure 5A). Chron-ic leptin treatment was also associated with a 30% reduction in plasma NEFA concentrations and 50% reductions in plasma corticosterone and glucagon concentrations (Figure 6, C and D, and Supplemental Figure 5B). Lower plasma glucose concentrations were associated with a 50% reduction in water drinking in leptin-treated mice, while their increase in plasma leptin and reductions in corticosterone and glucagon were also associated with a 30% suppression of food intake. Chronic leptin treatment had no effect on ener-gy expenditure, oxygen consumption, or carbon diox-ide production (Figure 6, E and F, and Supplemental Figure 5, C–G). However, the reductions in food intake in leptin-infused rats resulted in 50%–70% lower tri-acylglycerol (TAG) and ditri-acylglycerol (DAG) content in liver and skeletal muscle, without any difference in liver or muscle ceramide concentrations (Figure 6, G–J, and Supplemental Figure 5, H and I).
Discussion
[image:9.585.39.325.55.659.2]It is well established that leptin replacement therapy lowers plasma glucose concentrations in insulinope-nic rodent models of type 1 diabetes (1–8, 10, 13). The mechanism or mechanisms by which leptin mediates these acute and/or chronic effects remain unclear. We recently found that acute leptin replacement therapy reduces plasma glucose concentrations by suppressing plasma corticosterone concentrations, resulting in low-er rates of lipolysis, which in turn leads to reductions in hepatic acetyl CoA content and HGP in 3 rat models of poorly controlled diabetes (12). However, Morton et al. found that leptin as well as glucocorticoid receptor blockade had no effect on plasma glucose concentra-tions in a STZ-treated rat model of T1D and that adre-nalectomized T1D rats did not exhibit plasma glucose concentrations lower than those of nonadrenalecto-mized T1D rats (13). One possible explanation for the
1I), thus dissociating reversal of DKA from changes in this key regulator of CPT-I activity and hepatic fatty acid oxidation (16). We hypothesized that increased hepatic acetyl CoA, derived from increased lipolysis and fatty acid delivery to the liver, was the main driver of increased hepatic gluconeogenesis through activation of pyruvate carboxylase in the setting of DKA (12). Consistent with this hypothesis, leptin-treated T1D rats infused with acetate to match hepatic acetyl CoA concentrations to those of untreated T1D controls were hyperglycemic and ketotic without any chang-es in hepatic malonyl CoA content (Figure 3). Collectively, thchang-ese data directly implicate increases in hepatic acetyl CoA as a major driver of increased hepatic gluconeogenesis and demonstrate that increased hepatic ketogenesis in DKA is driven mostly by acute increases in fatty acid delivery to the liver and not by reductions in hepatic malonyl CoA content.
Next, we sought to understand why Morton et al. did not observe any chronic differences in plasma glucose concentrations in adrenalectomized STZ-induced diabetic rats (13). As expected, we found that adrenalectomized T1D rats had almost undetect-able plasma corticosterone concentrations and higher plasma ACTH concentrations than sham-operated T1D controls with-out any difference in plasma glucose concentrations when given drinking water containing sodium chloride, sucrose, and corti-costerone; however, within 1 hour of replacing this water mixture with water containing only sodium chloride, plasma glucose con-centrations rapidly decreased by 75 mg/dl and continued to fall to approximately 125 mg/dl within 4 hours of removal of the sucrose/ corticosterone water. This striking reduction of plasma glucose concentrations could be explained by reductions in whole-body glucose turnover driven by lower rates of lipolysis and hepatic ace-tyl CoA content and was accompanied by a reversal of DKA and suppression of βOHB turnover (Figure 4). However, infusion of corticosterone to match plasma concentrations in sham-operated T1D controls abrogated each of these effects of adrenalectomy. Taken together, these data demonstrate that hypercorticoste-ronemia is necessary for acute ketoacidosis and that insulinopenia alone is necessary but not sufficient to induce DKA.
Our data also suggest that the inability of Morton et al. to observe any glucose-lowering effect of adrenalectomy is likely the result of administering sucrose-containing water to their polydipsic diabetic adrenalectomized rats. In the aforementioned study, the authors state that variations in the amount of sucrose water intake did not affect glycemia in diabetic animals (13). However, Morton et al. did not assess plasma glucose concentrations in adrenalec-tomized diabetic rats in the absence of sucrose water. To examine this possibility, we studied adrenalectomized T1D rats maintained on water containing 1% sucrose and sodium chloride. Here, we found that, consistent with the findings of Morton et al. (13), pro-viding diabetic rats with sucrose water increased plasma glucose concentrations by more than 200 mg/dl relative to adrenalecto-mized diabetic rats given water containing only sodium chloride. Thus, in fed adrenalectomized diabetic rats, such as those given sucrose-containing water, suppression of hypercorticosteronemia is insufficient to normalize plasma glucose concentrations.
In addition to the striking effect of sucrose in the drinking water to abrogate the effect of glucocorticoid deficiency to decrease plas-ma glucose concentrations in diabetic rats, we also hypothesized different results could be differences in the diabetic rat model. In
contrast to our T1D rat model, which was severely insulinopenic (~15 pM), and in DKA, the Morton et al. STZ-induced rat model had basal insulin concentrations that were 4- to 5-fold higher (~70pM) than those in our T1D rat model. Furthermore, in contrast to our acute studies, which were all performed following a 12-hour over-night fast, many of the studies performed by Morton et al. were chronic studies in fed rats, or were performed in rats that had food removed for only 3 hours. In order to examine whether these dif-ferences in the diabetic rat models could account for the disparate findings as well as to further elucidate the insulin-independent mechanism by which leptin acutely reverses DKA, we performed a series of experiments of acute leptin replacement therapy under several conditions to replicate the conditions used in both studies.
First, in order to examine the mechanism by which leptin replacement therapy acutely reverses DKA in an insulin-indepen-dent manner, we examined the effects of leptin replacement ther-apy on rates of lipolysis, HGP, hepatic ketogenesis, hepatic acetyl CoA content, and malonyl CoA content in a rat model of STZ- induced DKA with plasma insulin concentrations of approximate-ly 15 pM. Consistent with our previous study (12) and that of Mor-ton et al. (13), STZ-induced diabetic rats exhibited hyperglycemia, hypoleptinemia, and hypercorticosteronemia compared with nor-mal rats not treated with STZ, all of which were reversed with an acute leptin infusion. Leptin’s acute effect to lower plasma glucose concentrations could be attributed to a greater than 40% reduc-tion in rates of HGP (Figure 1H). To understand the mechanism for this effect, we measured plasma glucagon, epinephrine, nor-epinephrine, and growth hormone concentrations as well as IGF-1 and found that acute leptin replacement therapy did not change concentrations of any of these hormones, in contrast to its effect of reducing plasma corticosterone concentrations by 50%. How-ever, replacing corticosterone in leptin-infused rats caused hyper-glycemia, which could be attributed to a 2-fold increase in rates of endogenous glucose production. These changes were associated with a doubling in rates of lipolysis and hepatic acetyl CoA content, but no change in malonyl CoA content (Figure 1 and Figure 2). Tak-en together, these data demonstrate that leptin-induced suppres-sion of plasma corticosterone concentration is necessary to medi-ate leptin’s acute insulin-independent effects to decrease rmedi-ates of HGP and reverse hyperglycemia in DKA.
To determine whether increased rates of lipolysis promote increased rates of HGP and ketogenesis in DKA, we next treated leptin- and corticosterone-infused rats with atglistatin, a small molecule inhibitor of ATGL. As expected, ATGL inhibition led to marked decreases in lipolysis, as reflected by acute reductions in rates of both palmitate and glycerol turnover. Reduced rates of lipolysis in turn resulted in an approximately 50% reduction in rates of HGP, ketogenesis, and hepatic acetyl-CoA content, thereby demonstrating that suppression of lipolysis is sufficient to reverse DKA. Taken together, these data demonstrate that leptin’s acute insulin-independent effect to reverse DKA is mediated by leptin-induced suppression of hypercorticosteronemia, resulting in reductions in lipolysis.
ered plasma glucose concentrations in 6-hour–food-withdrawn animals without affecting plasma insulin concentrations. The low-er plasma glucose concentrations exhibited by the leptin-treated mice were associated with reductions in both plasma corticoste-rone and glucagon, consistent with previous studies (8, 12). Chron-ic leptin treatment lowered both water drinking, consistent with lower plasma glucose concentrations throughout the day, and food intake, similar to its effect in humans with poorly controlled diabetes due to lipodystrophy (18), but did not affect activity or energy expenditure. As ectopic lipid content and, more impor-tantly, intracellular DAG content have been strongly implicated in causing insulin resistance in liver and skeletal muscle, the low-er plasma glucose concentrations in chronic leptin-infused mice can be attributed, at least in part, to lower liver and muscle DAG content and reversal of insulin resistance in these tissues (19–21). In contrast these glucose lowering effects of chronic leptin treat-ment occurred independently of any changes in liver and muscle ceramide content. Interestingly, a growing body of literature sug-gests that leptin may actually promote lipolysis by increasing cat-echolamine concentrations on a chronic basis in normal rodents, as reviewed recently by Ruud and Brüning (22). However, the fact that plasma NEFA concentrations actually dropped in our chronic leptin-treated T1D mice suggests that, in models of poorly con-trolled diabetes, the effect of leptin in suppressing HPA axis activi-ty in hypercorticosteronemic diabetic rodents trumps its potential to promote catecholamine release and would be consistent with the idea that suppression of HPA axis activity may not be central to leptin’s chronic effect to normalize glycemia in rodents with T1D. Taken together, our data combined with results from previ-ous studies suggest that the chronic effects of leptin to reduce both fasting and postprandial hyperglycemia in leptin-deficient diabet-ic rodents not in DKA are likely pleotropdiabet-ic and may have mini-mal dependence on suppression of the HPA axis. Based on these results, we hypothesize that the chronic effect of leptin can be attributed at least in part to its ability to (a) decrease hyperphagia, resulting in reductions in postprandial hyperglycemia; (b) lower ectopic lipid (DAG) content in liver and skeletal muscle, resulting in reversal of insulin resistance in these organs (7, 18); (c) reduce plasma corticosterone concentrations; and (d) reduce plasma glu-cagon concentrations (1, 8, 23–25). All of these chronic changes will also result in reductions in glucose toxicity, which will further improve insulin responsiveness in liver and skeletal muscle and enhance pancreatic β cell activity (26, 27).
In summary, we examined the acute insulin-independent effects of leptin replacement therapy in an STZ-induced rat model of DKA and found that (a) hypercorticosteronemia is necessary to cause increased rates of lipolysis, HGP, and hepatic ketogenesis in DKA; (b) leptin’s acute insulin-independent ability to reverse DKA is mediated by suppression of the HPA axis, resulting in reductions in hypercorticosteronemia; (c) relatively low concentrations of insu-lin (~70 pM) are sufficient to suppress lipolysis, hepatic acetyl CoA, and HGP and abrogate the acute effects of leptin to reduce plasma glucose concentrations in a rat model of poorly controlled T1D; (d) reversal of DKA by leptin and insulin is mostly driven by reduction in rates of lipolysis and independent of any changes in hepatic mal-onyl CoA content; and (e) surprisingly, as demonstrated in the adre-nalectomized T1D rats, insulinopenia per se is necessary but not that the 5-fold higher plasma insulin concentrations (~70 pM) in
the STZ-treated diabetic rat model studied by Morton et al. may have also contributed to their inability to detect any effects of acute leptin treatment on plasma glucose concentrations (13). T1D rats with fasting plasma insulin concentrations of approximately 70 pM retain the ability to secrete substantial amounts of insulin in response to a glucose challenge, unlike insulinopenic rats with fast-ing plasma insulin concentrations of approximately 15 pM, which do not increase following a glucose challenge, demonstrating the absence of any pancreatic β cell reserve in our diabetic rodent mod-el. Importantly, rats with fasting plasma insulin concentrations of approximately 70 pM are not in DKA, as indicated by their lower
βOHB concentrations and normal anion gap. To further clarify this point, we infused insulin to increase plasma insulin concentra-tions from approximately 15 to approximately 70 pM in overnight- fasted T1D rats. We found that this intervention acutely suppressed lipolysis, hepatic acetyl CoA, HGP, and plasma glucose concentra-tions. In the setting of approximately 70 pM insulin, leptin had a very modest effect on plasma glucose and corticosterone and no additional effect on lipolysis, similar to Morton et al.’s data (13) and demonstrating that the effect of insulin to suppress hypercor-ticosteronemia, lipolysis, and HGP nullifies any additional effect of leptin to further suppress these parameters. Similarly, and con-sistent with our data in adrenalectomized rats given sucrose water, leptin replacement therapy had no additional effect of lowering plasma glucose, glucose turnover, lipolysis, ketosis, or hepatic ace-tyl CoA in fed rats, again consistent with the findings of Morton et al. (13) and suggesting that the chronic effects of leptin in the post-prandial state are minimally or not at all reliant upon suppression of hypothalamic-pituitary-adrenal (HPA) axis activity. These data demonstrate that insulin — even insulin concentrations insufficient to achieve euglycemia — will nullify the effects of hypercorticoste-ronemia to stimulate lipolysis, HGP, and hyperglycemia and like-ly explain the inability of Morton et al. to observe an acute effect of leptin to reduce hyperglycemia in their diabetic rat studies. In addition, and in contrast to this and our previous studies (12, 17), Morton et al. did not assess metabolite turnover or liver metabolite concentrations, so it is impossible to determine whether leptin had any effect on rates of lipolysis, rates of HGP, rates of hepatic keto-genesis, or hepatic acetyl CoA content in their studies (13). Thus, the lack of an effect of leptin in these animals may represent an inability of leptin to reverse postprandial hyperglycemia, which is mostly an insulin-dependent condition, and/or to suppress lipoly-sis beyond the extent to which it is already suppressed by insulin concentrations of approximately 70 pM (17).
The results from our studies and those of Morton et al. clear-ly demonstrate that leptin has little to no acute effect on plasma glucose in diabetic rats that have plasma insulin concentrations of 70 pM or more and are not in DKA. Thus, the acute mechanism of action of leptin to reverse DKA by suppression of HPA axis activity is unlikely to explain the chronic glucose-lowering effect of leptin observed by other groups in diabetic rodents that are not com-pletely insulin deficient and not in DKA (1–3, 7).
low-To study rats with modest insulinopenia, a lower dose (40 mg/ kg) of STZ was used to induce diabetes using the same timeline as described above, and hyperglycemic (fasting plasma glucose ≥ 300 mg/dl) rats were later divided into groups with fasting plasma insu-lin of approximately 15 pM (≤ 20 pM) or approximately 70 pM (> 60 pM). They underwent a glucose tolerance test with i.v. administration of 1 g/kg dextrose at time zero. Plasma was obtained through a venous catheter at the time points indicated, and plasma glucose and insulin were measured as described above.
Mice were obtained from The Jackson Laboratory at 8 weeks of age and allowed to acclimate for 1 week before they were treated with an i.p. injection of STZ (125 mg/kg). Three days later, those with fed blood glucose concentrations of more than 300 mg/dl were random-ized to receive placement of an ALZET 1004 pump containing either leptin or saline, which infused leptin at a rate of 0.624 μg/h. During the second week of the leptin infusion, the mice underwent CLAMS met-abolic cage analysis to measure daily eating, drinking, activity, oxygen consumption, carbon dioxide production, respiratory exchange ratio, and energy expenditure. After 2 weeks of leptin or saline infusion, fol-lowing a 6-hour–food-withdrawal period (8 am to 2 pm), mice were sacrificed under isoflurane anesthesia. Blood was obtained from the aorta using a syringe, and liver and skeletal muscle (gastrocnemius + soleus) were isolated.
Tracer infusions. For the last 2 hours of the infusion studies, all rats were infused continuously with 4 tracers concurrently:
[1,2,3,4,5,6,6-2H
7] glucose (0.1 mg/[kg-min], Cambridge Isotopes), [13C4] βOHB (0.1
mg/[kg-min], Cambridge Isotopes), [13C
16] potassium palmitate (0.2
mg/[kg-min], Cambridge Isotopes), and [1,1,2,3,3-2H
5] glycerol (0.1
mg/[kg-min], Cambridge Isotopes) for 120 minutes. Tracers were infused through the arterial catheter and blood sampled through the venous, following the optimal method described for tracer infusion studies (28–30). The blood sample taken at the last time point, after 120 minutes of tracer infusion, was used to measure steady-state plas-ma enrichment of each metabolite of interest, from which the turn-over rate of the metabolite could be calculated.
Acute leptin and corticosterone infusions. T1D rats were random-ized using a random number generator to receive control (saline) or leptin with or without corticosterone infusions. Rats were treated with a 6-hour continuous infusion of leptin (0.125 mg/kg total) or an equivalent volume of saline (0.1875 ml) starting at 8 am and con-cluding at 2 pm. A subgroup of leptin-treated rats were coinfused with corticosterone (12.5 mg/kg total) continuously during the 6-hour leptin infusion. In this and all other leptin infusion studies, blood (200 μl whole blood) was drawn through the venous catheter hourly into a heparin-lithium-aprotinin–coated tube and centrifuged imme-diately; plasma was isolated and stored at -80°C, awaiting further analysis. The same protocol was used to treat adrenalectomized rats with corticosterone for their 4-hour period of study after removal of their sucrose and corticosterone water. In all cases, substrates and hormones were infused through the arterial catheter and blood was drawn through the venous catheter to avoid any contamination of the blood in which we planned to measure concentrations of the sub-stance or subsub-stances being infused.
Insulin infusions. Groups of fed (3-hour food withdrawn) and over-night-fasted rats were infused with a primed-continuous infusion of insulin (4 mU/kg prime, 0.4 mU/[kg-min] continuous infusion) through the duration of a 6-hour infusion of leptin or saline as described above.
sufficient to cause DKA. These data demonstrate that suppression of hypercorticosteronemia, lipolysis, and hepatic acetyl CoA medi-ates leptin’s acute insulin-independent effect to reverse DKA.
In contrast, we found that the chronic effects of leptin to reduce both fasting and postprandial hyperglycemia in leptin- deficient diabetic rodents not in DKA are likely pleotropic and can be attributed at least in part to leptin’s ability to decrease hyper-phagia, resulting in reductions in postprandial hyperglycemia and ectopic lipid content in liver and skeletal muscle that in turn result in reversal of insulin resistance in these organs as well as chronic reductions in plasma glucagon and corticosterone concentrations. Taken together, these studies demonstrate marked differences in the acute insulin-independent effects by which leptin reverses fasting hyperglycemia and ketoacidosis in a rat model of DKA ver-sus the chronic effects by which leptin reverses hyperglycemia in a less insulinopenic, non-DKA rodent model of T1D. Furthermore, these results resolve the discordant findings between our studies examining the glucose-lowering effects of leptin to reverse DKA in the absence of insulin (12) and studies examining the chronic effects of leptin to reduced hyperglycemia in diabetic rodents that still retain some β cell reserve (13).
Methods
Animals. Male Sprague-Dawley rats weighing approximately 350 g were ordered from Charles River Laboratories and were allowed to acclimate for 1 week before undergoing surgery under general iso-flurane anesthesia to place polyethylene catheters in the jugular vein with the tip advanced to the right atrium and in the carotid artery (PE90 and PE50 tubing, respectively; Instech Laboratories). Adre-nalectomized rats were obtained from Harlan and were given ad libi-tum access to water containing 2% sucrose, 0.9% sodium chloride, and 25 μg/ml corticosterone (all from Sigma-Aldrich). In surgery, the rats were given an injection of 1 ml of this solution, and the concen-trations of these agents in the water were doubled for 48 hours after surgery to provide stress dose coverage. Adrenalectomized rats had their food withdrawn overnight prior to study, but they continued to receive sucrose and corticosterone in their water until the morning of the study (8 am), when they had their sucrose-corticosterone-saline water replaced with water containing 0.9% sodium chloride only or 1% sucrose and 0.9% sodium chloride, as indicated in Figure 4 and Supplemental Figure 3 legends. They were observed continuously, and plasma glucose was measured hourly after removal of the sucrose and/or corticosterone from their water.
lin (Mercodia; 10-1250 [rat] and 10-1247 [mouse]), leptin (Abcam; ab100773 [rat] and ab100718 [mouse]), corticosterone (Abcam; ab108821), ACTH (MyBioSource; MBS2502683), epinephrine (Abno-va; KA1877), norepinephrine (Abno(Abno-va; KA1877), growth hormone (Mil-lipore; EZRMGH-45K), IGF-1 (R&D Systems; MG100), and glucagon (Sigma-Aldrich; RAB0202) concentrations were measured by ELISA. Plasma NEFA concentrations were measured spectrophotometrically using the Wako Diagnostics NEFA Kit (HR Series NEFA-HR; ref. 2). Plasma βOHB, sodium, potassium, and chloride concentrations were measured by COBAS. The anion gap was measured using the following equation: anion gap = [Na+] +[K+] − ([HCO3−] +[Cl−]). Plasma acetate
concentrations were measured by GC/MS: 25 μl plasma was spiked with an equal volume of [2H] sodium acetate (0.5 mM) and
acidi-fied with 50 μl 1 M HCl. After shaking for 20 minutes, samples were derivatized with 40 μmol 1,3-dicyclohexylcarlodiimide and 40 μmol 2,4-difluoroaniline (both from Sigma-Aldrich), shaken for 1 hour, and dried under N2 gas. Samples were then resuspended in ethyl acetate (Sigma-Aldrich), and peak areas (m/z 171 [m+0] and 174 [m+4]) were measured by GC/MS (EI mode).
Hepatic acetyl and malonyl CoA concentrations were measured by liquid chromatography–MS/MS (LC-MS/MS) as described (15). Liver and skeletal muscle triglyceride content were measured in diabetic mice enzymatically using the method of Bligh and Dyer (31), and ceramide concentrations were measured by LC-MS/MS as previously described (32).
Statistics. All statistical analysis was performed and figures were gen-erated using GraphPad Prism. Comparisons of 2 groups were performed using the 2-tailed unpaired Student’s t test, and comparisons of 3 or 4 groups were performed using Bonferroni’s multiple comparisons test.
Study approval. All animal experiments were approved by the Yale University Institutional Animal Care and Use Committee.
Author contributions
RJP and GIS designed the study. All authors performed experi-ments and analyzed data. The manuscript was written by RJP and GIS with input from all authors.
Acknowledgments
We thank Jianying Dong, Xian-Man Zhang, Mario Kahn, Irina Smolgovsky, John Stack, Gina Butrico, and Ali Nasiri for their expert technical assistance. This study was funded by the follow-ing grants from the US Public Health Service: R01 DK40936, U2C DK059635, P30 DK45735, T32 DK101019.
Address correspondence to: Gerald I. Shulman, PO Box 208020, 333 Cedar Street, New Haven, Connecticut, 06520-8020, USA. Phone: 203.785.5447; E-mail: gerald.shulman@yale.edu.
Acetate infusions. Separate groups of T1D rats were infused with leptin as described above or leptin plus acetate [75 μmol/(kg-min)] for the 6-hour duration of the leptin infusion (8 am to 2 pm) or for the last 2 hours of the leptin infusion.
Atglistatin treatment. Fifteen minutes prior to beginning a 6-hour infusion of leptin plus corticosterone, as described above, we injected atglistatin (200 μmol/kg, Xcess Biosciences) in 500 μl saline. In order to solubilize the drug, we added 50 mg Cremophor (Sigma-Aldrich) and 100 μl 1 M HCl, adjusted the pH to approximately 7.0 with drop-wise addition of Tris base (Sigma-Aldrich), vortexed, and checked the pH with pH strips after each addition of base. We then sonicated the solution for 10 minutes in a 37°C water bath. The solution was injected i.p. immediately after solubilizing and cooling to 25°C.
Flux analysis. Plasma samples were deproteinized and derivatized to measure [2H] glucose and glycerol enrichment as follows. 100 μl
methanol (Sigma-Aldrich) was added to 20 μl plasma,which was cen-trifuged, and the resulting supernatant was dried under N2 gas. The sample was then derivatized in 75 μl acetic anhydride/pyridine (1:1, both from Sigma-Aldrich), heated to 65°C for 20 minutes, and after cooling to room temperature and adding 25 μl methanol, m+7 [2H]
glucose enrichment was assessed by gas chromatography–mass spec-trometry (GC/MS) (chemical ionization [CI] mode, mass to charge ratio [m/z] 331 [m+0] and 338 [m+7]). [2H] glycerol enrichment was
subsequently assessed in the same samples, also using GC/MS (elec-tron ionization [EI] mode, m/z 145 [m+0] and 148 [m+5]).
βOHB enrichment was also measured by GC/MS. Samples (25 μl plasma) were dried under N2 gas and derivatized with 75 μl N-butanol 4N HCl (both from Sigma-Aldrich), then heated for 30 minutes at 60°C and dried overnight in a 60°C vacuum oven. The following day, the samples were reacted with 100 μl of trifluoroacetic acid (Thermo Fisher Scientific) and methylene chloride (Sigma-Aldrich) (1:7). [13C
4] βOHB enrichment
was measured by GC/MS (EI mode, m/z 257 [m+0] and 261 [m+4]). Palmitate enrichment was measured by GC/MS. Plasma samples (25 μl) were dried in a glass scintillation vial under N2 gas and dissolved in 750 μl 1:1 chloroform/methanol (both from Sigma-Aldrich). Then 250 μl boron trifluoride-methanol (Sigma-Aldrich) was added, and the vial was heated to 100°C for 5 minutes. After cooling, 1 ml pentane was added and the samples were vortexed for 1 minute, then centrifuged at 2000 g for 5 minutes. The upper layer was transferred to a new glass vial using a Pasteur pipette and dried under N2 gas. The sample was then resuspended in 100 μl hexane (Sigma-Aldrich), and enrichment was measured by GC/MS (CI mode, m/z 271 [m+0] and 287 [m+16]).
For all metabolites, turnover was calculated using the following equation: turnover = [(tracer enrichment/plasma enrichment) – 1] × infusion rate.
Hormones and substrates. Plasma glucose concentrations were measured enzymatically using the YSI Glucose Analyzer. Plasma
1. Yu X, Park BH, Wang MY, Wang ZV, Unger RH. Making insulin-deficient type 1 diabetic rodents thrive without insulin. Proc Natl Acad Sci U S A. 2008;105(37):14070–14075.
2. Fujikawa T, Chuang JC, Sakata I, Ramadori G, Coppari R. Leptin therapy improves insulin- deficient type 1 diabetes by CNS-dependent mechanisms in mice. Proc Natl Acad Sci U S A. 2010;107(40):17391–17396.
3. Hidaka S, et al. Chronic central leptin infusion
restores hyperglycemia independent of food intake and insulin level in streptozotocin-induced diabetic rats. FASEB J. 2002;16(6):509–518. 4. Lin CY, Higginbotham DA, Judd RL, White BD.
Central leptin increases insulin sensitivity in streptozotocin-induced diabetic rats. Am J Physiol
Endocrinol Metab. 2002;282(5):E1084–E1091.
5. Fujikawa T, et al. Leptin engages a hypothalamic neurocircuitry to permit survival in the absence of insulin. Cell Metab. 2013;18(3):431–444.
6. Meek TH, et al. Leptin action in the ventrome-dial hypothalamic nucleus is sufficient, but not necessary, to normalize diabetic hyperglycemia.
Endocrinology. 2013;154(9):3067–3076.
7. Chinookoswong N, Wang JL, Shi ZQ. Leptin restores euglycemia and normalizes glucose turnover in insulin-deficient diabetes in the rat.
Diabetes. 1999;48(7):1487–1492.
2010;107(11):4813–4819.
9. Park JY, et al. Type 1 diabetes associated with acquired generalized lipodystrophy and insulin resistance: the effect of long-term leptin therapy.
J Clin Endocrinol Metab. 2008;93(1):26–31.
10. Xu Y, Chang JT, Myers MG, Xu Y, Tong Q. Eug-lycemia restoration by central leptin in type 1 diabetes requires STAT3 signaling but not fast-acting neurotransmitter release. Diabetes. 2016;65(4):1040–1049.
11. Foster DW. Malonyl-CoA: the regulator of fatty acid synthesis and oxidation. J Clin Invest. 2012;122(6):1958–1959.
12. Perry RJ, et al. Leptin reverses diabetes by sup-pression of the hypothalamic-pituitary-adrenal axis. Nat Med. 2014;20(7):759–763.
13. Morton GJ, Meek TH, Matsen ME, Schwartz MW. Evidence against hypothalamic-pituitary-adrenal axis suppression in the antidiabetic action of leptin. J Clin Invest. 2015;125(12):4587–4591. 14. Mayer N, et al. Development of small-molecule
inhibitors targeting adipose triglyceride lipase.
Nat Chem Biol. 2013;9(12):785–787.
15. Perry RJ, et al. Hepatic acetyl CoA links adipose tissue inflammation to hepatic insulin resistance and type 2 diabetes. Cell. 2015;160(4):745–758. 16. McGarry JD, Mannaerts GP, Foster DW. A pos-sible role for malonyl-CoA in the regulation of hepatic fatty acid oxidation and ketogenesis.
J Clin Invest. 1977;60(1):265–270.
17. Perry RJ, Lee S, Ma L, Zhang D, Schlessinger J, Shulman GI. FGF1 and FGF19 reverse diabetes by suppression of the hypothalamic-pituitary- adrenal axis. Nat Commun. 2015;6:6980. 18. Petersen KF, et al. Leptin reverses insulin resistance and hepatic steatosis in patients with severe lipodystrophy. J Clin Invest. 2002;109(10):1345–1350.
19. Shulman GI. Ectopic fat in insulin resistance, dys-lipidemia, and cardiometabolic disease. N Engl J
Med. 2014;371(12):1131–1141.
20. Samuel VT, Shulman GI. The pathogenesis of insu-lin resistance: integrating signainsu-ling pathways and substrate flux. J Clin Invest. 2016;126(1):12–22. 21. Petersen MC, et al. Insulin receptor Thr1160
phosphorylation mediates lipid-induced hepatic insulin resistance. J Clin Invest. 2016;126(11):4361–4371.
22. Ruud J, Brüning JC. Metabolism: Light on leptin link to lipolysis. Nature. 2015;527(7576):43–44. 23. Cummings BP, et al. Subcutaneous administra-tion of leptin normalizes fasting plasma glucose in obese type 2 diabetic UCD-T2DM rats. Proc
Natl Acad Sci U S A. 2011;108(35):14670–14675.
24. Denroche HC, et al. Leptin therapy reverses hyperglycemia in mice with streptozotocin- induced diabetes, independent of hepatic leptin signaling. Diabetes. 2011;60(5):1414–1423. 25. Kim GH, Szabo A, King EM, Ayala J, Ayala JE,
Altarejos JY. Leptin recruits Creb-regulated
transcriptional coactivator 1 to improve hypergly-cemia in insulin-deficient diabetes. Mol Metab. 2015;4(3):227–236.
26. Rossetti L, Shulman GI, Zawalich W, DeFronzo RA. Effect of chronic hyperglycemia on in vivo insulin secretion in partially pancreatectomized rats. J Clin Invest. 1987;80(4):1037–1044. 27. Rossetti L, Smith D, Shulman GI, Papachristou D,
DeFronzo RA. Correction of hyperglycemia with phlorizin normalizes tissue sensitivity to insulin in diabetic rats. J Clin Invest. 1987;79(5):1510–1515. 28. Layman DK, Wolfe RR. Sample site selection for
tracer studies applying a unidirectional circulatory approach. Am J Physiol. 1987;253(2 Pt 1):E173–E178. 29. Katz J. On the determination of turnover in
vivo with tracers. Am J Physiol. 1992; 263(3 Pt 1):E417–E424.
30. Katz J, Okajima F, Chenoweth M, Dunn A. The determination of lactate turnover in vivo with 3H- and 14C-labelled lactate. The significance of sites of tracer administration and sampling.
Biochem J. 1981;194(2):513–524.
31. Bligh EG, Dyer WJ. A rapid method of total lipid extraction and purification. Can J Biochem
Physi-ol. 1959;37(8):911–917.