interleukin-13 in mice
Kristopher J. Stanya, … , Andrew N.J. McKenzie, Chih-Hao
Lee
J Clin Invest. 2013;
123(1)
:261-271.
https://doi.org/10.1172/JCI64941
.
Hyperglycemia is a result of impaired insulin action on glucose production and disposal,
and a major target of antidiabetic therapies. The study of insulin-independent regulatory
mechanisms of glucose metabolism may identify new strategies to lower blood sugar levels.
Here we demonstrate an unexpected metabolic function for IL-13 in the control of hepatic
glucose production. IL-13 is a Th2 cytokine known to mediate macrophage alternative
activation. Genetic ablation of Il-13 in mice (Il-13
–/–) resulted in hyperglycemia, which
progressed to hepatic insulin resistance and systemic metabolic dysfunction. In Il-13
–/–mice, upregulation of enzymes involved in hepatic gluconeogenesis was a primary event
leading to dysregulated glucose metabolism. IL-13 inhibited transcription of gluconeogenic
genes by acting directly on hepatocytes through Stat3, a noncanonical downstream effector.
Consequently, the ability of IL-13 to suppress glucose production was abolished in liver
cells lacking Stat3 or IL-13 receptor a1 (Il-13ra1), which suggests that the IL-13Ra1/Stat3
axis directs IL-13 signaling toward metabolic responses. These findings extend the
implication of a Th1/Th2 paradigm in metabolic homeostasis beyond inflammation to direct
control of glucose metabolism and suggest that the IL-13/Stat3 pathway may serve as a
therapeutic target for glycemic control in insulin resistance and type 2 diabetes.
Research Article
Find the latest version:
Research article
Direct control of hepatic glucose production
by interleukin-13 in mice
Kristopher J. Stanya,1 David Jacobi,1,2 Sihao Liu,1 Prerna Bhargava,1 Lingling Dai,1,3
Matthew R. Gangl,1 Karen Inouye,1 Jillian L. Barlow,4 Yewei Ji,5 Joseph P. Mizgerd,6
Ling Qi,5 Hang Shi,7 Andrew N.J. McKenzie,4 and Chih-Hao Lee1
1Department of Genetics and Complex Diseases, Division of Biological Sciences, Harvard School of Public Health, Boston, Massachusetts, USA. 2CHRU de Tours, Service de Médecine Interne-Nutrition, INSERM U1069, Université François Rabelais, Tours, France. 3Pharmacogenetics Research Institute,
Institute of Clinical Pharmacology, Central South University, Changsha, Hunan, People’s Republic of China. 4MRC Laboratory of Molecular Biology, Cambridge,
United Kingdom. 5Division of Nutritional Science, Cornell University, Ithaca, New York, USA. 6Pulmonary Center, Boston University School of Medicine,
Boston, Massachusetts, USA. 7Department of Internal Medicine, Wake Forest Health Sciences, Winston-Salem, North Carolina, USA.
Hyperglycemia is a result of impaired insulin action on glucose production and disposal, and a major
tar-get of antidiabetic therapies. The study of insulin-independent regulatory mechanisms of glucose
metabo-lism may identify new strategies to lower blood sugar levels. Here we demonstrate an unexpected metabolic
function for IL-13 in the control of hepatic glucose production. IL-13 is a Th2 cytokine known to
medi-ate macrophage alternative activation. Genetic ablation of Il-13 in mice (Il-13
–/–) resulted in
hyperglyce-mia, which progressed to hepatic insulin resistance and systemic metabolic dysfunction. In Il-13
–/–mice,
upregulation of enzymes involved in hepatic gluconeogenesis was a primary event leading to dysregulated
glucose metabolism. IL-13 inhibited transcription of gluconeogenic genes by acting directly on hepatocytes
through Stat3, a noncanonical downstream effector. Consequently, the ability of IL-13 to suppress glucose
production was abolished in liver cells lacking Stat3 or IL-13 receptor
α
1 (Il-13r
α
1), which suggests that the
IL-13R
α
1/Stat3 axis directs IL-13 signaling toward metabolic responses. These findings extend the
implica-tion of a Th1/Th2 paradigm in metabolic homeostasis beyond inflammaimplica-tion to direct control of glucose
metabolism and suggest that the IL-13/Stat3 pathway may serve as a therapeutic target for glycemic control
in insulin resistance and type 2 diabetes.
Introduction
Loss of postprandial glycemic control followed by fasting hyper-glycemia is a hallmark of type 2 diabetes (1, 2). The resulting gluco-toxicity contributes to metabolic complications, such as pancreatic
β cell death and vascular dysfunction (3). Therefore, identification of therapeutic approaches to improve glycemic management will be beneficial for diabetes and related metabolic diseases.
Glucose homeostasis is achieved through tight regulation of its production and utilization. In healthy individuals, these 2 process-es are balanced to maintain blood glucose within a narrow physi-ological range. The liver is the main tissue for glucose production, and the regulation of hepatic gluconeogenic genes, including pyruvate carboxylase (Pcx), phosphoenolpyruvate carboxykinase (Pepck), fructose-1,6-bisphosphatase (Fbp1), and glucose-6-phos-phatase (G6p) has been extensively studied. During fasting, glu-coneogenic genes are induced in the liver by several transcription factors, including forkhead box protein O1 (FOXO1), PPARγ
coactivator–1α (PPARGC1α), and cAMP response element–bind-ing protein (CREB) and its coactivators, CREB-bindelement–bind-ing protein/ p300 (CBP/p300) and cAMP-regulated transcriptional coactiva-tors (CRTCs) (4, 5). Conversely, in states of abundant glucose, such as after a meal, insulin suppresses hepatic glucose production through AKT kinases that trigger nuclear exclusion of FOXO1 and CRTC2 in a phosphorylation-dependent manner, thereby relieving transcriptional activities of FOXO1 and CREB (4–6). Transcrip-tional repression of gluconeogenesis is less understood, although
STAT3 has been implicated in this process (7, 8). Interestingly, it has been shown that downregulation of hepatic gluconeogenic genes by feeding is maintained in mice lacking Akt1/2 and FoxO1
in the liver (9), indicative of the existence of additional, uncharac-terized mechanisms controlling gluconeogenesis (6).
In addition to normal physiological regulation, recent evidence suggests that glucose homeostasis is also modulated by chronic inflammation associated with metabolic stress (10, 11). Genetic models in mice have demonstrated that deletion of key inflam-matory mediators improves glucose tolerance in obesity-induced insulin resistance (12). The detrimental effects of proinflamma-tory pathways, most notably those triggered by Th1 cytokines (e.g., IFN-γ, TNF-α, and IL-1β), on glucose homeostasis are achieved partly through inhibitory serine phosphorylation of IRS1 by JNK. In turn, uncontrolled hyperglycemia could further contribute to chronic inflammation. For example, the activity of NF-κB is increased through O-GlcNAc modification under high-glucose conditions (13). NF-κB is a primary transcription factor down-stream of Th1 cytokines, and its activation in the liver promotes systemic insulin resistance (14, 15). Consequently, increased activities of Th2 cytokines (e.g., IL-4 and IL-13) skew the immune response to a Th2 phenotype (16) and restore glucose homeosta-sis (17–21). Th2 cytokines activate several downstream effectors, including STAT6, PPARγ, and PPARδ, to induce macrophage alter-native activation, which dampens inflammation. The Th1/Th2 (or M1/M2) paradigm is thought to play a major role in the progres-sion of white adipose tissue (WAT) inflammation and dysfunction in obesity (22, 23). However, it is unclear whether Th2 cytokines directly interact with metabolic pathways to modulate systemic glucose and lipid homeostasis.
Authorship note: Sihao Liu and Prerna Bhargava contributed equally to this work. Conflict of interest: The authors have declared that no conflict of interest exists. Citation for this article:J Clin Invest. 2013;123(1):261–271. doi:10.1172/JCI64941.
We previously reported that appreciable amounts of IL-13, but not IL-4, were detected in the liver and WAT (17). Several sources of tissue Th2 cytokines have since been identified, including CD4+ T lymphocytes, eosinophils, type I NKT cells (i.e., αGalCer
loaded and CDd reactive), nonimmune cells, and a new class of innate lymphoid-2 cells (ILC2 cells; including nuocytes, Ih2 cells, and natural helper cells) and multipotent progenitor type 2 (MPPtype2) cells (17, 21, 24–29). In the current study, we sought
to determine the role of IL-13 in metabolic regulation. Our data revealed a previously unrecognized IL-13/STAT3 pathway in the control of hepatic glucose metabolism.
Results
C57BL/6 Il-13–/– mice show glucose intolerance and insulin
resis-tance on normal chow diet. IL-13 binds to the IL-13 receptor α1 (IL-13Rα1) subunit of the type II receptor complex consist-ing of an IL-13Rα1/IL-4Rα dimer (30). Both IL-13Rα1 and IL-4Rα were found to be expressed in nonimmune cells, such as hepatocytes (Supplemental Figure 1A; supplemental material
available online with this article; doi:10.1172/JCI64941DS1), indicative of potential metabolic functions for IL-13. In light of this observation, we used male Il-13–/– mice on the C57BL/6
background as a genetic model to examine the effect of IL-13 depletion on metabolic homeostasis. On normal chow diet (9% fat), C57BL/6 Il-13–/– mice progressively gained more weight
over a 9-month period than did WT animals (Figure 1A), although fat mass (determined by dual-energy X-ray absorpti-ometry; DEXA) was not significantly different. Metabolic cage analyses performed on 4-month-old mice, prior to body weight divergence, revealed that C57BL/6 Il-13–/– mice had reduced
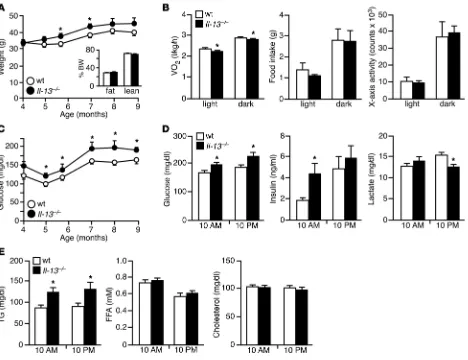
[image:3.585.56.524.82.442.2]oxygen consumption during both day (light cycle; fasting state) and night (dark cycle; feeding state), with no difference in food intake and physical activity compared with control mice (Fig-ure 1B). Interestingly, Il-13 gene deletion led to increased fast-ing glucose levels (6-hour fast) that were detected at 4 months and peaked at 7 months of age (Figure 1C). Blood chemistries at the latter time point were further analyzed at 10 am and 10 pm without disturbance of sleep/wake cycles (corresponding
Figure 1
Il-13–/– mice show increased body weight and blood glucose levels. (A) Body weight in normal chow–fed WT and Il-13–/– mice (C57BL/6 back-ground; n = 7–10 per genotype). Inset: body composition at 7 months of age, determined by DEXA. (B) Reduced O2 consumption, but normal
research article
to the natural fasting and feeding states, respectively), which demonstrated that glucose concentrations of C57BL/6 Il-13–/–
mice were also elevated during the fed state, when lactate pro-duction was reduced (10 pm; Figure 1D). Insulin concentrations during the fasted state (10 am) were increased. In addition, C57BL/6 Il-13–/– mice exhibited higher circulating TG levels,
but normal FFA and cholesterol levels (Figure 1E).
The increase in blood glucose and insulin levels indicated that
Il-13 depletion causes dysregulated glucose metabolism. In fact, glucose tolerance test (GTT) and insulin tolerance test (ITT) showed that C57BL/6 Il-13–/– mice were glucose intolerant and
[image:4.585.44.542.82.522.2]had reduced insulin sensitivity compared with control mice (Fig-ure 2, A and B). Euglycemic-hyperinsulinemic clamp was per-formed to further characterize the defect in glucose homeostasis.
Figure 2
Il-13–/– mice develop hepatic insulin resistance and systemic metabolic dysfunction on normal chow. (A and B) GTT (A) and ITT (B) of 7- to 8-month-old chow-fed WT and Il-13–/– mice (C57BL/6 background; n = 7–10 per genotype). (C) Euglycemic-hyperinsulinemic clamp demon-strated that Il-13–/– mice were more insulin resistant than WT controls. GIR, glucose infusion rate; HGP, hepatic glucose production (basal and during clamp); GDR, glucose disposal rate. (D) Following the clamp, WT and Il-13–/– mice were given 2-deoxy-d-[1-14C]glucose to determine
tissue glucose uptake. (E) Immunoblotting of tissue insulin signaling, assessed by insulin-stimulated AKT phosphorylation. Liver, muscle, and
WAT were collected following the clamp. Representative tissue samples from 4 individual mice are shown. Samples of the same tissue were run on the same gel but were noncontiguous (white lines). Quantification of immunoblot is also shown. t-AKT, total AKT. (F) Immunoblotting showed
insulin-stimulated IRS1 tyrosine phosphorylation in the liver. Quantification of hepatic glycogen content is also shown. (G) Liver histology was
C57BL/6 Il-13–/– mice required less exogenous glucose to
main-tain euglycemia (as demonstrated by a reduced glucose infusion rate), due to their increased hepatic glucose production — both at the basal level and during the clamp — and reduced glucose disposal (Figure 2C). Furthermore, glucose uptake was decreased in both muscle and WAT (Figure 2D). Tissue-specific insulin signaling was assessed by insulin-stimulated AKT phosphoryla-tion. C57BL/6 Il-13–/– muscle and WAT showed decreased levels
of phosphorylated AKT (p-AKT) compared with control animals (Figure 2E). The strongest reduction in p-AKT was observed in C57BL/6 Il-13–/– livers, where glycogen content and
insulin-induced tyrosine phosphorylation of IRS1 were also lower, while fat accumulation was elevated (Figure 2, F and G). These observa-tions suggest that C57BL/6 Il-13–/– mice exhibit systemic
meta-bolic dysregulation with severe hepatic insulin resistance.
BALB/c Il-13–/– mice develop hyperglycemia on high-fat diet. We next
sought to determine the effect of Il-13 deficiency in the BALB/c genetic background. BALB/c mice exhibit a much stronger Th2 response (accompanied by a weak Th1 response) and are less prone to develop metabolic diseases than are C57BL/6 mice (31, 32). Chow-fed BALB/c Il-13–/– mice had normal body weight and
glu-cose metabolism up to 6 months of age (Supplemental Figure 1, B and C). On high-fat diet (35% fat), BALB/c Il-13–/– mice had elevated
concentrations of fasting glucose and TG, whereas weight gain and fasting insulin remained similar to those of control animals (Fig-ure 3A and Supplemental Table 1). Elevated glucose concentrations were evident throughout the 2-hour period of both GTT and ITT (Figure 3, B and C). Pyruvate tolerance test (PTT) demonstrated that BALB/c Il-13–/– mice also exhibited increased hepatic glucose
production (Figure 3D). Consistent with the dysregulated glucose metabolism, glycogen content was decreased, whereas TG content
was increased, in both liver and muscle of BALB/c Il-13–/– mice
(Fig-ure 3, E and F). Notably, tissue insulin signaling, as assessed by insu-lin-stimulated p-AKT, appeared to be similar between high-fat diet– fed control and Il-13–/– mice (Supplemental Figure 1D). Collectively,
our results from Il-13–/– mice in both genetic backgrounds
impli-cated a critical role for IL-13 in maintaining glucose homeostasis.
Il-13 regulates hepatic gluconeogenesis. Insulin is known to suppress glucose output in the liver. The increased glucose production in C57BL/6 Il-13–/– mice (Figure 2) could be due to hepatic insulin
resistance. To assess the physiological function of IL-13, path-ways involved in glucose synthesis and production were examined in chow-fed C57BL/6 WT and Il-13–/– mice at 2 months of age,
when insulin responsiveness (as determined by ITT) and circulat-ing concentrations of fastcirculat-ing glucose, insulin, lactate, and lipids were similar between genotypes (data not shown). Liver samples were collected at 10 am and 10 pm to examine fasting and feeding metabolic responses. Gluconeogenic gene expression at 10 am was similar between the 2 C57BL/6 genotypes. As expected, mRNA lev-els of hepatic gluconeogenic genes (e.g., Pcx, Fbp1, and G6p) were decreased during the fed state (10 pm) compared with the fasted state (10 am) in WT mice (Figure 4A). However, this downregula-tion was blunted in C57BL/6 Il-13–/– mice, concomitant with an
increase in feeding blood glucose levels (WT, 176.07 ± 2.40 mg/dl glucose, Il-13–/–, 188.66 ± 4.57 mg/dl glucose, P < 0.05; WT, 1.62 ±
0.37 ng/ml insulin, Il-13–/–, 1.70 ± 0.44 ng/ml insulin). Induction of
de novo lipogenic genes (e.g., Srebp-1c and acetyl-CoA carboxylase 1 and 2 [Acc1/2]) by feeding was not affected, consistent with the notion that C57BL/6 Il-13–/– mice at this age show a normal
[image:5.585.46.538.80.325.2]hepat-ic insulin response. Dysregulated glucose metabolism at the fed state worsened by 7 months of age, as demonstrated by increased expression of several gluconeogenic genes, including Pcx, Pepck,
Figure 3
Hyperglycemia and increased hepatic glucose production in high-fat diet–fed BALB/c Il-13–/– mice. (A) WT and Il-13–/– mice (BALB/c background; n = 8 per genotype) were fed high-fat diet for 6 months. Body weight and blood glucose (inset) were measured at the indicated time points. (B)
research article
Fbp1, G6p, and Ppargc1α, in C57BL/6 Il-13–/– mice (Figure 4B).
Sub-sequently, recombinant IL-13 (rIL-13; 1 μg every other day, total 3 doses) was used to identify primary metabolic targets. rIL-13 treatment normalized gluconeogenic gene expression, but did not affect fatty acid metabolism genes, in C57BL/6 Il-13–/– mice (Figure
4B). rIL-13 also restored glucose and lactate to control levels (Fig-ure 4C), suggesting a direct role for IL-13 in the control of hepatic glucose metabolism. Indeed, primary hepatocytes isolated from C57BL/6 Il-13–/– mice showed increased glucose production and
gluconeogenic gene expression, a defect that was rescued by rIL-13 treatment for 6 hours (Figure 4D). Similar results were observed in livers/hepatocytes derived from high-fat diet–fed BALB/c Il-13–/–
mice (Supplemental Figure 2, A and B). These data suggest that IL-13 depletion results in loss of postprandial glycemic control, leading to hepatic insulin resistance and fasting hyperglycemia.
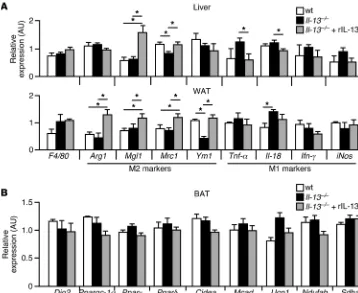
Th2 cytokines have been shown to modulate high-fat diet– induced tissue inflammation (10) and brown adipose tissue (BAT) thermogenesis (33), both of which contribute to metabolic homeostasis. On normal chow, the expression of proinflamma-tory (M1) and antiinflammaproinflamma-tory (M2) markers in the liver and WAT was similar between WT and Il-13–/– mice on the C57BL/6
background (Figure 5A). FACS and gene expression analyses showed same percentage of F4/80+ cells (e.g., macrophages)
with similar M1/M2 expression patterns in the liver and WAT of C57BL/6 Il-13–/– and WT mice (Supplemental Figure 3, A and
B). The expression of 2 M2 genes, Mgl1 and Mrc1, was lower by 20% in F4/80+ cells from WAT of C57BL/6 Il-13–/– mice, but the
[image:6.585.42.548.84.457.2]protein levels were not significantly altered (Supplemental Fig-ure 3, A and B). There was also no difference in concentrations of circulating cytokines/chemokines (TNF-α, IL-1β, MCP-1,
Figure 4
and MIP-3α) between genotypes (Supplemental Figure 3C). rIL-13 treatment was able to induce M2 genes (Figure 5A). These results were consistent with the notion that tissue inflamma-tion is more relevant under condiinflamma-tions such as high-fat feeding and obesity (34–36). In fact, immune cell infiltration, typically identified by crown-like structures, was not evident based on WAT histology in these chow-fed C57BL/6 mice (Supplemen-tal Figure 3D). In BAT, the mRNA levels of genes involved in mitochondrial oxidative metabolism and thermogenesis were not affected by IL-13 status (Figure 5B). Il-13 gene deletion in the BALB/c background on high-fat diet led to downregulation of M2 markers, particularly in WAT (Supplemental Figure 4, A and B). Notably, proinflammatory genes were unchanged. There was no difference in BAT metabolic gene expression (Supple-mental Figure 4C). Collectively, these results indicate that the defect in glucose metabolism in Il-13–/– mice under these
experi-mental settings is mediated primarily by the function of IL-13 in hepatic gluconeogenic gene expression.
Stat3 mediates the suppressive effect on gluconeogenic gene expression
by Il-13. Th2 signaling is known to induce phosphorylation and
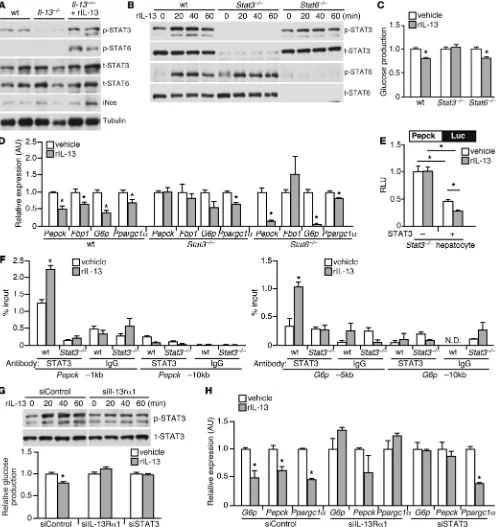
nuclear translocation of STAT6 to control transcription of M2 genes in immune cells (16). However, STAT3, another member of the STAT family known to suppress gluconeogenic genes (7, 8), has also been shown to interact with IL-13Rα1 (37, 38). Addi-tionally, feeding is thought to increase p-STAT3 (39). We found that expression of Il-13, but not Il-4, was increased in the liver from fed compared with fasted mice (Supplemental Figure 5A). As reported above, p-STAT3 was readily detectable in WT liver at the fed state (10 pm). In contrast, levels of p-STAT3 were reduced in the liver of C57BL/6 Il-13–/– mice, which could be restored by
rIL-13 treatment (Figure 6A). The p-STAT6 signal was relatively
low in both genotypes, but inducible by rIL-13. To demonstrate a causal relationship between IL-13 and glucose production and identify the downstream mediators, we conducted functional studies in isolated hepatocytes using various genetic models. In primary hepatocytes, rIL-13 treatment led to rapid STAT3 phos-phorylation (Figure 6B), which suggests that STAT3 may serve as an effector of IL-13 in regulating gluconeogenesis. In fact, the inhibitory effect of IL-13 on basal glucose production and glu-coneogenic gene expression was abolished in Stat3–/– hepatocytes
(with the exception of Ppargc1α expression), but was preserved in WT and Stat6–/– cells (Figure 6, C and D). In addition, rIL-13
was unable to suppress the activity of a reporter driven by a 1.7-kb PEPCK promoter element in Stat3–/– hepatocytes (Figure 6E).
Reexpression of STAT3 in these cells reduced the promoter activ-ity by 50%, which was further decreased with rIL-13 treatment. ChIP assays further demonstrated that IL-13 increased STAT3 occupancy on Pepck and G6p gene promoters (binding sites locat-ed at approximately –1 kb and at –5 kb, respectively; Figure 6F). siRNA knockdown of Il-13rα1 (or Stat3) also abrogated the abil-ity of IL-13 to increase STAT3 phosphorylation, reduce glucose production, and suppress gluconeogenic gene expression (Figure 6, G and H). Knockout or knockdown of Stat3, Stat6, or Il-13rα1
was shown to be specific (Supplemental Figure 5, B and C). These findings demonstrated that IL-13 controls glucose homeostasis through the IL-13Rα1/STAT3 signaling pathway in the liver.
As mentioned above, many immune cells are capable of produc-ing IL-13. To identify potential IL-13–producproduc-ing cells within the liver, we first used Il-13eGFP reporter mice, which contained a GFP
[image:7.585.42.400.83.376.2]knockin within the Il-13 locus (25). T cells, type I NKT cells, B cells, and macrophages were readily detected in the liver by FACS, where-as the presence of eosinophils and Lin–ICOS+Sca-1+CD25+IL-7Rα+
Figure 5
Minimal contribution of tissue inflammation to the metabolic phenotype of chow-fed Il-13–/– mice. (A) Expression profiling of
inflammatory genes in liver and WAT from 7-month-old chow-fed WT, Il-13–/–, and rIL-13–injected Il-13–/– mice (C57BL/6 back-ground; cohort as in Figure 4B). F4/80 is a macrophage marker. M1 and M2 markers represent classic (proinflammatory) and alternative (antiinflammatory) acti-vation of macrophages, respec-tively. (B) Expression profiling of
research article
Figure 6
IL-13 suppresses gluconeogenic gene expression through STAT3. (A) Immunoblotting showing reduced p-STAT3 levels in Il-13–/– liver. Liver samples were collected at 10 pm (2 representative mice per group; cohort as in Figure 4B). (B) Immunoblotting showed that IL-13 induced STAT3/STAT6 phosphorylation in primary hepatocytes from WT, liver-specific Stat3–/–, and Stat6–/– mice. (C) IL-13 suppressed glucose production in hepatocytes in a STAT3-dependent manner. (D) IL-13 decreased expression of gluconeogenic genes through STAT3. Samples were collected 6 hours after rIL-13
treatment for gene expression analyses by quantitative real-time PCR. (E) Suppression of PEPCK promoter activity by IL-13 was mediated by STAT3.
dysregulated glucose metabolism. In the C57BL/6 background, the hyperglycemic phenotype of chow fed Il-13–/– mice worsened
with age, leading to hepatic and systemic insulin resistance. BALB/c Il-13–/– mice also
showed elevated glucose levels with high-fat diet feeding. IL-13 suppressed transcription of gluconeogenic genes through a nonca-nonical downstream transcription factor, STAT3, and the effect of IL-13 on inhibition of glucose production was lost in Stat3–/–
hepatocytes. These results suggest that IL-13 exhibits metabolic functions beyond its role in modulating inflammation.
In response to endotoxin, the body exhib-its transient systemic insulin resistance, in an attempt to spare glucose for utiliza-tion by immune cells (40–42). It is therefore conceivable that in addition to resolving inflammation, one of the main functions of IL-13 is to restore glucose homeostasis that is disrupted by proinflammatory actions. Along this line, nutrient intake may trigger low-grade inflammation through mechanisms including O-GlcNAcylation–mediated activation of NF-κB, as described previously (13). In healthy individuals, insulin is necessary and sufficient to quickly restore glucose levels after feeding. IL-13 is likely required when insulin signaling is compromised or over-whelmed, such as in aged individuals or in cases of overnutrition. Although the glucose-lowering effect of IL-13 may help keep metabolic inflammation under control, this activity is indepen-dent of its function in macrophage polarization. Increased cir-culating glucose levels were observed in C57BL/6 Il-13–/– mice on
normal chow, which did not elicit strong tissue inflammation. In the BALB/c background, a strain resistant to metabolic dis-eases (32), hyperglycemia in Il-13–/– mice was brought about by
high-fat diet feeding without altering insulin sensitivity. In line with IL-13’s role in macrophage alternative activation, the expres-sion of WAT M2 genes was reduced. However, proinflammatory markers were not altered. This is not unexpected, because BALB/c mice are known to have a weaker M1 response (31). Our results from these 2 mouse models indicated that the M1/M2 paradigm could be extended to direct metabolic control, in which M1 causes dysregulated glucose metabolism by inhibiting insulin signaling, while M2 (notably IL-13) maintains glucose homeostasis by sup-pressing hepatic glucose production.
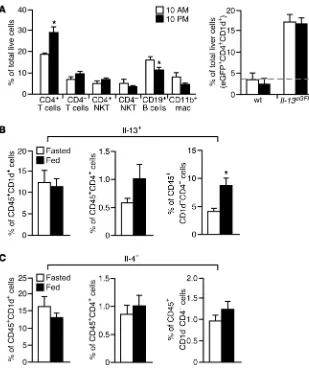
nuocytes (an ILC2 cell type) was not evident (Figure 7A and data not shown). There was an increase in the percentage of CD4+
T cells and a decrease in CD19+ B cells at the fed state.
Howev-er, the main IL-13+ population identified using Il-13eGFP/+ mice
appeared to be in CD4+ NKT cells (Figure 7A), at both fed (10 pm)
and fasted (10 am) states. We also determined IL-13 expression in CD45+ liver immune cells. Similarly, a higher percentage of type I
NKT cells was found to be IL-13+. Of note, in CD45+CD4–CD1d–
(non-T, non-NKT) cells, the IL-13+ population from the fed state
was higher than that from the fasted state (Figure 7B). In contrast, there was no difference in IL-4+ population (Figure 7C). These
results suggest that although NKT cells represent a major source of IL-13 in the liver, certain non-T, non-NKT cells may also con-tribute to IL-13 release in response to feeding.
Discussion
[image:9.585.45.354.80.448.2]The metabolic benefit of Th2 cytokines is believed to resolve, at least in part, the proinflammatory response elicited by Th1 sig-naling that has been shown to inhibit insulin sensitivity. Using experimental conditions that minimize contributions from met-abolic stress–induced inflammation, the current study identified a key function for IL-13 in hepatic glucose production. Depletion of Il-13 by gene targeting resulted in hyperglycemia accompanied by elevated expression of genes required for glucose synthesis and production in the liver, while rIL-13 treatment reversed the
Figure 7
Assessment of IL-13–producing cells in the liver. (A) Immune cell populations in the liver
collect-ed at 10 am and 10 pm, determined by FACS. mac, macrophages. Detection of IL-13+ NKT
cells using Il-13eGFP is also shown. Dotted line indicates the background signal in WT BALB/c cells (n = 3–4 per time point). (B) IL-13 and
(C) IL-4 expression in CD1d+ NKT cells, CD4+
T cells, and CD1d–CD4– cells, determined by
FACS. Liver CD45+ immune cells were isolated
research article
genetic backgrounds had higher hepatic fat accumulation than did control animals. IL-13 does not affect the expression of hepatic genes involved in fatty acid synthesis and catabolism. In primary hepatocytes, rIL-13 treatment reduced lipogenesis and increased fatty acid oxidation in Il-13–/–, but not WT, cells (Supplemental
Figure 5E). It is possible that the hepatic steatosis phenotype of
Il-13–/– mice is secondary to the lower metabolic rate and metabolic
dysregulation. Nevertheless, the IL-13/STAT3 pathway in the liver may provide new therapeutic opportunities to control hyperglyce-mia associated with insulin resistance.
Methods
Animals and metabolic studies. Il-13–/– mice in the BALB/c background were
generated as described previously (54). These animals were backcrossed 5 generations to the C57BL/6 strain (96.875%). Background- and age-matched littermates (males) were used as WT controls. Metabolic studies in chow-fed C57BL/6 WT and Il-13–/– mice were conducted in 4 cohorts
(n = 6–10 per genotype, 2–9 months of age). For high-fat diet–fed BALB/c
Il-13–/– mice (n = 8 per genotype; 2 cohorts), 10- to 12-week-old mice were
placed on a high-fat diet (Bio-Serv) for 6 months. WT and BALB/c Il-13–/–
mice (n = 5 per genotype, 4–6 months of age; 2 cohorts) fed normal chow were also studied. ITT and GTT were performed as described previously (55) using 1 U/kg body weight insulin and 1.5 g/kg glucose, respective-ly, by i.p. injection after a 6-hour fast. For PTT, mice were fasted for 16 hours followed by i.p. injection of sodium pyruvate (2 g/kg). Blood glucose concentrations were measured at the indicated time points using a glu-cometer (OneTouch Ultra; LifeScan). Fasting blood chemistries, includ-ing TGs, FFAs, cholesterol, and lactate, were measured followinclud-ing a 6-hour fast using commercial kits (Wako, Themo-Fisher). In certain experiments, blood chemistries, serum cytokines/chemokines, and tissue samples were determined at 10 am and 10 pm, corresponding to the natural fasting and
feeding states, respectively. These mice were fed ad libitum and housed in a quiet room without disturbance of their sleep/wake behavior to reduce environmental stress. Serum cytokines were measured using Luminex mul-tiplex kits (Millipore). Quantification of liver and muscle TGs and glyco-gen was based on published protocols (56). Metabolic cage studies and DEXA were performed as described previously (55). For in vivo rescue stud-ies, mice were given either 1 μg rIL-13 (Peprotech) or an equal volume of PBS every other day for 1 week (total 3 doses; n = 5 per treatment). Stat6–/–
mice (C57BL/6 background) were purchased from the Jackson Laboratory. Liver-specific Stat3–/– mice were generated as described previously (7) and
provided by J. Mizgerd (Boston University, Boston, Massachusetts, USA). Mice were housed in the Harvard School of Public Health barrier facility on a 12-hour light, 12-hour dark cycle.
Euglycemic-hyperinsulinemic clamp. Mice were implanted with catheters fol-lowed by a 5-day recovery (57). After an initial 5-μCi bolus, [3-3H]glucose was infused (0.05 μCi/min for 2 hours) to measure basal glucose turnover. A 2-hour euglycemic-hyperinsulinemic clamp was conducted with a prime and continuous insulin infusion (2.5 mU/kg/min), coupled with a vari-able infusion of 40% glucose to maintain blood glucose at 6 mM. Every 5 minutes, blood glucose was measured via tail bleed during the first hour to stabilize blood glucose levels and every 10 minutes thereafter until the end of the 2-hour clamp to maintain constant blood glucose levels. The rate of whole-body glucose turnover was estimated using a continuous infusion of [3-3H]glucose (0.1 μCi/min). Tissue-specific glucose uptake was estimated by a bolus administration of 2-deoxy-d-[1-14C]glucose (10 μCi) 45 minutes prior to the end of clamp experiments.
Primary hepatocytes and glucose production assays. Primary hepatocytes were isolated and cultured as described previously (56) using Liberase (Roche) from WT, Il-13–/–, Stat6–/–, and liver-specific Stat3–/– mice. To measure
glu-STAT6 is known as the main effector of Th2 cytokines in immune cells (16, 43). In fact, IL-4/STAT6 signaling is essential for Th2 cell differentiation (44–46). STAT6 has also been shown to mediate certain physiological functions of IL-4, most notably adaptive thermogenesis in BAT (33). In contrast, IL-13 was not required for Th2 differentiation nor thermogenic gene expres-sion (Figure 5B and Supplemental Figure 4C). Interestingly, IL-4 did not appear to control hepatic gluconeogenesis (Supplemen-tal Figure 5D). It is unclear how the differential activities of Th2 cytokines are regulated, as both IL-4 and IL-13 can signal through the type II receptor IL-13Rα1/IL-4Rα heterodimer (30). Structure-based studies suggest that the relative expression of IL-4Rα and IL-13Rα1 may determine the outputs of IL-4 versus IL-13 signal-ing (30). Although early studies established an interaction between STAT3 and the IL-13Rα1 subunit (37, 38), Th2 cytokines have been shown to weakly activate STAT3 in immune cell lines (30, 38). The ability of IL-13 to induce STAT3 phosphorylation in primary hepatocytes appeared to be rapid and robust (Figure 6), consistent with relatively high expression of IL-13Rα1 in hepatocytes com-pared with adipocytes and T cells (Supplemental Figure 1A). Levels of p-STAT3 in the liver have been shown to be increased by feeding, although the upstream signaling is not clear (39). Together, these observations suggest that the IL-13/STAT3 axis directs Th2 signal-ing toward metabolic responses, such as feedsignal-ing, whereas IL-4 and STAT6 may play roles in adaptive responses. This notion is sup-ported by recent work that identified widely dispersed IL-13–pro-ducing cells characterized as non-T, non-B, lineage-negative ILC2 cells that did not express IL-4 (24–26, 29). These cells provide early sources of IL-13 during helminth infection, whereas T cell–derived Th2 cytokines are thought to be important for the development of adaptive immunity (47). NKT cells represent another innate cell type capable of producing IL-13. Our data suggest that type I NKT cells are a main source of IL-13 in the liver. Although this cell population is not altered by feeding, a recent study demonstrated that NKT cell activation can be modulated by dietary fats (28). In addition to NKT cells, a population of non-T, non-NKT cells iso-lated from livers of fed mice expressed higher IL-13 levels than did the same population in fasted animals. These cells were also low in IL-4 and thus appeared to exhibit certain characteristics of ILC2 cells. We did not detect nuocytes, but other ILC2 populations may be involved, such as Ih2 and natural helper cells expressing differ-ent markers or MPPtype2 cells (48, 49). Collectively, these
observa-tions suggest that metabolic stress is sensed by multiple innate immune cells, which may help maintain metabolic homeostasis via release of IL-13.
1. Monnier L, Colette C, Dunseath GJ, Owens DR. The loss of postprandial glycemic control precedes stepwise deterioration of fasting with worsening diabetes. Diabetes Care. 2007;30(2):263–269. 2. Tahrani AA, Bailey CJ, Del Prato S, Barnett AH.
Man-agement of type 2 diabetes: new and future develop-ments in treatment. Lancet. 2011;378(9786):182–197. 3. Chang-Chen KJ, Mullur R, Bernal-Mizrachi E. Beta-cell failure as a complication of diabetes. Rev Endocr Metab Disord. 2008;9(4):329–343.
4. Altarejos JY, Montminy M. CREB and the CRTC co-activators: sensors for hormonal and metabolic signals. Nat Rev Mol Cell Biol. 2011;12(3):141–151. 5. Lin HV, Accili D. Hormonal regulation of hepatic
glucose production in health and disease. Cell Metab. 2011;14(1):9–19.
6. Cheng Z, White MF. The AKTion in non-canonical insulin signaling. Nat Med. 2012;18(3):351–353.
7. Inoue H, et al. Role of STAT-3 in regulation of hepatic gluconeogenic genes and carbohydrate metabolism in vivo. Nat Med. 2004;10(2):168–174. 8. Ramadoss P, Unger-Smith NE, Lam FS,
Hollen-berg AN. STAT3 targets the regulatory regions of gluconeogenic genes in vivo. Mol Endocrinol. 2009;23(6):827–837.
9. Lu M, et al. Insulin regulates liver metabolism in vivo in the absence of hepatic Akt and Foxo1. Nat Med. 2012;18(3):388–395.
10. Bhargava P, Lee CH. Role and function of mac-rophages in the metabolic syndrome. Biochem J. 2012;442(2):253–262.
11. Hotamisligil GS. Inflammation and metabolic dis-orders. Nature. 2006;444(7121):860–867. 12. Osborn O, Olefsky JM. The cellular and signaling
networks linking the immune system and metabo-lism in disease. Nat Med. 2012;18(3):363–374.
13. Issad T, Kuo M. O-GlcNAc modification of tran-scription factors, glucose sensing and glucotoxic-ity. Trends Endocrinol Metab. 2008;19(10):380–389. 14. Arkan MC, et al. IKK-beta links inflammation
to obesity-induced insulin resistance. Nat Med. 2005;11(2):191–198.
15. Cai D, et al. Local and systemic insulin resistance resulting from hepatic activation of IKK-beta and NF-kappaB. Nat Med. 2005;11(2):183–190. 16. Martinez FO, Helming L, Gordon S. Alternative
acti-vation of macrophages: an immunologic functional perspective. Annu Rev Immunol. 2009;27:451–483. 17. Kang K, et al. Adipocyte-derived Th2 cytokines
and myeloid PPARdelta regulate macrophage polarization and insulin sensitivity. Cell Metab. 2008;7(6):485–495.
18. Odegaard JI, et al. Macrophage-specific PPARgamma controls alternative activation and improves insulin aged 6–8 weeks, backcrossed 11 generations to BALB/c) (25) were collected at 10 am and 10 pm (n = 3–4 per genotype per time point). Hepatocytes were removed from the preparation through a 44% percoll gradient. FACS was performed to examine the presence of CD4+ and CD8+ T cells, CD19+ B cells, and CD11b+ macrophages as well as CD4+ and CD4–CD1d+ NKT cells (25). Nuocytes (Lin–ICOS+Sca-1+CD25+IL-7Rα+) and eosinophils (SiglecF+) were not detected. Similar results were obtained from both gen-otypes, and the data were combined in Figure 7A. IL-13+ cells in each cell population were further determined with GFP signal. A second approach was performed to identify IL-13+ and IL-4+ cells: liver immune cells from fasted or fed mice (8-week-old male C57BL/6; n = 4 per time point) were purified using percoll gradient and cultured in RPMI1640 culture medi-um (10% FBS, 50 μM 2-mercaptoethanol, and 2 mM glutamine) with 50 ng/ml phorbol myristate acetate (Sigma-Aldrich), 10 μg/ml brefeldin A (Invitrogen), and 10 μM monensin (Sigma-Aldrich) for 3 hours before FACS analyses using antibodies against CD45, CD4, CD1d, and IL-13 (28).
Statistics. Data are presented as mean ± SEM. Statistical differences between WT and Il-13–/– mice or between 10 am and 10 pm were assessed
using 2-tailed Student’s t test. For in vitro assays, the mean and SEM were determined from 3–4 biological replicates for 1 representative experiment. Experiments were repeated at least 3 times. A P value less than 0.05 was considered significant.
Study approval. Animal studies were approved by the Harvard Medical Area Standing Committee on Animals.
Acknowledgments
The authors thank S.M. Reilly and U. Ünlütürk for technical assis-tance, S. Akira and K. Takeda (Osaka University, Osaka, Japan) for providing floxed Stat3 mice, and G.S. Hotamisligil for help with metabolic cage and DEXA studies. P. Bhargava and K. Stanya were supported by NIH training grant T32ES016645. This work was sup-ported by the American Heart Association, by the American Dia-betes Association, and by NIH grant R01DK075046 (to C.H. Lee). Received for publication May 22, 2012, and accepted in revised form October 4, 2012.
Address correspondence to: Chih-Hao Lee, Department of Genet-ics and Complex Diseases, Harvard School of Public Health, 665 Huntington Ave., Bldg. 1, Rm. 207, Boston, Massachusetts 02115, USA. Phone: 617.432.5778; Fax: 617.432.5236; E-mail: clee@hsph.harvard.edu.
Hang Shi’s present address is: Department of Biology, Georgia State University, Atlanta, Georgia, USA.
cose production, hepatocytes were treated with rIL-13 (10 ng/ml) or vehicle in DMEM low-glucose media for 2 hours, washed, and incubated for 4 hours in glucose production media (DMEM without glucose or phenol red, supplemented with 1 mM pyruvate, 10 mM lactate, and 10 ng/ml rIL-13). Glucose concentrations in the media were measured enzymatically and normalized to total protein content. For siRNA experiments, hepatocytes seeded in 12-well plates were transfected with 40 pmol siRNA pools (Qia-gen) using Lipofectamine 2000 (Invitro(Qia-gen) for 48 hours, followed by glu-cose production assays.
Reporter assays and ChIP. For reporter assays, a 1.7-kb mouse PEPCK promoter element was cloned into the pGL3-basic vector. Hepatocytes were transfected with the promoter construct together with CMV-STAT3 or empty vector followed by overnight treatment with rIL-13. The rela-tive luciferase unit was normalized using the dual-luciferase reporter assay system (Promega). For ChIP, 8 × 10⁷ WT and Stat3–/– hepatocytes
were plated onto 15-cm plates and treated with rIL-13 overnight. Sam-ples were harvested and processed using the SimpleChIP chromatin immunoprecipitation kit (Cell Signaling). STAT3 antibody and IgG control were from Cell Signaling. Real-time PCR was performed to deter-mine STAT3 occupancy using primers flanking putative STAT3 bind-ing sites on the promoters of Pepck (approximately –1 kb relative to the transcription initial site) and G6p (approximately –5 kb) (8) as well as off-target sites (–10 kb) for each promoter. The following primers were used:
Pepck –1 kb forward, 5′-GTTGCTCAAGTGCCAC-3′; Pepck –1 kb reverse, 5′-GTAGACCCTTCAGTGTC-3′; Pepck –10 kb forward, 5′ -CTGGTTGTA-AGGTGGGGGTC-3′; Pepck –10 kb reverse, 5′ -GGAGAGCTCTGTGGTA-CAGC-3′; G6p –5 kb forward, 5′-GCTTGGTTGTGTGCTTTGCCTAGC-3′;
G6p –5 kb reverse, 5′-GCTGACCTTAAATTCTCTCTGTAGCC-3′; G6p
–10 kb forward, 5′-GAATCCAGTCAGTGTGACCTAGG-3′; G6p –10 kb reverse, 5′-GTGTCTGAAGACAGCTACAGTGTACTTAC-3′.
Gene expression. RNA was isolated from tissues (TRIzol) or cells
(USB-Affymetrix) and reverse transcribed with random hexamer and oligo-dT primers (1:1 ratio). Relative gene expression was determined by SYBR green– based real-time PCR. Transcripts were normalized to 36B4 expression.
Immunoblotting. Cells and tissues were lysed in IP buffer (20 mM Tris HCl, pH 8.0; 100 mM NaCl; 1 mM EDTA; 0.1% NP-40; 10% glycerol; 1 mM DTT; and protease and phosphatase inhibitors). For IRS1 tyrosine phosphoryla-tion, tissue samples were immunoprecipitated with anti-IRS1 antibody, followed by immunoblotting with anti–p-tyrosine and anti-IRS1 antibod-ies. Antibodies against the following proteins were used (all from Cell Sig-naling): p-AKT (pS473), AKT, IRS1, p-STAT3 (pY705), STAT3, p-STAT6 (pY641), STAT6, β-tubulin, and p-tyrosine (Cell Signaling). Anti-iNOS was from Santa Cruz Biotechnology.
research article
resistance. Nature. 2007;447(7148):1116–1120. 19. Odegaard JI, et al. Alternative M2 activation of
Kupffer cells by PPARdelta ameliorates obesity-induced insulin resistance. Cell Metab. 2008; 7(6):496–507.
20. Ricardo-Gonzalez RR, et al. IL-4/STAT6 immune axis regulates peripheral nutrient metabolism and insulin sensitivity. Proc Natl Acad Sci U S A. 2010;107(52):22617–22622.
21. Wu D, et al. Eosinophils sustain adipose alterna-tively activated macrophages associated with glu-cose homeostasis. Science. 2011;332(6026):243–247. 22. Chawla A, Nguyen KD, Goh YP. Macrophage-mediated inflammation in metabolic disease. Nat Rev Immunol. 2011;11(11):738–749.
23. Sun S, Ji Y, Kersten S, Qi L. Mechanisms of inflam-matory responses in obese adipose tissue. Annu Rev Nutr. 2012;32:261–286.
24. Moro K, et al. Innate production of T(H)2 cytokines by adipose tissue-associated c-Kit(+)Sca-1(+) lym-phoid cells. Nature. 2010;463(7280):540–544. 25. Neill DR, et al. Nuocytes represent a new innate
effector leukocyte that mediates type-2 immunity.
Nature. 2010;464(7293):1367–1370.
26. Price AE, et al. Systemically dispersed innate IL-13-expressing cells in type 2 immunity. Proc Natl Acad Sci U S A. 2010;107(25):11489–11494. 27. Winer S, et al. Normalization of obesity-associated
insulin resistance through immunotherapy. Nat Med. 2009;15(8):921–929.
28. Ji Y, et al. Activation of natural killer T cells pro-motes M2 Macrophage polarization in adipose tissue and improves systemic glucose tolerance via interleukin-4 (IL-4)/STAT6 protein signaling axis in obesity. J Biol Chem. 2012;287(17):13561–13571. 29. Saenz SA, et al. IL25 elicits a multipotent progeni-tor cell population that promotes T(H)2 cytokine responses. Nature. 2010;464(7293):1362–1366. 30. LaPorte SL, et al. Molecular and structural basis
of cytokine receptor pleiotropy in the interleu-kin-4/13 system. Cell. 2008;132(2):259–272. 31. Mills CD, Kincaid K, Alt JM, Heilman MJ, Hill AM.
M-1/M-2 macrophages and the Th1/Th2 para-digm. J Immunol. 2000;164(12):6166–6173. 32. Nishikawa S, Yasoshima A, Doi K, Nakayama H,
Uetsuka K. Involvement of sex, strain and age fac-tors in high fat diet-induced obesity in C57BL/6J
and BALB/cA mice. Exp Anim. 2007;56(4):263–272. 33. Nguyen KD, et al. Alternatively activated macro-phages produce catecholamines to sustain adaptive thermogenesis. Nature. 2011;480(7375):104–108. 34. Lumeng CN, DelProposto JB, Westcott DJ, Saltiel
AR. Phenotypic switching of adipose tissue macro-phages with obesity is generated by spatiotempo-ral differences in macrophage subtypes. Diabetes. 2008;57(12):3239–3246.
35. Weisberg SP, McCann D, Desai M, Rosenbaum M, Leibel RL, Ferrante AW. Obesity is associated with macrophage accumulation in adipose tissue. J Clin Invest. 2003;112(12):1796–1808.
36. Xu H, et al. Chronic inflammation in fat plays a cru-cial role in the development of obesity-related insu-lin resistance. J Clin Invest. 2003;112(12):1821–1830. 37. Orchansky PL, Kwan R, Lee F, Schrader JW.
Characterization of the cytoplasmic domain of interleukin-13 receptor-alpha. J Biol Chem. 1999;274(30):20818–20825.
38. Umeshita-Suyama R, et al. Characterization of IL-4 and IL-13 signals dependent on the human IL-13 receptor alpha chain 1: redundancy of requirement of tyrosine residue for STAT3 activation. Int Immu-nol. 2000;12(11):1499–1509.
39. Nie Y, et al. STAT3 inhibition of gluconeogen-esis is downregulated by SirT1. Nat Cell Biol. 2009;11(4):492–500.
40. Agwunobi AO, Reid C, Maycock P, Little RA, Carl-son GL. Insulin resistance and substrate utilization in human endotoxemia. J Clin Endocrinol Metab. 2000;85(10):3770–3778.
41. Virkamaki A, Yki-Jarvinen H. Mechanisms of insu-lin resistance during acute endotoxemia. Endocri-nology. 1994;134(5):2072–2078.
42. Yki-Jarvinen H, Sammalkorpi K, Koivisto VA, Nik-kila EA. Severity, duration, and mechanisms of insulin resistance during acute infections. J Clin Endocrinol Metab. 1989;69(2):317–323.
43. Gordon S. Alternative activation of macrophages.
Nat Rev Immunol. 2003;3(1):23–35.
44. Kaplan MH, Schindler U, Smiley ST, Grusby MJ. Stat6 is required for mediating responses to IL-4 and for development of Th2 cells. Immunity. 1996;4(3):313–319.
45. Shimoda K, et al. Lack of IL-4-induced Th2 response and IgE class switching in mice with
dis-rupted Stat6 gene. Nature. 1996;380(6575):630–633. 46. Takeda K, et al. Essential role of Stat6 in IL-4
sig-nalling. Nature. 1996;380(6575):627–630. 47. Liang HE, Reinhardt RL, Bando JK, Sullivan BM,
Ho IC, Locksley RM. Divergent expression patterns of IL-4 and IL-13 define unique functions in aller-gic immunity. Nat Immunol. 2011;13(1):58–66. 48. Neill DR, McKenzie AN. Nuocytes and beyond:
new insights into helminth expulsion. Trends Para-sitol. 2011;27(5):214–221.
49. Saenz SA, Noti M, Artis D. Innate immune cell populations function as initiators and effectors in Th2 cytokine responses. Trends Immunol. 2010; 31(11):407–413.
50. Clementi AH, Gaudy AM, Zimmers TA, Koniaris LG, Mooney RA. Deletion of interleukin-6 improves pyruvate tolerance without altering hepatic insulin signaling in the leptin receptor-deficient mouse.
Metabolism. 2011;60(11):1610–1619.
51. Di Gregorio GB, Hensley L, Lu T, Ranganathan G, Kern PA. Lipid and carbohydrate metabolism in mice with a targeted mutation in the IL-6 gene: absence of development of age-related obesity. Am J Physiol Endocrinol Metab. 2004;287(1):E182–E187. 52. Fritsche L, et al. IL-6 deficiency in mice neither
impairs induction of metabolic genes in the liver nor affects blood glucose levels during fasting and moderately intense exercise. Diabetologia. 2010;53(8):1732–1742.
53. Wallenius V, et al. Interleukin-6-deficient mice develop mature-onset obesity. Nat Med. 2002;8(1):75–79.
54. McKenzie GJ, Bancroft A, Grencis RK, McK-enzie AN. A distinct role for interleukin-13 in Th2-cell-mediated immune responses. Curr Biol. 1998;8(6):339–342.
55. Reilly SM, et al. Nuclear receptor corepressor SMRT regulates mitochondrial oxidative metabo-lism and mediates aging-related metabolic deterio-ration. Cell Metab. 2010;12(6):643–653.
56. Liu S, et al. Role of peroxisome proliferator-acti-vated receptor {delta}/{beta} in hepatic metabolic regulation. J Biol Chem. 2011;286(2):1237–1247. 57. Wang X, Yang Z, Xue B, Shi H. Activation of the