INTERNATIONAL
R
ESEARCHJ
OURNAL OFE
NGINEERING ANDT
ECHNOLOGY (IRJET) E-ISSN:2395-0056 VOLUME:04ISSUE:02|FEB -2017 WWW.IRJET.NET P-ISSN:2395-0072
Abstract -
Wireless sensor network (WSN) is the simple and basic way to measure the quality of water using wireless sensor network technology powered by solar panel. To measure the quality of water in a real time application, a base station and corresponding different sensor nodes are used to cover the large area. As this work is done in a remote area with limited access, signal from the sensors will collected and transmitted wirelessly to the base monitoring station. So the application of wireless sensor network (WSN) for a water quality measuring consists of a number of sensor nodes. Such monitoring system will results into low cost, easy installation, easy handling and low maintenance system. Basically, the use of wireless system for monitoring purpose will not only reduce the overall monitoring system cost in terms of labor cost, but also will provide large covering area. In this paper, we discussed the fundamental design and implementation of WSN using a high power transmission RF based technology. It is chosen due to its features like a low cost, easy to use, minimal power consumption and efficient data communication between different sensor nodes. Also for monitoring purpose the graphical user interface (GUI) is developed at the base monitoring station. It is used to monitor the water parameters continuously in real time. GUI is designed using MATLAB & VB because of low cost and easy customization.Key Words: WSN, pH sensor, temperature sensor, turbidity, rain sensor, GUI, etc.
1.
INTRODUCTION
In earlier days, there were lots of research, inventions, globalization and developments but in that time there were pollutions, global warming is also be formed and because of this there is no safe drinking water for human beings. In the developing countries because of lack of proper water treatments and technologies the dirty & polluted water is used for drinking purpose. The lack of water quality measuring systems causes lots of health issues.
Water is essential natural resource of life for each living organism on the earth. In examining quality of water parameters like pH level, turbidity plays an important roles. So health issues of human, plant and other living organisms on the earth depends on water quality. The different water sources like rain, rivers and lakes are available on the earth. Rain water running over the lands
contains many useful as well as harmful contents, may be soluble or insoluble. Salt and other particles in soil decides the acidity of water. Traditional methods fails to remove insoluble particles present in water causes a limitations on the use of water for particular applications.
The main ambition of this system is to measure pH level, temperature and turbidity of drinking water as well as water that may be used for domestic, agriculture and industrial process. This system measures parameters by using wireless communication providing quality control, record keeping and analysis using simulation software at base monitoring station. The parameters that are analyzed and control to improve water qualities are pH level, turbidity, temperature and quantity of rain water.
To take preventive actions for quality maintenance we got an idea that a system should be implemented to measure the quality of water in easy way, so it can easily analyze some of the critical and important parameters of water. Various environmental parameters such as temperature, pH, and turbidity from water can be collected by these systems using different sensors. The development of WSN technology provides us approach to real time data acquisition, transmission and processing. In general the user can get real time water quality data from faraway. Collected data from different sensors will sent to base station via WSN channel. Basically a computer with Graphical User Interface (GUI) for user is used at a base station and using various simulation tools the recoded data can be analyzed for future actions.
2.
SYSTEM ARCHITECTURE
Water is essential natural resource of life for each living organism on the earth. So water quality plays important role in the health issues of human, plants and other living organisms on the earth. The pH level, temperature and turbidity level are the parameters that are analyzed and control to improve water quality. The objectives of idea implementation are as follows:
[1] Measurement of pH, temperature, turbidity, quantity of water using sensors at remote area. [2] To provide power to sensor nodes using solar
energy.
[3] To collect data from various sensor nodes and send it to base monitoring station by wireless system. [4] To control data communication between source
and nodes.
Water Quality Measuring System Using Wireless Sensor Network
Mr. Vikas Mane
1, Mr. Pranav Medsinge
2, Mr. Akash Chavan
3, Mr. Sudhakar Patil
4Department of E&TC, Sanjeevan Engineering & Technology Institute, Panhala, Shivaji University Kolhapur,
Maharashtra, India
INTERNATIONAL
R
ESEARCHJ
OURNAL OFE
NGINEERING ANDT
ECHNOLOGY (IRJET) E-ISSN:2395-0056 VOLUME:04ISSUE:02|FEB -2017 WWW.IRJET.NET P-ISSN:2395-0072[5] To simulate and analyze quality parameters for quality control. (Graphical and numerical record using VB & MATLAB )
[6] To publish the corresponding record over web for public information and further assessment of water resource.
[image:2.595.36.288.215.376.2]The detailed block diagram of water quality monitoring system is shown in Figure:
[image:2.595.307.495.249.352.2]Fig -1: Block diagram of transmitter
Fig -2: Block diagram of receiver
3.
HARDWARE DESIGN
Here we are going to discuss the detailed design of pH sensor, turbidity level sensor, temperature sensor, rain sensor, RF transceiver module, LCD display and solar power module.
Parts of the System:
[1] Sensors pH Sensor Turbidity Sensor Temperature Sensor Rain Sensor
[2] Liquid crystal Display (LCD) [3] Microcontroller PIC 16F877A [4] Solar panel
[5] DC battery
3.1.1. pH sensor interfacing
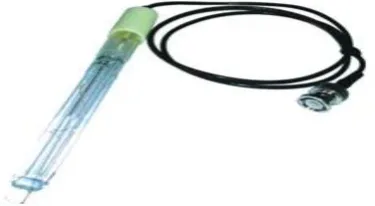
A pH sensor is a device that measures the hydrogen-ion concentration (or pH) in a solution, indicating its acidity or alkalinity. The high accuracy pH
probe TL42 is used as a pH sensor which is a special glass refillable electrode. It consists combined electrodes of pH glass & reference electrode in a single entity. Its range varies from 0 to 14 pH. It is available with cable length around 1 to 5 meters. This sensor requires BNC connector at the output. For acid output voltage is positive, for neutral it is null and for bases it becomes negative. This output voltage is affected by environmental temperature changes thus it is required to compensate the temperature factor. Output of sensor is converted into 0~2.5V range which is further given to PIC processor for further processing.
[image:2.595.42.286.409.488.2]
Fig -3: pH Sensor (TL-42)
3.1.2. Turbidity level sensor interfacing
Turbidity level sensor is used to measure the clarity of water or muddiness present in the water. The output voltage range represents turbidity value ranging from 0 to 4000NTU (Nephelometric turbidity unit). Output of circuit is 0~5V which is transferred to 0~3V compatible to PIC controller.
The TSD-10 module measures the turbidity (amount of suspended particles) of the wash water commonly used in washing machines and dishwashers. An optical sensor is a measuring device for a turbid water density using the refraction of wavelength between photo transistor and photodiode. By using an optical transistor and optical diodes, an optical sensor measures the amount of light coming from the source of the light to the light receiver, in order to calculate water turbidity.
The sensor operates on the principle that when light is passed through a sample of water, the amount of light transmitted through the sample is dependent on the amount of soil present in the water. As the soil level increases, the amount of transmitted light decreases and thus the turbidity sensor measures the amount of transmitted light to determine the turbidity of the water.
[image:2.595.320.471.670.758.2]INTERNATIONAL
R
ESEARCHJ
OURNAL OFE
NGINEERING ANDT
ECHNOLOGY (IRJET) E-ISSN:2395-0056 VOLUME:04ISSUE:02|FEB -2017 WWW.IRJET.NET P-ISSN:2395-00723.1.3. Temperature sensor interfacing
The LM35 series are precision integrated-circuit temperature sensors, whose output voltage is linearly proportional to the Celsius (Centigrade) temperature. It can be used with single power supplies, or with plus and minus supplies. +5V supply is provided by using 7805 regulator IC. When IC senses the temperature, it gives linear voltage as +10.0mV/°C at the Vout pin of IC. This Vout pin is connected to the +Vin of A/D Converter.
[image:3.595.346.495.168.305.2]The LM35 does not require any external calibration or trimming to provide typical accuracies of ±1⁄4˚C at room temperature and ±3⁄4˚C over a full −55 to +150˚C temperature range. The LM35 has low output impedance, linear output, and precise inherent calibration make interfacing to readout or control circuitry especially easy. The LM35 is rated to operate over a −55˚ to +150˚C temperature range, while the LM35C is rated for a −40˚ to +110˚C range.
Fig -5: Temperature Sensor (LM-35)
3.1.4. Rain sensor interfacing
The rain sensor is used to detect water and it can detect beyond of what a humidity sensor do. The YL-83 rain sensor is set up by two pieces: electronic board and the collector board that collects water drops.
The rain sensor has a built-in potentiometer for sensitivity adjustment of the digital output (D0). It also has a power LED that glows when the sensor is turned on and a digital output of LED. Basically the resistance of the collector board varies according to the amount of water on its surface. When the board is wet, the resistance increases and output voltage decreases and the vice-versa.
Fig -6: Rain Sensor Module (YL-83)
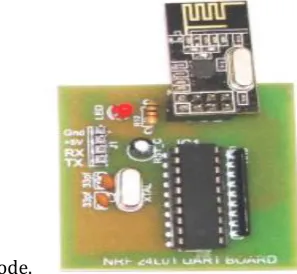
3.1.5. RF module interfacing
NRF24L01 RF Module is a transceiver module which provides easy to use RF communication at 2.4 GHz. It can be used to transmit and receive data at 9600 baud rate from any standard CMOS/TTL source. It works in half
[image:3.595.41.265.323.464.2]duplex mode.
Fig -7: RF TX-RX Module (NRF24L01)
3.2. LCD (Liquid Crystal Display)
LCD (Liquid Crystal Display) screen is an electronic display module and find a wide range of applications. A 20x4 LCD display is very basic module and is very commonly used in various devices and circuits. These modules are prefer over seven segments and other multi segment LEDs.
Fig -8: 20x4 LCD
3.3. Solar panel interfacing
[image:3.595.307.562.446.573.2]
INTERNATIONAL
R
ESEARCHJ
OURNAL OFE
NGINEERING ANDT
ECHNOLOGY (IRJET) E-ISSN:2395-0056 VOLUME:04ISSUE:02|FEB -2017 WWW.IRJET.NET P-ISSN:2395-0072output voltage of the solar power module. When the sunlight is strong and solar panel outputs higher than 6V, the regulator turns on, thus solar panel powers remaining blocks and battery is in charging mode. When the sunlight become poor, the regulator turns off & the whole sensor node is powered by 6V battery. Solar charging controller 6 V/DC, 6 A is used as a regulator to convert 6.5V into regulated 6V DC.
4.
SOFTWARE DESIGN
The GUI platform was successfully developed using the MATLAB software that was able to interact with the hardware at the base station.
Once the battery powered sensor node is turned on; the temperature, pH, rain and turbidity sensors dipped in water start sensing the respective data. Different push buttons are provided for reading the temperature, pH, rain and turbidity values which are ‘Read pH’, ‘Read Temp’, ‘Rain’ and ‘Read Turb’. Once the user clicks on any of the push buttons of the panel the RF transceiver on the transmitter side sends a signal to the RF receiver on the receiver side. The ‘Graph’ push button plots the different values that are obtained at the receiver side. Once the values are plotted, it is inherently saved and stored in MS Excel Database, which can be accessed by clicking on the ‘Database’ tab.
5.
RESULTS
Following figure shows the snapshot of database using different collected parameters on excel sheet.
6.
ADVANTAGES
[1] WSN technology provides us approach to real time data acquisition, transmission and processing
[2] Low power consumption, long battery life
[3] No carbon emission, more flexible to deploy at remote site
[4] It checks quality of water at the places where generally it is inconvenient to take frequent tests manually
[5] It is the easy installation of the system where the base station can be placed at the local residence close to the target area and the monitoring task can be done by any person with minimal training
7.
FUTURE SCOPE
The analysis of the material contents in the soil in that particular region can be monitored easily at the base station using this system. In order to monitor water quality in different sites, future works can be focused on establishing a system with more sensor nodes and more base stations. In future connections between nodes and base station will be done using Ethernet. The Ethernet can also be connected to Internet so that users can login to the system and get real time water quality data faraway. This system can be also used for water pollution control in different conditions. Also it can be used to guess abnormal moments under sea by measuring the turbidity at sea shore.
8.
CONCLUSION
Thus the proposed system using high power RF based WSN for water quality monitoring system offers low power consumption with high reliability. The use of natural solar energy helps to reduce power consumption & operating cost. Another important fact of this system is the easy installation of the system where the base station can be placed at the local residence close to the target area and the monitoring task can be done by any person with minimal training at the beginning of the system installation.
REFERENCES
[1] “Web Based Water Quality Monitoring with Sensor Network: Employing ZigBee and WiMax Technologies” by Steven Silva, Hoang N ghia Nguyen , Valentina Tiporlini and Kamal Alameh, 978-1-4577-1169-5/11/$26.00 ©2011 IEEE [2] Jiang Peng, Huang Qingbo, Wang Jianzhong
Research on Wireless Sensor Networks Routing Protocol for Water EnvironmentMonitoring 0-7695-2616-0/06 2006 IEEE
[3] F.Akyildiz lan, Su Weilian, Sankarasubramaniam Yogesh etc. A Survey on Sensor Networks 0163-6804/02 2002 IEEE.
[4] Tuan Le Dinh; Wen Hu; Sikka, P.; Corke, P.; Overs, L.; Brosnan, S,“Design and Deployment of a Remote Robust Sensor Network: Experiences from an Outdoor Water Quality Monitoring Network, ”Local Computer Networks, 32nd IEEE Conference on, pp 799-806, 2007
[5] “Solar based advanced water quality monitoring system using wireless sensor network”, R.Karthik Kumar, M.Chandra Mohan, S.Vengateshapandiyan, (IJSETR), Volume 3, Issue 3, March 2014
[6] “Water Quality Monitoring System Using Wireless Sensor Networks”, Shruti Sridharan, (IJARECE) Volume 3, Issue 4, April 2014
INTERNATIONAL
R
ESEARCHJ
OURNAL OFE
NGINEERING ANDT
ECHNOLOGY (IRJET) E-ISSN:2395-0056 VOLUME:04ISSUE:02|FEB -2017 WWW.IRJET.NET P-ISSN:2395-0072[7] “Water Quality Monitoring System Using Zig-Bee and Solar Power Supply” Amruta Amit Joshi, (IJAREIE), Vol. 4, Issue 10, October 2015
[8] “Smart Device to monitor water quality to avoid pollution in IoT environment”, Pandian D R, Dr. Mala K, (IJETCSE), Volume 12, Issue 2-January 2015.
[9] “Water Eminence Scrutinizing Scheme Based On Zigbee and Wireless Antenna Expertise - A Study”, V.Karthikeyan,
[10] Zulhani Rasin and Mohd Abdullah International Journal Engineering & Technology,"Water Quality Monitoring System Using Zigbee Based Wireless Sensor Network", IJET Vol:9 No:10.
[11] J Goldman and D Estrin ,”Distributed Sensing System for Water Quality Assessment and Management”,Feb1,2007,http://citeseerx.ist.psu.e du/viewdoc/download?doi=10.1.1.138.7945&rep =rep1&type=pdf