© 2017, IRJET | Impact Factor value: 5.181 | ISO 9001:2008 Certified Journal
| Page 1599
ANALYSIS AND OPTIMIZATION OF STRUCTURAL INTEGRITY OF
WELDED JOINT
SANAP PRASAD S.
[1], LAWANDE MAHESH B.
[2], THORAT RAJENDRA R.
[3],
PATARE RUSHIKESH
S.
[4],
PATHAN FARHAN A.
[5]Student of B.E. Mechanical, G .H. Raisoni C.O.E.M., Chas, Ahmednagar
[1],[2],[3],[4]Assistant professor, G. H. Raisoni C.O.E.M., Chas, Ahmednagar
[5]---***---
Abstract
- Structural integrity includes tasks in manyareas, such as failure analysis, structural analysis , non-destructive testing, corrosion, fatigue and creep analysis, metallurgy and materials, fracture mechanics, fatigue life assessment, development of repairing technologies, welding metallurgy, structural monitoring and instrumentation etc. Arc welding is a type of welding, in which the power supplies to create an electric arc between the base material to melt the metals at the welding zone and an electrode. The present analysis has been carried out on the welding parameters to achieve good quality of Arc welding. It has been explained in experiment, important of different welding parameters such as Different type of electrodes, Weld Current and Electrode Size on Mechanical properties of welded joint. Three dimensional FE model has been developed to simulate the arc welding process and validated by experimental results.
Keywords: Arc welding, Butt weld, Current, Electrodes,
Structural integrity, etc.
1.
INTRODUCTION
Arc welding process is widely being used in industry for sheet joining purposes. There are wide applications of welding made of carbon steel such as Fencing or Railing done in Ghats, shipbuilding, bridge structure, pressure vessels etc. are subjected to various stresses such as compressive, tensile and thermal stresses etc. Structural integrity of large engineering structures gives a unique challenge in the production of safe and cost-effective means of analysis, rehabilitation and inspection Objectives of this research is to determine structural strength of welded structures, obtain results by FEA method and to obtain the good quality welding.
2.
FINITE ELEMENT ANALYSIS
2.1. Thermo - Mechanical Analysis
In the mechanical analysis, the basic equations are the geometric compatibility equations, equilibrium equations and constitutive stress–strain relations. The change in the temperature distribution contributes to the deformation of the body through influences the material properties and thermal strains.
2.2. Calculation for Temperature
The temperature is being required for the Finite Element Analysis, so the temperature is calculated theoretically by using the formula of heat input.
…….. (a) Where,
Q = heat input m = mass CP = specific heat T = temperature
……… (b) Where,
I = current (amp) V = voltage (v) T = time (sec)
………. From (a) & (b)
……….. (c)
Hence, by using above formula eq. (c) the temperature for each plate is calculated to get the simulation in finite element analysis and temperature for each plate is as follows:
© 2017, IRJET | Impact Factor value: 5.181 | ISO 9001:2008 Certified Journal
| Page 1600
Table - 1: Temp. for E6013 SpecimenSr. No
No
Current Voltage Time Temperature
1 100 20 33 528
2 105 20 33 553
3 110 20 33 581
4 115 20 33 604
5 120 20 33 631
6 125 20 33 658
Temp for E7016 Specimen
Table - 2: Temp. for E7016 Specimen
Sr.
No Current Voltage Time Temperature
1 115 20 30 551
2 120 20 30 575
3 125 20 30 603
4 130 20 30 623
5 135 20 30 644
6 140 20 30 671
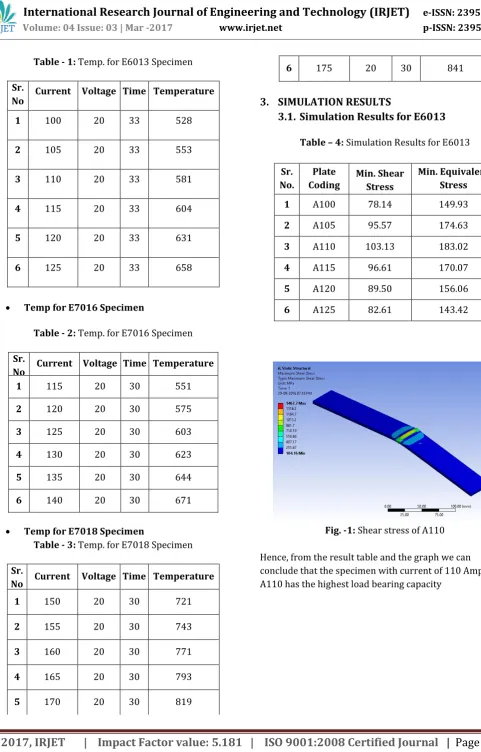
[image:2.595.54.268.115.340.2] Temp for E7018 Specimen
Table - 3: Temp. for E7018 Specimen
Sr.
No Current Voltage Time Temperature
1 150 20 30 721
2 155 20 30 743
3 160 20 30 771
4 165 20 30 793
5 170 20 30 819
6 175 20 30 841
3.
SIMULATION RESULTS
3.1. Simulation Results for E6013
Table – 4: Simulation Results for E6013
Sr. No.
Plate
Coding Min. Shear Stress
Min. Equivalent Stress
1 A100 78.14 149.93
2 A105 95.57 174.63
3 A110 103.13 183.02
4 A115 96.61 170.07
5 A120 89.50 156.06
6 A125 82.61 143.42
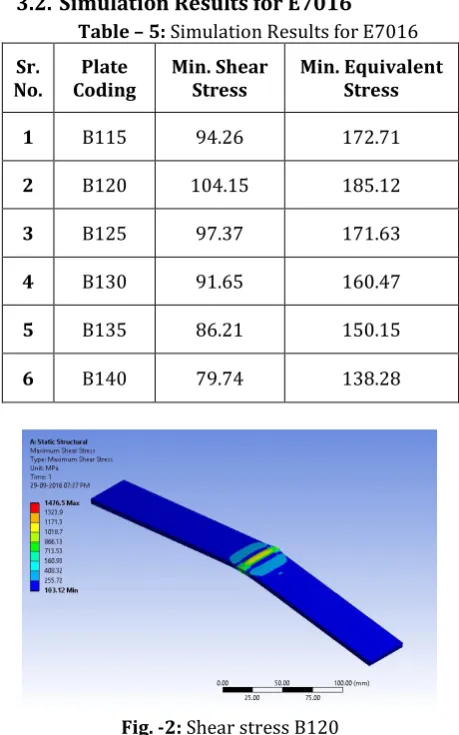
Fig. -1: Shear stress of A110
[image:2.595.320.545.206.566.2]© 2017, IRJET | Impact Factor value: 5.181 | ISO 9001:2008 Certified Journal
| Page 1601
3.2. Simulation Results for E7016
Table – 5: Simulation Results for E7016 Sr.
No. Coding Plate Min. Shear Stress Min. Equivalent Stress
1 B115 94.26 172.71
2 B120 104.15 185.12
3 B125 97.37 171.63
4 B130 91.65 160.47
5 B135 86.21 150.15
6 B140 79.74 138.28
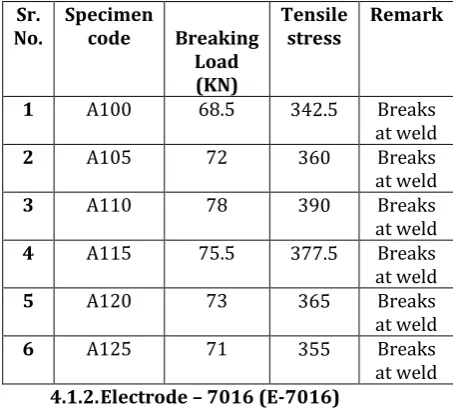
Fig. -2: Shear stress B120
Hence, from the result table and the graph we can conclude that the specimen with current of 120 Amp i.e. B120 has the highest load bearing capacity
[image:3.595.46.276.104.472.2]3.3. Simulation Results for E7018
Table – 6: Simulation Results for E7018
Sr.
No. Plate Coding Min.
Min. Equivalen
t Shear
Stress
Stress
1 C150 66.94 116.66
2 C155 61.35 108.37
3 C160 54.38 99.33
4 C165 48.48 93.23
5 C170 45.53 89.04
6 C175 46.51 86.98
Fig. -3: Shear stress C150
Hence, from the result table and the graph we can conclude that the specimen with current of 150 Amp i.e. C150 has the highest load bearing capacity
4.
EXPERIMENTAL VALIDATION
The Experimental results are for a Single-V butt weld joint of the dimensions (300 x 40 x 5 mm). The mechanical properties of the weld material and base material are shown in table above.
Table -7: Chemical composition of base material
Eleme
nt C Cu Fe Mn P Si S
Weight Max. % 0.25
-0.29 0
0.2
0 98.0 1.03 0.040 0.280 0.050
[image:3.595.41.555.436.778.2]© 2017, IRJET | Impact Factor value: 5.181 | ISO 9001:2008 Certified Journal
| Page 1602
4.1.
EXPERIMENTATION
As we know there are many welding parameter affects the strength of welding. We are finding the best suitable current for each electrode so we tested on three electrodes. There are 18 numbers of specimens were prepared from testing with arc welding process. The first six specimens of E6013 electrode at six different values of welding current (specimen code A100 at 100 amps., A105 at 105 amps., A110 at 110 amperes, A115 at 115 amperes, A120 at 120 amperes, A125 at 125 amperes) similarly another 6 specimen of E7016 electrode (specimen code B115, B120, B125, B130, B135, B140) and remaining 6 specimen of E7018 electrode (specimen code C150, C155, C160, C165,C170, C175) were prepared for testing.
4.1.1. Electrode – 6013 (E-6013)
6013 is a high titanic coated electrode. Working Current Range : 100 Amp – 140 Amp.
Table – 8: Chemical Composition of E-6013
Element C Mn Si P S
Weight
Max. % 0.08 0.05-0.10
0.45 0.3- 0.60
0.25 0.30 max
0.03 max 0.03 max
Table – 9: Results for E-6013 conducted on UTM
Sr.
No. Specimen code Breaking Load (KN)
Tensile
stress Remark
1 A100 68.5 342.5 Breaks
at weld
2 A105 72 360 Breaks
at weld
3 A110 78 390 Breaks
at weld
4 A115 75.5 377.5 Breaks
at weld
5 A120 73 365 Breaks
at weld
6 A125 71 355 Breaks
at weld 4.1.2. Electrode – 7016 (E-7016)
for welding heavy structures , high tensile strength jobs where impact strength are required the E 7016 ,a basic coated low hydrogen electrode is suitable.
[image:4.595.328.535.124.175.2]Working Current Range : 110 Amp - 150 Amp.
Table – 10: Chemical Composition of E-7016
Element C Mn Si P S
Weight
Max. % 0.09 max 1.10 0.8 - 1.5
0.54 0.25-0.65
[image:4.595.320.549.200.386.2]0.03 max 0.03 max
Table – 11: Results for E-7016 conducted on UTM Sr.
No. Specimen Code Breaking Load (KN)
Tensile
stress Remark
1 B115 82 410 Breaks
at weld
2 B120 93 465 Breaks
at weld
3 B125 77.5 387.5 Breaks
at weld
4 B130 76 385 Breaks
at weld
5 B135 72 360 Breaks
at weld
6 B140 68 340 Breaks
at weld
4.1.3. Electrode – 7018 (E-7018)
E7018 stick electrodes are a good choice for structural steel applications due to their smooth, stable and quiet arc, and their low spatter levels.
[image:4.595.47.274.474.678.2]Working Current Range: 140 Amp – 180 Amp
Table – 12: Chemical Composition of E-7018
Element C Mn Si P S
Weight
Max. % 0.10 max 0.90 – 1.40
0.75
[image:4.595.319.547.564.756.2]max 0.03 max 0.03 max
Table – 13: Results for E-7018 conducted on UTM Sr.
No. Specimen code Breaking Load (KN)
Tensile
stress Remark
1 C150 78 390 Breaks
at weld
2 C155 76.5 382.5 Breaks
at weld
3 C160 70 350 Breaks
at weld
4 C165 68.5 342.5 Breaks
at weld
5 C170 65 325 Breaks
at weld
6 C175 66.5 332.5 Breaks
© 2017, IRJET | Impact Factor value: 5.181 | ISO 9001:2008 Certified Journal
| Page 1603
5.
RESULTS
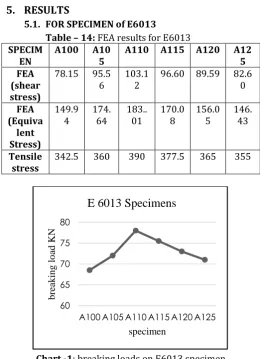
[image:5.595.30.291.109.469.2]5.1. FOR SPECIMEN of E6013
Table – 14: FEA results for E6013 SPECIM
EN A100 A105 A110 A115 A120 A125 FEA
(shear stress)
78.15 95.5
6 103.12 96.60 89.59 82.60
FEA (Equiva
lent Stress)
149.9
4 174.64 183..01 170.08 156.05 146.43
Tensile
stress 342.5 360 390 377.5 365 355
Chart -1: breaking loads on E6013 specimen Hence, from the result table and the graph above we can conclude that the specimen with current of 110 Amp i.e. A110 specimen has the highest load bearing capacity
5.2. FOR SPECIMEN of E7016
Table – 15: FEA results for E7016 SPECIM
EN B115 B120 B125 B130 B135 B140 FEA
(shear stress)
94.2
7 104.16 97.38 91.66 86.22 79.76
FEA (Equiva
lent Stress)
172.
73 185.11 171.62 160.48 150.14 138.29
Tensile
stress 410 465 387.5 385 360 340
Chart -2: breaking loads on E7016 specimen Hence, from the result table and the graph above we can conclude that the specimen with current of 120 Amp i.e. B120 has the highest load bearing capacity
[image:5.595.313.554.331.664.2]5.3. FOR SPECIMEN of E7018
Table – 16: FEA results for E7018 SPECIM
EN C150 C155 C160 C165 C170 C175 FEA
(shear stress)
66.95 61.3
7 54.36 48.44 45.52 46.56
FEA (Equival
ent Stress)
116.6
7 108.38 99.32 93.24 89.05 86.99
Tensile
stress 390 382.5 350 342.5 325 332.5
Chart -3: breaking loads on E7018 specimen
Hence, from the result table and the graph above we can conclude that the specimen with current of 150 Amp i.e. C150 has the highest load bearing capacity 60
65 70 75 80
A100 A105 A110 A115 A120 A125
b rea k in g lo ad KN specimen
E 6013 Specimens
0 20 40 60 80 100
B115 B120 B125 B130 B135 B140
B rea k in g L o ad KN specimen
E 7016 Specimens
55 60 65 70 75 80
C150 C155 C160 C165 C170 C175
B rea k in g L o ad KN specimen
© 2017, IRJET | Impact Factor value: 5.181 | ISO 9001:2008 Certified Journal
| Page 1604
CONCLUSION
From observation table and result analysis conclusion obtained are as follows:
1. Analytically found the ideal current for the particular electrode which can give better appearance to a weld with minimum efforts in minimum time.
2. Optimized result are been obtained for the three different electrode i.e. E6013, E7016, E7018. And for each electrode a fixed value of current is been found on which high strength achieved.
3. 3D FE model has been developed to simulate the arc welding process to find the optimized specimen for a specific current by using FEA software and validated the results by experimental procedure.
4. The specimens whose results were obtained by Finite Element Analysis are same as that of the results obtained by experimental procedure. 5. Hence by using proper parameters we can
achieve good quality of welding with a high strength. And rather than doing actual experiment we can get the results by FEA software.
REFERENCES
[1] Merchant Samir “Investigation On Effect of Welding Current On Welding Speed and Hardness of Haz and Weld Metal of Mild Steel” Lecturer, Fabrication Technology Department, Sir B.P. Institute, Bhavnagar, Gujarat, India..
[2] Aleem Pasha M.D. And Saritha B. “Optimization of Process Parameters of Arc Welded Joint by Taguchi”, Sri Venkateswara Engineering College, Suryapet.
[3] SalawadagiSushant S. &Kumbhar S. B “Parametric Optimization of Butt Weld for Minimum Residual Stress” Dept. Of Mechanical Engineering, RIT Sakharale 415414, Sangli, Maharashtra, India.
[4] IndiaProf.Rohit Jha1, Dr. A.K. Jha “Influence of Welding Current and Joint Design On the Tensile Properties of Smaw Welded Mild Steel Joints” Mewar University, GangrarChittorgarh (Rajasthan) 2chief Scientist Ampri, Bhopal (M.P.)
[5] Mrs.SanapDeepali, Prof.Galhe D.S, Prof.Burkul R.M “A Review Paper On Effect of Welding Speed and Groove Angle On Strength of Butt Weld Joint Using Tig Welding”