www.hydrol-earth-syst-sci.net/20/1373/2016/ doi:10.5194/hess-20-1373-2016
© Author(s) 2016. CC Attribution 3.0 License.
Estimating field-scale root zone soil moisture
using the cosmic-ray neutron probe
Amber M. Peterson1,2, Warren D. Helgason1,2, and Andrew M. Ireson2,3
1Department of Civil and Geological Engineering, University of Saskatchewan, Saskatoon, Saskatchewan, Canada 2Global Institute for Water Security, University of Saskatchewan, Saskatoon, Saskatchewan, Canada
3School of Environment and Sustainability, University of Saskatchewan, Saskatoon, Saskatchewan, Canada Correspondence to: Warren D. Helgason ([email protected])
Received: 17 November 2015 – Published in Hydrol. Earth Syst. Sci. Discuss.: 10 December 2015 Accepted: 6 March 2016 – Published: 7 April 2016
Abstract. Many practical hydrological, meteorological, and agricultural management problems require estimates of soil moisture with an areal footprint equivalent to field scale, integrated over the entire root zone. The cosmic-ray neu-tron probe is a promising instrument to provide field-scale areal coverage, but these observations are shallow and re-quire depth-scaling in order to be considered representative of the entire root zone. A study to identify appropriate depth-scaling techniques was conducted at a grazing pasture site in central Saskatchewan, Canada over a 2-year period. Area-averaged soil moisture was assessed using a cosmic-ray neu-tron probe. Root zone soil moisture was measured at 21 lo-cations within the 500 m×500 m study area, using a down-hole neutron probe. The cosmic-ray neutron probe was found to provide accurate estimates of field-scale surface soil mois-ture, but measurements represented less than 40 % of the sea-sonal change in root zone storage due to its shallow mea-surement depth. The root zone estimation methods evaluated were: (a) the coupling of the cosmic-ray neutron probe with a time-stable neutron probe monitoring location, (b) coupling the cosmic-ray neutron probe with a representative landscape unit monitoring approach, and (c) convolution of the cosmic-ray neutron probe measurements with the exponential filter. The time stability method provided the best estimate of root zone soil moisture (RMSE=0.005 cm3cm−3), followed by the exponential filter (RMSE=0.014 cm3cm−3). The land-scape unit approach, which required no calibration, had a negative bias but estimated the cumulative change in storage reasonably. The feasibility of applying these methods to field sites without existing instrumentation is discussed. Based upon its observed performance and its minimal data
require-ments, it is concluded that the exponential filter method has the most potential for estimating root zone soil moisture from cosmic-ray neutron probe data.
1 Introduction
pro-viding observations of average soil moisture over a∼240 m radius footprint (maximum radius as determined by Köhli et al., 2015). Cosmic-ray neutron probes have been shown to be successful in measuring field-scale soil moisture in a variety of environments and regions (e.g. Rivera Villarreyes et al., 2011; Franz et al., 2012a; Bogena et al., 2013; Hawdon et al., 2014), and have potential for validating remote sensing data (Crow et al., 2012; Hornbuckle et al., 2012; Dong et al., 2014). The cosmic-ray neutron probe holds great promise; however, the effective measurement depth is less than 30 cm for most soils (Franz et al., 2012b), requiring upscaling with depth to be representative of the entire root zone.
In this study, we extend the depth of the field-scale cosmic-ray neutron probe measurements by coupling them with an estimate of the deeper root zone soil moisture that has been determined by two main approaches: upscaling point mea-surements, and modelling.
The three methods considered to upscale the deeper mea-surement to the same areal extent as the cosmic-ray neutron probe were: (1) averaging of multiple point-scale measure-ments, (2) using a single time-stable measurement location to represent the large-scale spatial average, and (3) disaggre-gating the larger area into a few landscape units which can be represented by single monitoring locations. Multi-point averaging is the simplest way to upscale a network of point measurements. With a large number of measurement points this method can be accurate; however, to implement such a monitoring scheme in practice is often not feasible. The other methods considered allow areal soil moisture to be monitored from a greatly reduced number of points. In the time stabil-ity approach, a single site having a soil moisture response similar to that of the areal average is used to estimate the field-scale moisture content. Since the method was first pro-posed by Vachaud et al. (1985), time-stable sites have been found in a variety of environments (e.g. Grayson and West-ern, 1998; Mohanty and Skaggs, 2001; Teuling et al., 2006; Brocca et al., 2010b; Zhao et al., 2010; Gao et al., 2013). However, this approach often requires an extensive investiga-tion in order to identify a time-stable soil moisture locainvestiga-tion (Teuling et al., 2006). In the landscape monitoring approach, the number of point measurements needed to estimate field-scale soil moisture is reduced to the number of representative landscape units. Landscape features that influence the spatial variability of soil moisture, such as vegetation and topog-raphy, are relatively easy to visually assess (Hawley et al., 1983) and form a convenient conceptual model from which to build a simplified soil moisture monitoring strategy. The main challenge associated with this approach is identifying the appropriate controlling factors for which to disaggregate the landscape.
The assimilation of remotely sensed near-surface soil moisture data into water balance models to obtain profile soil moisture has been attempted and shown to provide good re-sults (e.g. Ragab, 1995; Calvet and Noilhan, 2000; Walker et al., 2001; Heathman et al., 2003). Soil moisture collected
from cosmic-ray neutron probe installations have also been assimilated into models with similar complexity, such as the NOAH land surface model (Shuttleworth et al., 2013; Rosolem et al., 2014), Community Land Model (Han et al., 2015), and HYDRUS-1D (Rivera Villareyes et al., 2014). In the present study we combine the cosmic-ray neutron probe data with a simpler modelling approach, termed the expo-nential filter method or soil water index (SWI) method. This method, introduced by Wagner et al. (1999), is based on a two-layer soil water balance. The soil moisture of the deeper layer (layer 2) is estimated as a function of the previous layer 2 estimate and the current surface (layer 1) soil moisture measurement; the importance of these two terms are deter-mined by an exponential filter. The exponential filter model has been successfully applied to remotely sensed data from the ERS Scatterometer (Wagner et al., 1999; Ceballos et al., 2005), Advanced Scatterometer (Albergel et al., 2009), and SMOS (Ford et al., 2014).
The following sections describe the experimental ap-proach used to apply and validate the depth-scaling tech-niques considered. Performance of the techtech-niques in terms of estimating field-scale volumetric water content and moisture changes were evaluated using 2 years of data collected from a prairie pasture in central Saskatchewan, Canada. The fea-sibility of applying the methods at locations without existing instrumentation is also discussed. A conclusion is reached on which of the methods is most suitable for estimating root zone soil moisture from cosmic-ray neutron probe data.
2 Methods 2.1 Study site
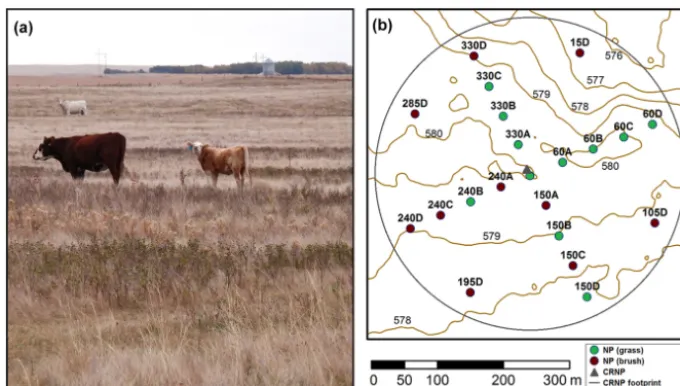
The study site is within a grazing pasture, located an hour south of Saskatoon, SK in the Brightwater Creek watershed (51◦2205400N, 106◦2405700W). The perennial vegetation pri-marily consists of various wheatgrasses (Agropyron sp.) and needlegrasses (Stipa sp.) with patches of western snowberry (Symphoricarpos occidentalis) (Fig. 1a). The areal fractions of grass and shrub were surveyed to be 54 and 46 %, re-spectively. Topography is of low relief, varying∼5 m over the 5002m2study area (Fig. 1b). The dominant soil type is dark brown Solonetz of the Rosemae association (Ellis et al., 1970). The climate is semi-arid, and the winters are charac-terized as cold. The regional average yearly precipitation is 298 mm rain and 78 mm snow water equivalent; and average daily temperatures are−15.3◦C in January and 18.0◦C in
Figure 1. Experimental site: (a) photo of the pasture, and (b) map showing elevation contours and the locations of soil moisture
instrumen-tation.
2.2 Ground-based observations 2.2.1 Cosmic-ray neutron probe
Continuous measurements of field average surface soil moisture were obtained using a cosmic-ray neutron probe (Model CRS-1000, Hydroinnova LLC, USA). Cosmic-ray neutron probes monitor the levels of cosmic-ray fast neu-trons (naturally produced background radiation) found near the earth’s surface. Fast neutrons are most effectively slowed by hydrogen, and therefore the quantity of fast neutrons de-tected by the probe can be related to soil moisture. The neu-tron counts detected by the probe were converted to volu-metric soil moisture (θv) using the equation from Hawdon et al. (2014),
θv=
0.0808
Ncorr No
−0.372
−0.115−wlat−wSOM
ρbd, (1)
whereNois the neutron intensity over dry soil, andNcorr is the corrected neutron counts. The neutron counts were cor-rected for air pressure, atmospheric water vapour, and in-coming neutron intensity using the method outlined in Zreda et al. (2012). Soil samples were taken on 3 July 2013 to calibrate No and determine site-specific parameters. At the pasture site, the 0–15 cm dry soil bulk density (ρbd) is 1.13 g cm−3; lattice water (wlat) is 0.03 g g−1. Soil organic matter (wSOM) was estimated to be 0.05 g g−1. The effective measurement depth (z∗), an important factor for depth scal-ing, varies with changes in volumetric water content. The re-lationship determined by Franz et al. (2012b), with the inclu-sion of soil organic matter, is
z∗= 5.8
ρbd·(wlat+wSOM)+θv+0.0829. (2) Neutron counts were integrated over the period of 1 h, and the 12 h running averages of soil moisture were created as a way to smooth the noisy data signal (Zreda et al., 2012). Daily values of soil moisture from the cosmic-ray neutron probe are used in this study, and defined as the 12 h running average centred about noon. To validate the cosmic-ray neu-tron probe, gravimetric soil samples for a depth of 0–20 cm were obtained at 20 randomly selected points within the foot-print on 9 August, 11 September, 30 September, and 23 Octo-ber 2013. A distance-weighted average was calculated using the method in Köhli et al. (2015).
2.2.2 Neutron probe array
Point measurements of root zone soil moisture were taken using a down-hole neutron moisture metre (CPN 503DR Hydroprobe, CPN International Inc., USA) at 50 m spac-ing in a wheel-and-spoke pattern (Fig. 1b), to coincide with the radial footprint of the cosmic-ray neutron probe. For each of the 21 locations, soil moisture was measured at 20 cm increments from 20–160 cm. A site-specific calibra-tion (RMSE=0.025 cm3cm−3) was developed from soil cores taken in 20 cm increments during the installation of the aluminum access tubes. Soil moisture, at all locations within the array, were measured bi-weekly in 2013 and monthly in 2014.
2.2.3 Meteorological data
pres-sure, are located beside the centre neutron probe location, along with the cosmic-ray neutron probe.
2.3 Field-scale soil moisture estimation techniques The methods used to estimate field-scale root zone soil moisture are described in this section. In all the meth-ods, soil moisture is integrated over a 110 cm depth. The first three methods involve coupling the shallow soil mois-ture measured by the cosmic-ray neutron probe with the deeper area-scaled estimates from the neutron probe array. The fourth method only requires measurements from the cosmic-ray neutron probe after calibration. The performance of the methods for estimating field-scale volumetric wa-ter content and changes in storage will be assessed using four metrics: Pearson correlation coefficient (R), root mean square error (RMSE), bias (BIAS), and Nash–Sutcliffe effi-ciency (NSE).
2.3.1 Spatial average
This approach couples the cosmic-ray neutron probe with the average of all available (21) point-scale measurements from the neutron probe array. Measurements are integrated over depth, and the field-scale soil moisture,θ(F), is given by:
θ(F)= n
P
j=1 m
P
i=1 θi,j
m ·1zj
zn
, (3)
whereθi,j is the volumetric water content for locationiand
measurement depthj,mis the number of measurement lo-cations,nis the number of measurement depths,1zj is the
thickness of the soil represented by the measurement depth, andznis the total measurement depth. In this method, we use
a changing measurement depth for the cosmic-ray neutron probe whereby the thickness of soil represented by the 20 cm measurement in the neutron probe array is 30 cm minus the effective depth of the cosmic-ray neutron probe. For all other methods, we assume the effective depth of the cosmic-ray neutron probe is constant.
The accuracy of the spatial average method is dependent on the estimates of field-scale soil moisture from both the cosmic-ray neutron probe and neutron probe array being ac-curate. Applying the statistical method found in Jacobs et al. (2004), which assumes soil moisture follows a normal dis-tribution at 95 % confidence, the error when using 21 point measurements will be less than±0.014 cm3cm−3. By using a large number of point measurements it is assumed that the error between actual field-scale soil moisture and the value estimated by averaging has been minimized. This method is assumed to provide the best field-scale estimate and will be used to measure the performance of the other methods.
2.3.2 Time stability
This approach couples the cosmic-ray neutron probe with a single time-stable location in the neutron probe array. The concept of time stability is the idea that throughout time there will be sites that maintain their ranking in a distribu-tion funcdistribu-tion, i.e. sites that continually exhibit field averages or extremes. The mean relative difference (MRD) method, demonstrated by Vachaud et al. (1985) to be successful in determining time-stable sites, is defined as:
MRDi,j=
θi,j−θj θj
, (4)
whereθi,j is the soil moisture measured at locationi and
timej, and θj is the average of all soil moisture
measure-ments at timej. The measurement point with the smallest standard deviation in MRD over the monitoring period is considered the most time stable. However, the most time-stable point is not necessarily representative of field average unless the average MRD for that point is zero. An offset (δ) is therefore needed to convert soil moisture measured at the time-stable site (θTS) to field average (θ(F)):
θ(F)=θTS+δ, (5)
in whichδis the temporal average of the difference between the soil moisture at the time-stable site and that of the field (MRD numerator).
2.3.3 Landscape unit
This approach couples the cosmic-ray neutron probe mea-surements with deeper soil moisture meamea-surements upscaled using a representative landscape unit, which in this case is based on vegetation type. It assumes that all soil moisture under a particular vegetation type is similar. A single moni-toring site representing each vegetation type is used and field-scale moisture storage,θ(F), was calculated as:
θ(F)= n
X
i=1
(Ai·θi) , (6)
whereAi andθi are the area fraction and depth-weighted
2.3.4 Exponential filter
This approach uses the field-scale surface soil moisture mea-surements of the cosmic-ray neutron probe to model root zone soil moisture. This model, developed by Wagner et al. (1999), considers the water balance of a two-layer soil profile, where layer 1 is the surface layer in which field-scale soil moisture is measured, and layer 2 is the lower soil layer of interest for modelling. Soil moisture of layer 2 (θ2) is de-scribed by a simple water balance as:
Ldθ2
dt =C (θ1−θ2) , (7)
wheretis time,Lis the depth of layer 2, andCis a propor-tionality constant. This approach assumes that transpiration and drainage losses from the lower layer are negligible, and that hydraulic diffusivity (i.e. the ratio of hydraulic conduc-tivity to specific storage) between the soil layers is constant (Wagner et al., 1999). The recursive formulation of the so-lution for Eq. (7) using an exponential filter (Albergel et al., 2008) can be rearranged as:
SWI2(t )=SWI2(t−1)·(1−Kt)+SWI1(t )·Kt, (8)
where SWI2and SWI1are the soil water index of layer 2 and layer 1, respectively, t is a time index, andKt is the gain.
Soil water index is the volumetric water content scaled 0–1 using assumed minimum and maximum values. For layer 1, the volumetric water content is bounded by the minimum and maximum of the observations. For layer 2, water content can be bounded using wilting point as the minimum value, and the mid-point between field capacity and total water stor-age as the maximum value (Wagner et al., 1999). Soil data are therefore a necessary model input. The gain (Kt), which
ranges 0–1, is calculated as: Kt=
Kt−1
Kt−1+exp(−(1t )/T )
, (9)
whereKt−1is the gain of the previous time,1t is the time step, and T is a characteristic time length (equal to L/C from Eq. 7). The filter is initialized by setting K1=1 and SWI2(1)=SWI1(1). The characteristic time length (T) is
de-pendent on a variety of factors, including thickness of layer 2, and soil properties (i.e. hydraulic conductivity, texture, density) that may influence water transmission rates (Al-bergel et al., 2008); and therefore requires calibration. For this study, layer 2 minimum and maximum also needed cali-bration, as the soil data from a large-scale survey (Ellis et al., 1970) proved to be unsatisfactory (described in Sect. 3.3.3). A Monte Carlo simulation was used to calibrate the three parameters simultaneously. A range for each parameter was first assumed, and 100 000 random combinations were gener-ated. The optimum parameters were the set that had the high-est NSE. A perfect model would have a NSE of 1, whereas a NSE of 0 or less indicates that modelled layer 2 SWI is no better than using the season average of the neutron probe array.
2.4 Data selection
Soil moisture data are available for the months of May– November in 2013 and 2014. Calibration was required for upscaling by time stability and the use of the exponential fil-ter. For these methods, 2013 is used as the calibration period and 2014 as the validation period. Meteorological data from the site showed that 2014 was wetter and cooler than 2013. May–August precipitation was 141 mm in 2013 and 206 mm in 2014, and average air temperature was 15.8 and 15.0◦C, respectively.
3 Results and discussion
3.1 Near-surface soil moisture measured by the cosmic-ray neutron probe
The soil moisture measured by the cosmic-ray neutron probe is shown in Fig. 2 for the 2013 and 2014 growing sea-sons, along with the measured daily precipitation and mod-elled effective measurement depth. The soil moisture, cal-culated using Eq. (1), was based on the single calibration date (3 July 2013). To provide validation of these measure-ments, gravimetric samples were taken on four occasions during summer of 2013, and are presented in Fig. 2 as the mean value±1 SD (n=20). The mean surface soil moisture from the gravimetric samples is well matched by the cosmic-ray neutron probe. Differences in soil moisture between the cosmic-ray neutron probe and the point measurement aver-ages may be in part due to differences in measurement depth. The gravimetric samples were from the top 20 cm. The effec-tive depth of the cosmic-ray neutron probe ranged between 7 and 21 cm, with a mean depth of 14 cm.
3.2 Soil moisture variability with depth
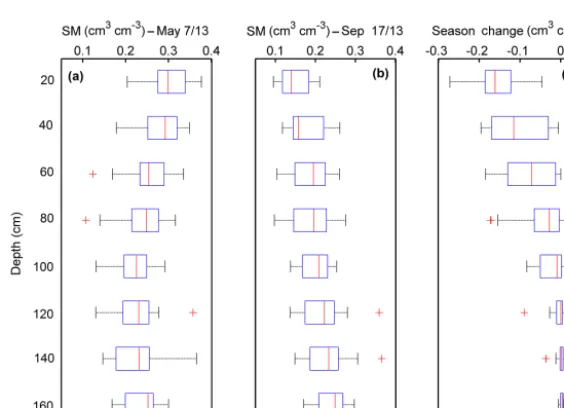
The spatial variability of soil moisture with depth is exam-ined in Fig. 3a and b using the 2013 observations from the neutron probe array. The boxplots show consistent spatial variability of volumetric water content with depth, with the average moisture content difference between the 25th and 75th percentile being 0.07 cm3cm−3. When looking at the seasonal change in soil moisture with depth (Fig. 3c), it can be seen that the temporal variability is high for shallower soil moisture, and low for deeper soil moisture. Although the spatial variability is similar for all depths, there is very little change in soil moisture below 100 cm. The 2014 data showed similar variability characteristics with depth.
Figure 2. Field average soil moisture measured by cosmic-ray neutron probe (12 h running average), as compared to gravimetric soil samples
(average±1 SD) and precipitation for 2013 and 2014. The changing measurement depth is shown in the top graph.
Figure 3. Spatial variability of soil moisture with depth; volumetric water content for 7 May 2013 and 17 September 2013, and season change
(difference between 17 September 2013 and 7 May 2013). The boxplot indicates the median (red line), 25th and 75th percentile (edges of the box), and minimum and maximum (extent of whiskers) values.
was captured within the top 110 cm of the soil profile, with negligible changes below this. The change in soil moisture measured by the cosmic-ray neutron probe, represented as the 0–14 cm interval, was highly variable but accounted for less than 40 % of the total seasonal change in moisture stor-age (Fig. 4, fraction of total cumulative storstor-age change for 0–14 cm on 17 September 2013 and 20 October 2014).
3.3 Depth-scaling approaches 3.3.1 Time stability
[image:6.612.157.439.312.516.2]stan-Figure 4. Cumulative change in storage with depth; 0–14 cm
[image:7.612.310.549.66.195.2]repre-sents the cosmic-ray neutron probe measurements.
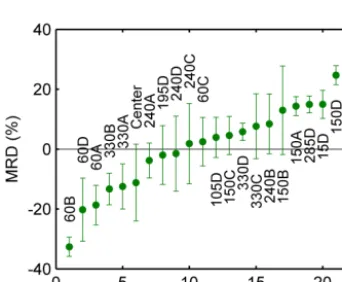
Figure 5. Average mean relative difference (MRD)±1 SD for each neutron probe monitoring location.
dard deviation (2.8 %), closely followed by 330D (2.9 %). To upscale the soil moisture from 285D to field scale, a constant offset of 0.033 cm3cm−3was applied.
[image:7.612.84.252.69.302.2]Several authors (e.g. Grayson and Western, 1998; Vachaud et al., 1985) have suggested that time-stable sites, in particu-lar those that are also average representative (MRD near 0), may have average physical properties, i.e. topography, soil, or vegetation characteristics. However, at this site, none of the locations were considered both time-stable and average representative (Fig. 5). Figure 6 examines the elevation and bulk density (0–80 cm average) of the time-stable and av-erage representative sites, with respect to all monitored lo-cations. The time-stable locations, those that have similar changes in soil moisture as the field mean, were found to
Figure 6. Physical characteristics of the time-stable and average
[image:7.612.312.546.276.438.2]representative sites. The boxplot indicates the median (red line), 25th and 75th percentile (edges of the box), and minimum and max-imum (extent of whiskers) values of all point measurement loca-tions.
Figure 7. Variability of soil moisture storage for the two different
vegetation groups shown by box and whisker plot, with thepvalue fromttest indicating the chance of similar means. The number of grass and brush locations are both 10. Blue dots indicate the chosen grass and brush monitoring sites (60A and 150C, respectively).
have a bulk density near field average (clustered near the me-dian value in Fig. 6), but no relation with elevation. The av-erage representative sites showed no relation with either ele-vation or bulk density.
3.3.2 Landscape unit
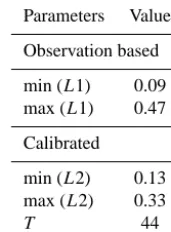
[image:7.612.83.254.356.497.2]Table 1. Exponential filter parameter values found from layer 1
ob-servations and calibration.
Parameters Value
Observation based
min (L1) 0.09 max (L1) 0.47
Calibrated
min (L2) 0.13 max (L2) 0.33
T 44
Thepvalue of thettests (displayed at the top of each graph in Fig. 7) indicates the likeliness that the means are statisti-cally similar. During the earlier months, when soil moisture is higher, the means between the two vegetation types are sta-tistically different at 95 % confidence (pvalue<0.05). In the later months, under drier soil moisture conditions, the means are statistically similar, as indicated by the large p values. The means of the seasonal change in storage between the two vegetation groups were found to be statistically different at 98 % confidence. By the mixed results, it is unlikely that vegetation type is the best way to group the soil moisture measurements at this particular site.
The locations chosen to represent grass and brush, which were 60A and 150C, respectively, are indicated by the blue-dots in Fig. 7. For the brush vegetation, location 150C repre-sents the median soil moisture of this vegetation group well. However, for the grass vegetation group, location 60A repre-sents the median change in soil moisture fairly well, but soil moisture values measured at this site are lower than the ma-jority of the other grass sites. This suggests that the estimate of field-scale volumetric water content using this method, and these representative sites, is expected to be consistently low.
3.3.3 Exponential filter
Wilting point, field capacity, and total water capacity were not measured at the field site. These properties were available from a government agency soil survey (Ellis et al., 1970). However, the wilting point given was higher than some of the field average measurements of the neutron probe array. Us-ing these soil properties would therefore yield significantly higher layer 2 soil moisture than the measured values. To get better results, both the minimum and maximum layer 2 bounds were calibrated in addition to the characteristic time length (T) which represents the timescale of soil moisture variation (Albergel et al., 2008). The Monte Carlo simula-tions (Fig. 8) show that layer 2 minimum and maximum wa-ter contents are very sensitive, whereas the T parameter is less sensitive, with values ranging 30–70 days giving similar results.
Figure 8. Sensitivity of the exponential filter parameters.
[image:8.612.123.209.98.214.2]Parame-ters were optimized based on the NSE. The blue dots indicate the top 200 combinations with the highest NSE, giving an indication of the sensitivity.
Figure 9. Input and output signals of the exponential filter using the
optimized parameters from Table 1. SWI1is the soil water index of the cosmic-ray neutron probe measurements.
The optimum value ofT, and layer 2 soil moisture bounds are shown in Table 1. Layer 1 minimum and maximum were based on the 2013 cosmic-ray neutron probe data. The prob-lem with this approach is that the layer 1 minimum and max-imum bounds may not be assessed correctly when only using 1 year of data. For example, Wagner et al. (1999) used obser-vations from 6 years to define layer 1 soil moisture bounds. It should be noted that the layer 1 minimum and maximum bounds have a high impact on the optimum layer 2 minimum and maximum bounds found through calibration.
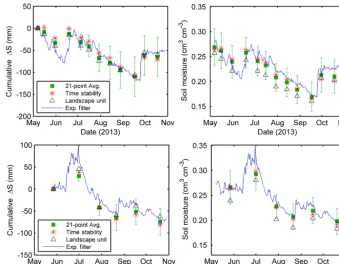
[image:8.612.312.545.231.320.2]Figure 10. Volumetric water content and cumulative change of field-scale soil moisture as estimated by the depth-scaling methods for
0–110 cm in 2013 and 2014.
3.4 Performance evaluation
The cumulative changes in root zone storage and mean vol-umetric water content for the 2013 and 2014 seasons are shown in Fig. 10. Absolute values of volumetric water con-tent provide a more rigorous test of the performance of the methods, while the cumulative change in storage is insensi-tive to systematic errors in the magnitude, but will be ade-quate for assessing annual water balances. The benchmark, neutron probe spatial average combined with the cosmic-ray neutron probe measurements, is shown in green as mean soil moisture ±1 SD, which is based upon the spatial vari-ability of soil moisture measured by the neutron probe ar-ray. Method performance of estimating field-scale volumet-ric water content was evaluated using the Pearson correlation coefficient (R), root mean square error (RMSE), bias (BIAS), and NSE. The results are shown in Table 2.
The time stability approach performed well in estimat-ing both field-scale volumetric water content and changes in soil moisture, and had the highest performance met-rics in both 2013 (RMSE=0.006 cm3cm−3) and 2014 (RMSE=0.005 cm3cm−3).
The landscape unit approach provided good estimates of field-scale changes in soil moisture for both 2013 and 2014. The pattern of soil moisture change was accurately captured (R >0.98), but the method exhibited a negative bias, where estimates of field-scale volumetric water content were con-sistently lower than the benchmark average. This result is
Table 2. Performance metrics of depth-scaling methods using
in-strumentation average as the control. Units of RMSE and BIAS are cm3cm−3.
R RMSE BIAS NSE
2013 (n=12)
Time stability 0.984 0.006 0.001 0.962 Landscape unit 0.989 0.015 −0.014 0.767 Exponential filter 0.952 0.010 0.002 0.902
2014 (n=6)
Time stability 0.999 0.005 −0.003 0.975 Landscape unit 0.987 0.020 −0.019 0.636 Exponential filter 0.972 0.014 0.006 0.817
consistent with Fig. 7, where it was shown that the chosen lo-cations, 60A and 150C, represented the change in soil mois-ture. The soil moisture measurements from 60A were con-sistently lower than the median value for grass, and it was expected that the estimate of volumetric water content would be low.
[image:9.612.318.537.427.556.2]av-erage on 1 July 2014. This RMSE is lower than previous studies (RMSE of 0.022 cm3cm−3in Ceballos et al. (2005); RMSE of 0.049 cm3cm−3 in Wagner et al., 1999) most likely because the method is being applied on a smaller scale (<1 km2) and the bounds of layer 2 have been calibrated. The cosmic-ray neutron probe also has a deeper measure-ment depth than satellite remote sensing instrumeasure-ments, and therefore less of the root zone needs to be modelled. An in-herent advantage of the exponential filter method is that the estimates are of the same temporal resolution as the cosmic-ray neutron probe measurements, whereas estimates from the other methods are dependent on how frequently down-hole neutron probe measurements are taken.
Based on the similarities in performance between 2013 and 2014, all methods can be considered stable at this prairie pasture over the 2-year period. The time stability and the rep-resentative landscape unit approach rely on the spatial pat-tern of soil moisture staying constant with time. The consis-tent performance of these methods may be due to no phys-ical changes to the environment occurring, i.e. the spatial pattern of vegetation stayed constant over the 2 years. Han et al. (2012) compared several upscaling methods, includ-ing time stability, and determined they were not temporally transferable at an agricultural site due to differences in rain-fall and crop type between the 2 years. It is important to note that the 2014 season (May–August) received 46 % more rain than the 2013 season. Despite the differences in precipitation the methods perform consistently.
3.5 Spatial transferability
The results of this study suggest that both the time-stable site and the exponential filter method would provide reliable es-timates of field-scale soil moisture at the study site in subse-quent years. However, these methods require calibration. In order for the methods to be applied more widely they must be able to be used at other locations with no calibration, or at least reduced calibration. The spatial average method com-prised of observations from a 21-point neutron probe array. Although this method was assumed to be the most accurate, the averaging of many point observations is often not a lo-gistically feasible long-term option for estimating field-scale soil moisture. In this section, we provide suggestions on how or if the remaining methods can be spatially transferred. 3.5.1 Time stability
In order for this method to be transferred to another site, the user would need to be able to locate the most time-stable site with only a small amount of work, or be able to iden-tify the location of the site based on its physical character-istics. Studies (e.g. Grayson and Western, 1998; Jacobs et al., 2004; Teuling et al., 2006) have mainly focused on locat-ing time-stable sites that are already average representative, so that an offset is not required. Teuling et al. (2006) found
high uncertainty in the spatial mean estimate (∼75 % of spa-tial variability) when a single survey was used to locate the average representative time-stable site, as opposed to a gen-eral uncertainty of∼40 % of the spatial variability when the seasonal dynamics were understood. There have also been mixed results in field studies on whether average represen-tative sites have average physical characteristics. Teuling et al. (2006) examined time stability of root zone soil moisture and did not find average representative sites to have field av-erage elevation or leaf area index. The avav-erage representa-tive locations in this study were not time stable (Fig. 5) and did not have field average elevation or bulk density charac-teristics (Fig. 6). However, the locations that were time sta-ble had field average bulk density (Fig. 6). For surface soil moisture, Jacobs et al. (2004) determined average represen-tative sites were found mid-hillslope under specific soil tex-tures. In general, root zone soil moisture may be more dif-ficult than surface soil moisture to relate to physical char-acteristics, as it may incorporate an average from multiple soil layers. A study on the variability of root zone soil mois-ture in the Canadian prairies (Biswas et al., 2012), found root zone soil moisture to be strongly influenced by the depth of the A and C horizons, in addition to soil texture and bulk density. For root zone soil moisture, these studies show that time-stable sites may not be easily identified from their phys-ical characteristics or with a single soil moisture survey. The time stability upscaling method would therefore be difficult to implement at sites lacking existing instrumentation. 3.5.2 Landscape unit
The landscape unit monitoring approach is one of the most feasible methods to implement in practice, requiring soil moisture instrumentation to be installed at only a single mea-surement location per vegetation type. This method is non-calibrated and large soil moisture variability could poten-tially exist within the vegetation groups. Therefore, the per-formance of this method is largely dependent on which lo-cations are chosen to subjectively represent the vegetation types. In this study, the sites chosen represented the change in soil moisture well, but the chosen grass site provided con-sistently low water content estimates (Fig. 7). The landscape unit approach will be most effective in places where vege-tation is the dominant control on soil moisture variability. The reliability of this method in general may be limited as other factors such as topography or soil properties may be of greater importance (e.g. Hawley et al., 1983; Western et al., 2004; Biswas et al., 2012).
3.5.3 Exponential filter
hydraulic properties will need to be estimated in order to de-termine layer 1 and layer 2 soil moisture bounds, given that previous layer 1 measurements most likely will not exist and layer 2 cannot be calibrated as performed in this study. The regional soil hydraulic properties of the area available from soil survey data (Ellis et al., 1970) were not accurate for the pasture site studied here, most likely due to the map resolu-tion. It may therefore be necessary to measure the local soil hydraulic properties to obtain higher accuracy. The effect of soil property errors was shown by Wagner et al. (1999) to cause a bias in the estimate that is dependent on soil type. Also, consideration of how to establish a suitable characteris-tic time length (T) needs to be given. Several studies (Cebal-los et al., 2005; Albergel et al., 2008; de Lange et al., 2008) have examined controls on T. The most important control on T is modelling depth, with larger T values being more suitable for greater modelling depths (Wagner et al., 1999; Ceballos et al., 2005; Albergel et al., 2008). Soil texture (de Lange et al., 2008) and climate (Albergel et al., 2008) were also found to have an influence on T. Although T may be affected by a number of factors, the results of this study and others (e.g. Wagner et al., 1999; Ceballos et al., 2005; Al-bergel et al., 2008) show that the parameter has relatively low sensitivity when considering the entire root zone. Be-cause the acceptable range ofT values is usually relatively large, accurate parameterization may not be necessary to ob-tain suitable soil moisture estimates.
4 Conclusions
In this study, the cosmic-ray neutron probe was used along with different depth-scaling methods to estimate field-scale root zone soil moisture. The cosmic-ray neutron probe was found to provide good estimates of surface soil moisture for this site through comparison with precipitation events and gravimetric sampling. The effective measurement depth gen-erally ranged 10–20 cm, which was determined to account for less than 40 % of the seasonal change in soil water stor-age. This illustrates that depth-scaling is necessary for the cosmic-ray neutron probe measurements to be representative of root zone soil moisture.
Three different depth-scaling methods were used to esti-mate field-scale soil moisture over the entire root zone. Their performance, in terms of estimating volumetric water con-tent and changes in moisture storage, was evaluated against the 21-point spatial average. The time stability method pro-vided the best estimates of field-scale root zone soil moisture (RMSE=0.005 cm3cm−3) during both the calibration and validation years, followed by the exponential filter (RMSE of 0.010 and 0.014 cm3cm−3for the calibration and validation years, respectively). The landscape unit approach, based on the monitoring locations chosen, showed a consistent neg-ative bias and was only able to estimate moisture changes well. The ease of applying these methods to sites without
ex-isting instrumentation was discussed. Intensive soil moisture monitoring is necessary to determine the time-stable loca-tion, making application of the time stability method diffi-cult. The exponential filter may be easier to apply given that the main parameter, the characteristic time length, has rel-atively low sensitivity. Soil hydraulic properties, which are also important for the exponential filter method, can be ob-tained from regional soil survey data; however, they may need to be measured locally for better accuracy. Consid-ering both performance and ease of spatial transferability, the exponential filter method is the most suitable for scal-ing cosmic-ray neutron probe data. Further studies are neces-sary to understand the full potential of the exponential filter method in estimating root zone soil moisture from cosmic-ray neutron probe data.
Acknowledgements. The authors would like to thank Bruce
John-son, Dell Bayne, and Xicai Pan for their assistance with data collection. Additionally, Environment Canada is acknowledged for their ongoing cooperation and support in operating the Brightwater Creek Research basin. Funding for this research was provided by the Natural Sciences and Engineering Research Council of Canada (NSERC) through a discovery grant awarded to A. Ireson titled “Groundwater – surface water interactions in the prairies”, and the program of the Canada Excellent Research Chair at the Global Institute for Water Security, University of Saskatchewan.
Edited by: N. Romano
References
Albergel, C., Rüdiger, C., Pellarin, T., Calvet, J.-C., Fritz, N., Frois-sard, R., Suquia, D., Petitpa, A., Piguet, B., and Martin, E.: From near-surface to root zone soil moisture using an exponential fil-ter: an assessment of the method based on in-situ observations and model simulations, Hydrol. Earth Syst. Sci., 12, 1323–1337, doi:10.5194/hess-12-1323-2008, 2008.
Albergel, C., Rüdiger, C., Carrer, D., Calvet, J.-C., Fritz, N., Naeimi, V., Bartalis, Z., and Hasenauer, S.: An evaluation of ASCAT surface soil moisture products with in-situ observations in Southwestern France, Hydrol. Earth Syst. Sci., 13, 115–124, doi:10.5194/hess-13-115-2009, 2009.
Biswas, A., Chau, H. W., Bedard-Haughn, A. K., and Si, B. C.: Fac-tors controlling soil water storage in the hummocky landscape of the Prairie Pothole Region of North America, Can. J. Soil Sci., 92, 649–663, doi:10.4141/cjss2011-045, 2012.
Brocca, L., Melone, F., Moramarco, T., and Morbidelli, R.: Spatial-temporal variability of soil moisture and its esti-mation across scales, Water Resour. Res., 46, W02516, doi:10.1029/2009WR008016, 2010b.
Calvet, J.-C. and Noilhan, J.: From near-surface to root zone soil moisture using year-round data, J. Hydrometeorol., 1, 393–411, 2000.
Ceballos, A., Scipal, K., Wagner, W., and Martínez-Fernández, J.: Validation of ERS scatterometer-derived soil moisture data in the central part of the Duero Basin, Spain, Hydrol. Process., 19, 1549–1566, doi:10.1002/hyp.5585, 2005.
Crow, W. T., Berg, A. A., Cosh, M. H., Loew, A., Mohanty, B. P., Panciera, R., de Rosnay, P., Ryu, D., and Walker, J. P.: Upscal-ing sparse based soil moisture observations for the validation of coarse-resolution satellite soil moisture products, Rev. Geophys., 50, RG2002, doi:10.1029/2011RG000372, 2012.
de Lange, R., Beck, R., van de Giesen, N., Fiesen, J., de Wit, A., and Wagner, W.: Scatterometer-derived soil mois-ture calibrated for soil texmois-ture with a one-dimensional water-flow model, IEEE T. Geosci. Remote, 46, 4041–4049, doi:10.1109/TGRS.2008.2000796, 2008.
Dong, J., Ochsner, T. E., Zreda, M., Cosh, M. H., and Zou, C. B.: Calibration and validation of the COSMOS rover for surface soil moisture measurement, Vadose Zone J., 13, doi:10.2136/vzj2013.08.0148, 2014.
Ellis, J. G., Acton, D. F., and Moss, H. C.: The Soils of the Rose-town Map Area: 72-O Saskatchewan, Publ. S3, Sask. Institute of Pedology, Saskatoon, Sask., 159 pp., 1970.
Environment Canada: Canadian climate normals: 1980–2010 for Davidson, Saskatchewan, available at: http://climate.weather.gc. ca/climate_normals/ (last access: November 2015), 2014. Ford, T. W., Harris, E., and Quiring, S. M.: Estimating root zone
soil moisture using near-surface observations from SMOS, Hy-drol. Earth Syst. Sci., 18, 139–154, doi:10.5194/hess-18-139-2014, 2014.
Franz, T. E., Zreda, M., Rosolem, R., and Ferré, T. P. A.: Field val-idation of a cosmic-ray neutron sensor using a distributed sensor network, Vadose Zone J., 11, doi:10.2136/vzj2012.0046, 2012a. Franz, T. E., Zreda, M., Ferré, T. P. A., Rosolem, R., Zweck, C., Stillman, S., Zeng, X., and Shuttleworth, W. J.: Measurement depth of the cosmic ray soil moisture probe affected by hy-drogen from various sources, Water Resour. Res., 48, W08515, doi:10.1029/2012WR011871, 2012b.
Gao, X., Wu, P., Zhao, W., Zhang, B., Wang, J., and Shi, Y.: Estimat-ing the spatial means and variability of root zone soil moisture in gullies using measurements from nearby uplands, J. Hydrol., 276, 28–41, doi:10.1016/j.jhydrol.2012.10.030, 2013.
Grayson, R. B. and Western, A. W.: Towards areal estimation of soil water content from point measurements: Time and space stability of mean response, J. Hydrol., 207, 68–82, 1998.
Han, E., Heathman, G. C., Merwade, V., and Cosh, M. H.: Appli-cation of observation operators for field scale soil moisture av-erages and variances in agricultural landscapes, J. Hydrol., 444– 445, 34–50, doi:10.1016/j.jhydrol.2012.03.035, 2012.
Han, X., Franssen, H.-J. H., Rosolem, R., Jin, R., Li, X., and Vereecken, H.: Correction of systematic model forcing bias of CLM using assimilation of cosmic-ray neutrons and land sur-face temperature: a study in the Heihe Catchment, China,
Hy-drol. Earth Syst. Sci., 19, 615–629, doi:10.5194/hess-19-615-2015, 2015.
Hawdon, A., McJannet, D., and Wallace, J.: Calibration and cor-rection procedures for cosmic-ray neutron soil moisture probes located across Australia, Water Resour. Res., 50, 5029–5043, doi:10.1002/2013WR015138, 2014.
Hawley, M. E., Jackson, T. J., and McCuen, R. H.: Surface soil moisture variation on small agricultural watersheds, J. Hydrol., 62, 179–200, 1983.
Heathman, G. C., Starks, P. J., Ahuja, L. R., and Jackson, T. J.: Assimilation of surface soil moisture to estimate profile soil water content, J. Hydrol., 279, 1–17, doi:10.1016/S0022-1694(03)00088-X, 2003.
Hornbuckle, B., Irvin, S., Franz, T., Rosolem, R., and Zweck, C.: The potential of the COSMOS network to be a source of new soil moisture information for SMOS and SMAP, in: Proc. IEEE Int. Geosci. Remote Sens. Symp., 22–27 July 2012, Munich, Ger-many, 1243–1246, 2012.
Jacobs, J. M., Mohanty, B. P., Hsu, E.-C., and Miller, D.: SMEX02: Field scale variability, time stability and similar-ity of soil moisture, Remote Sens. Environ., 92, 436–446, doi:10.1016/j.rse.2004.02.017, 2004.
Kerr, Y. H., Waldteufel, P., Wigneron, J. P., Delwart, S., Cabot, F., Boutin, J., Escorihuela, M., Font, J., Reul, N., Gruhier, C., Juglea, S., Drinkwater, M., Hahne, A., Martín-Neira, M., and Mecklenburg, S.: The SMOS mission: New tool for monitoring key elements of the global water cycle, Proc. IEEE, 98, 666–687, doi:10.1109/JPROC.2010.2043032, 2010.
Köhli, M., Schrön, M., Zreda, M., Schmidt, U., Dietrich, P., and Zacharias, S.: Footprint characteristics revised for tield-scale soil moisture monitoring with cosmic-ray neutrons, Water Resour. Res., 51, 5772–5790, doi:10.1002/2015WR017169, 2015. Mohanty, B. P. and Skaggs, T. H.: Spatio-temporal evolution and
time-stable characteristics of soil moisture within remote sensing footprints with varying soil, slope, and vegetation, Adv. Water Resour., 24, 1051–1067, 2001.
Ragab, R.: Towards a continuous operational system to estimate the root zone soil moisture from intermittent remotely sensed surface moisture, J. Hydrol., 173, 1–25, 1995.
Rivera Villarreyes, C. A., Baroni, G., and Oswald, S. E.: Integral quantification of seasonal soil moisture changes in farmland by cosmic-ray neutrons, Hydrol. Earth Syst. Sci., 15, 3843–3859, doi:10.5194/hess-15-3843-2011, 2011.
Rivera Villarreyes, C. A., Baroni, G., and Oswald S. E.: In-verse modelling of cosmic-ray soil moisture for field scale soil hydraulic parameters, Eur. J. Soil Sci., 65, 876–886, doi:10.1111/ejss.12162, 2014.
Rosolem, R., Hoar, T., Arellano, A., Anderson, J. L., Shuttle-worth, W. J., Zeng, X., and Franz, T. E.: Translating aboveground cosmic-ray neutron intensity to high-frequency soil moisture pro-files at sub-kilometer scale, Hydrol. Earth Syst. Sci., 18, 4363– 4379, doi:10.5194/hess-18-4363-2014, 2014.
Shuttleworth, J., Rosolem, R., Zreda, M., and Franz, T.: The Cosmic-ray Soil Moisture Interaction Code (COSMIC) for use in data assimilation, Hydrol. Earth Syst. Sci., 17, 3205–3217, doi:10.5194/hess-17-3205-2013, 2013.
point-scale observations, Hydrol. Earth Syst. Sci., 10, 755–767, doi:10.5194/hess-10-755-2006, 2006.
Vachaud, G., Passerat de Silons, A., Balabanis, P., and Vauclin, M.: Temporal stability of spatially measured soil water probability density function, Soil Sci. Soc. Am. J., 49, 822–828, 1985. Wagner, W., Lemoine, G., and Rott, H.: A method for
estimat-ing soil moisture from ERS scatterometer and soil data, Remote Sens. Environ., 70, 191–207, 1999.
Walker, J. P., Willgoose, G. R., and Kalma, J. D.: One-dimensional soil moisture profile retrieval by assimilation of near-surface ob-servations: a comparison of retrieval algorithms, Adv. Water Re-sour., 24, 631–650, 2001.
Western, A. W., Zhou, S. L., Grayson, R. B., McMahon, T. A., Blöschl, G., and Wilson, D. J.: Spatial correlation of soil moisture in small catchments and its relationship to domi-nant spatial hydrological processes, J. Hydrol., 286, 113–134, doi:10.1016/j.jhydrol.2003.09.014, 2004.
Zhao, Y., Peth, S., Wang, X. Y., Lin, H., and Horn, R.: Controls of surface soil moisture spatial patterns and their temporal sta-bility in a semi-arid steppe, Hydrol. Process., 24, 2507–2519, doi:10.1002/hyp.7665, 2010.