ScholarWorks @ Georgia State University
ScholarWorks @ Georgia State University
Geosciences Theses Department of Geosciences
Summer 8-18-2010
K-Ar Age Values of Bulk Soil Samples and Clay Fractions: Effects
K-Ar Age Values of Bulk Soil Samples and Clay Fractions: Effects
of Acid Extraction and Implications for the Origin of Micaceous
of Acid Extraction and Implications for the Origin of Micaceous
Clay in Savannah River Site Soils, South Carolina, USA
Clay in Savannah River Site Soils, South Carolina, USA
Thomas E. Naumann Georgia State University
Follow this and additional works at: https://scholarworks.gsu.edu/geosciences_theses
Part of the Geography Commons, and the Geology Commons
Recommended Citation Recommended Citation
Naumann, Thomas E., "K-Ar Age Values of Bulk Soil Samples and Clay Fractions: Effects of Acid
Extraction and Implications for the Origin of Micaceous Clay in Savannah River Site Soils, South Carolina, USA." Thesis, Georgia State University, 2010.
https://scholarworks.gsu.edu/geosciences_theses/27
K-AR AGE VALUES OF BULK SOIL SAMPLES AND CLAY FRACTIONS: EFFECTS OF
ACID EXTRACTION AND IMPLICATIONS FOR THE ORIGIN OF MICACEOUS CLAY IN
SAVANNAH RIVER SITE SOILS, SOUTH CAROLINA, USA
by
THOMAS EDWARD NAUMANN
Under the direction of W. Crawford Elliott
ABSTRACT
Understanding how natural Cs, Rb, and K have been redistributed in Savannah River Site
(SRS) soils during pedogenesis is important to understanding how radiocesium released to the
soils will behave over the long term. In this effort, it is important to distinguish K that has
participated in mineral-water reactions from that still residing in primary silicate structures,
particularly in the clay fraction. The impact of different degrees of acid extraction on K and
radiogenic Ar in bulk soil and in clay from five SRS soil samples has been determined. Strong
treatment (50% HNO3, three hours, 100°C) releases K from primary minerals, as shown also by
a concomitant release of radiogenic Ar, but a more moderate treatment (6% HNO3, three hours,
80°C) does not release K. K in the clay fraction is mostly nonexchangeable K in remnants of
primary mica, and clay K-Ar age values near 300 Ma indicate the mica originated in the
Appalachian mountain belt.
INDEX WORDS: K-Ar, Mica, Illite, Smectite, Hydroxy-interlayered vermiculite, Acid
K-AR AGE VALUES OF BULK SOIL SAMPLES AND CLAY FRACTIONS: EFFECTS OF
ACID EXTRACTION AND IMPLICATIONS FOR THE ORIGIN OF MICACEOUS CLAY IN
SAVANNAH RIVER SITE SOILS, SOUTH CAROLINA, USA
by
THOMAS EDWARD NAUMANN
A Thesis Submitted in Partial Fulfillment of the Requirements for the Degree of
Master of Science
in the College of Arts and Sciences
Georgia State University
Copyright by Thomas Edward Naumann
K-AR AGE VALUES OF BULK SOIL SAMPLES AND CLAY FRACTIONS: EFFECTS OF
ACID EXTRACTION AND IMPLICATIONS FOR THE ORIGIN OF MICACEOUS
CLAY IN SAVANNAH RIVER SITE SOILS, SOUTH CAROLINA, USA
by
THOMAS EDWARD NAUMANN
Committee Chair: W. Crawford Elliott
Committee: J. Marion Wampler
Seth E. Rose
Daniel M. Deocampo
Eirik J. Krogstad
Electronic Version Approved:
Office of Graduate Studies
College of Arts and Sciences
Georgia State University
ACKNOWLEDGEMENTS
I would like to thank Dr. Crawford Elliott for his guidance, encouragement, and support
on this project. I am also thankful for the guidance and direction of Dr. Marion Wampler whose
patience, help, and expertise on K-Ar has been invaluable. I owe thanks to my committee
members Dr. Daniel M. Deocampo, Dr. Seth E. Rose, and Dr. Eirik J Krogstad for agreeing to
serve on my committee. Finally, I wish to thank my wife, Becky, for the constant support,
encouragement, and influence, which has made it possible for me to continue my education and
TABLE OF CONTENTS
ACKNOWLEDGEMENTS iv
LIST OF TABLES vii
LIST OF FIGURES viii
LIST OF ABBREVIATEIONS AND SYMBOLS ix
CHAPTER 1.0 INTRODUCTION 1
1.1 Purpose of Study 1
1.2 K-Ar Dating System 2
1.3 Geologic Background 5
1.3.1 Alkali Sorption on Illite 8
CHAPTER 2.0 MATERIALS AND METHODS 18
2.1 Materials 18
2.1.1 Clay Separations 19
2.1.2 Acid Extraction Methods 19
2.2 Potassium-Argon Age Methods 20
2.2.1 Assumptions 20
2.2.2 Analysis of K Content 22
2.2.3 Ar Isotope Methods 23
2.2.4 Error Estimates in the SRS K-Ar Workbook 27
CHAPTER 3.0 RESULTS 34
3.1 K-Ar Apparent Age Values 34
3.1.2 K-Ar Ages of Bulk Soil 35
3.1.3 Summary of K-Ar Data 36
3.2 K Analyses 37
3.3 Ar Analysis 37
CHAPTER 4.0 DISCUSSION 52
4.1 Interpretation of K-Ar Analysis 52
4.1.1 K Analysis of Bulk Soils 52
4.1.2 K Analysis of Clay Fractions 53
4.1.3 K Analysis Summary 53
4.2 Interpretation of Results, Ar Analysis 54
4.3 Interpretation of K-Ar Results 55
4.4 K as a Proxy to Cs 59
CHAPTER 5.0 CONCLUSION 61
REFERENCES 63
Appendix A: K-Determination Methods 80
LIST OF TABLES
Table 1.1 Series names, taxonomic names, and coverage at SRS in percent 12
Table 1.2 Sampling depths 12
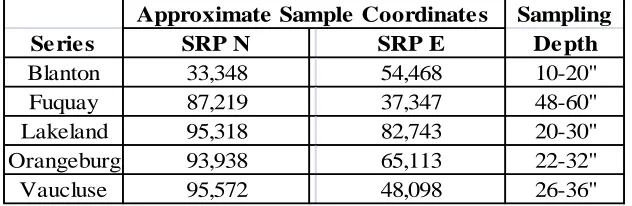
Table 2.1 Locations and depths of soil samples (Adapted from Findley, 1998) 29
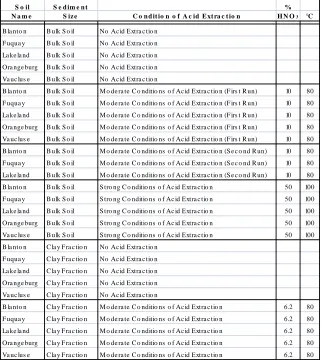
Table 2.2 Sample name and extraction conditions 30
LIST OF FIGURES
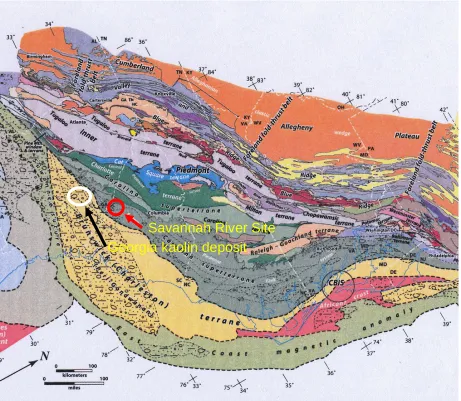
Figure 1.1 Location of SRS relative to major geologic units. 13
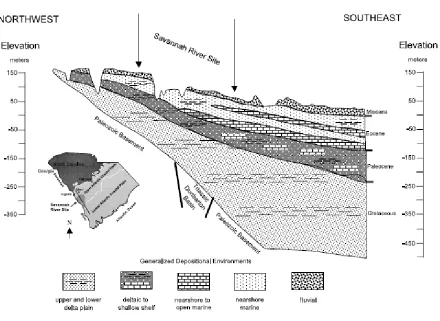
Figure 1.2 Cross section of depositional environment near the SRS. 14
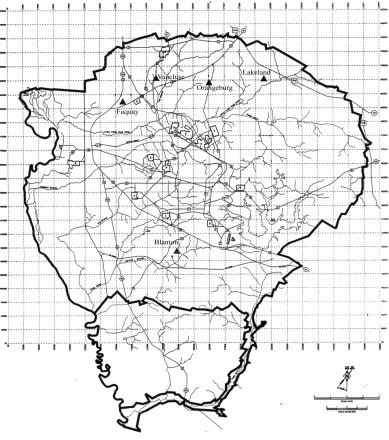
Figure 1.3 Sample location map. 15
Figure 1.4 Depiction of mica, wedge zone, and HIV. 16
Figure 1.5 Stratigraphic column of Savannah River Site. 17
Figure 2.1 Flowchart of subdivision and treatment of soil samples. 31-32
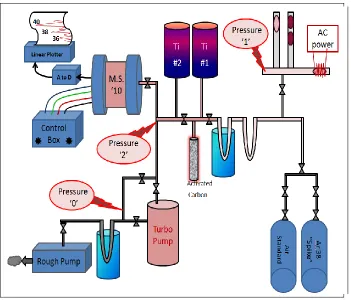
Figure 2.2 The argon extraction vacuum line. 33
Figure 3.1 Apparent age values of all materials. 40
Figure 3.2 Age values of untreated whole soils and untreated clay fractions. 41
Figure 3.3 Apparent age values of clay fractions. 42
Figure 3.4 Apparent age values by acid concentration during extraction. 43
Figure 3.5 Apparent age values by acid concentration. 44
Figure 3.6 Mass fraction of K in all materials. 45
Figure 3.7 Mass fraction of K in clay fractions. 46
Figure 3.8 Mass fraction of K in bulk soils. 47
Figure 3.9 Mass fraction of K in materials as a function of acid concentration. 48
Figure 3.10 Concentration of radiogenic 40Ar (pmol/g) for all samples. 49
Figure 3.11 Concentration of radiogenic 40Ar (pmol/g) for clay fractions. 50
LIST OF ABBREVIATIONS AND SYMBOLS
40
Ar(rad) Radiogenic argon-40
Al Aluminum
Å Ångstrom
Ar Argon
Bl Blanton
CEC Cation exchange capacity
Ci Curie
Cl Chlorine
cm Centimeter
°C Degree Celsius
Cu Copper
DI Deionized
dN/dt Number of atoms that disintegrate per unit time
e Ion charge
Eq. Equation
Fu Fuquay
g Gram
H Strength of magnetic field
> Greater than
HAc Acetic acid
HIV Hydroxy interlayered vermiculite
HF Hydroflouric acid
HNO3 Nitric acid
I/S Illite/smectite
I Illite
K Potassium
K-Ar Potassium-argon
km Kilometer
λ Decay constant
λβ Decay constant for decay of 40K to 40Ca
λε Decay constant for decay of 40K to 40Ar
< Less than
La Lakeland
loge Natural logarithm
M Molarity
Ma Million years
Mg Magnesium
Mg(H2O)62+ Hydrated magnesium ion
m Mass of ion
m Meter
ml Milliliter
mg Milligram
N Number of atoms
Na Sodium
NaOAc Sodium acetate
O Oxygen
Or Orangeburg
PFA Teflon perfluoroalkoxy copolymer resin
% Percent
pmol Picomole
r Radius of an ion’s path through a magnetic field RIP Radiocesium interception potential
RCF Relative centrifugal force RPM Revolutions per minute
SRS Savannah River Site
σ Standard deviation
t Apparent age
V Accelerating voltage
CHAPTER 1.0 INTRODUCTION
1.1 Purpose of Study
In 1952, the Savannah River Site (SRS), or Savannah River Plant as the joint venture
between the Department of Energy and DuPont was known at the time, began producing tritium
and plutonium for use in cold war era nuclear weapons. A byproduct of nuclear fission, an
estimated total of 250 to 500 Ci of the radionuclide 137Cs was released into nearby aquatic
systems (ponds, creeks, or canals) since the beginning of the plant’s operation, contaminating
over three thousand acres of wetlands (Kaplan et al., 2002). The peak annual release of 137Cs,
about 20 Ci, occurred in 1964 and annual releases from 1964 to 1967 each topped 10 Ci (Kaplan
et al., 2002). Mica-like minerals in sediment clay fractions have a strong capacity to sorb 137Cs ,
however a low clay content of SRS soils coupled with a relative lack of micaceous minerals in
the clays present enhance the bioavailability of 137Cs in relation to Oak Ridge and the DOE’s
Hanford Site (Evans et al., 1983; Findley, 1998; Kaplan et al., 2002). Investigating the behaviors
of alkali metals (K, Cs, Rb) with SRS soils and clays will help broaden the understanding of how
these elements interact with clay minerals, leading to further advances in the use of clays to sorb
contaminants such as 137Cs.
There are two main purposes of this study. The first purpose is to determine the impact
of strong and moderate conditions of acid extraction on the apparent age values of five SRS
sample materials. Bulk soil and clay fraction components of SRS soil samples were subjected to
treatment) with 50% HNO3 at 100oC for three hours, moderate conditions of acid extraction
(moderate treatment) with 6.2% or 10% HNO3 at 80oC for three hours, and untreated conditions.
The strong treatment was used to remove alkali metal ions from sites where those ions are not
part of the structure of primary silicate minerals in the soils. The moderate treatment was used in
a second set of strong-acid extractions in an attempt to minimize extraction of potassium from
structural sites in remnants of primary mica. The acid extractions impacted the resulting K-Ar
apparent age values, which were then used to infer the location of K within the minerals in the
SRS soils. Of note, the clay fractions of these soils are largely composed of kaolinite and
hydroxy interlayered vermiculite (HIV) (Goto, 2001).
The second purpose of this study is to use conventional K-Ar dating methods to
determine the apparent ages of materials from five soil samples from the SRS. The study uses
apparent age to determine provenance of SRS soil minerals by correlating apparent age values of
SRS clay fractions with those micas from the rocks of the Appalachian Mountain Piedmont
Province and to those of micas in Cretaceous and Tertiary sediments of the Georgia kaolin belts.
1.2 K-Ar Dating System
Potassium has three naturally occurring isotopes: 39K, 40K, and 41K which have isotopic
abundances of 93.2581%, 0.01167%, and 6.7302% respectively (Garner et al., 1975). Both 39K
and 41K are stable isotopes, however, 40K is radioactive and has a half-life (T1/2) of 1.25×10⁹
years. It decays by branched decay (beta decay, electron capture, and positron emission) to 40Ca
2005). The apparent age by the K-Ar dating system is a function of a measured ratio of 40K to
40
Ar(rad) (Dalrymple and Lanphere, 1969). Because 40K decays to 40Ar, a higher ratio of 40Ar(rad)
to 40K results in a greater value of apparent age while a lower ratio of 40Ar(rad) to 40K results in a
lower apparent age. Further details of K-Ar methods and equations governing age calculations
are described in Section 2.2.1.
The K-Ar method has been widely used to determine numerical ages for terrestrial rocks.
It has been particularly useful for dating volcanic rocks and shallowly buried sedimentary rocks
that contain authigenic glauconite. However, the K-Ar technique can serve additional purposes
apart from establishing age values. K-Ar has also been used to date extraterrestrial material such
as meteorites, material having much larger age values than terrestrial samples (Schaeffer and
Zähringer, 1966). Additionally, dating of rock formations by K-Ar can help date (indirectly) the
age of the fossils found within the formations (Hamilton and Farquhar, 1968). For example,
Australopithecus afarensis (―Lucy‖) (Walter and Aronson, 1982) is one prominent example of a
fossil whose age has been constrained by K-Ar dating of the volcanic ashes enclosing the
fossil-containing strata.
There are many situations in which calculated apparent age values can vary from actual
isotopic closure age values. Some examples are straightforward and directly applicable to SRS
mineralogical scenarios. For instance, if atoms of 40Ar(rad) escape an open mineral lattice, leaving
a portion of K still bound to the mineral, then the ratio of 40Ar(rad) to 40K will decrease and the
mineral’s apparent age will decrease accordingly. Conversely, if a portion of 40
K is removed
from sites in soil where K is exchangeable, leaving 40K and 40Ar(rad) remaining in sites where K is
will increase. Consequently, experimentally derived differences in apparent age within a
homogenous soil result from a change in the ratio of 40Ar(rad) to 40K. Furthermore, the change in
age (based on a change in a 40Ar(rad) to 40K ratio) can be used to infer changes in soil minerals,
such as removal of exchangeable cations from soil minerals during acid extraction.
Historically, there has been concern that sediment (particularly clay particles) does not
retain a K-Ar ratio with enough accuracy to use the sediment as a radiometric clock (Evernden et
al., 1960). This concern, however, has subsequently been allayed (Zimmermann and Odin,
1977) through demonstration of concordance of measured K-Ar ages among size fractions
(Bonhomme et al., 1983) and comparisons of age values of whole rock and clay from sediment
that has experienced different maximum temperatures, low and elevated (diagenetic) (Aronson
and Lee, 1986). K-Ar dating of illite remains applicable as a radiometric clock up to burial
temperatures of low grade metamorphism (<200°C) (Aronson and Lee, 1986).
The K-Ar technique can serve purposes apart from establishing age values. K-Ar
relationships can be used for developing cooling rates of rocks by using differences in age values
of minerals within a rock in conjunction with knowledge of the temperatures at which different
minerals become closed with respect to loss of radiogenic Ar (e.g., Kramar et al., 2001). K-Ar
studies of detrital sediment provide information about the provenance of the sediment (e.g.,
Vinogradov et al., 2009).
The present K-Ar study of SRS soil materials was not intended to provide information
about the timing of soil formation at the Site. Rather, it was intended to find potassium in
remnants of primary minerals within the soil, by the assumption that such potassium would be
undisturbed in structural sites of primary silicate minerals (mica and feldspar), it is assumed that
the 40Ar accumulated therein as a result of decay of 40K will also remain. However, where K ions
occur at cation exchange sites, it is assumed that newly formed atoms of 40Ar(rad) escape the open
mineral lattice, leaving a portion of K still bound to the mineral but having no associated
40
Ar(rad). If, for example, weathered mica contains exchangeable K, then the ratio of 40Ar(rad) to
40
K will be less than that in the unweathered mica and the mineral’s apparent age will be
correspondingly less than that of the unweathered primary mineral. Conversely, if K is removed
from exchange sites of a soil, leaving K and 40Ar(rad) remaining in sites where K is not
exchangeable, the amount of K has decreased but not the amount of 40Ar(rad) and the apparent age
will increase. Consequently, experimentally derived differences in apparent age among
differently treated portions of a soil sample are a consequence of changes in the ratio of 40Ar(rad)
to 40K. Changes in amounts of 40Ar(rad) and K in soil materials during laboratory treatments can
thus be used to distinguish K remaining undisturbed in remnants of primary minerals from
potassium that has participated in mineral-water reactions during pedogenesis.
1.3 Geologic Background
The Savannah River Site study area is located in the Coastal Plain of South Carolina,
about 20 miles southeast of Augusta, Georgia. The five sample materials examined in this study
were collected from the Blanton, Fuquay, Lakeland, Orangeburg, and Vaucluse soil series. The
series names, taxonomic descriptions, and the percentage of the total area covered by each series
sampling depths is reproduced from Findley (1998) in Table 1.2. A map of sample locations is
shown on Figure 1.1. Further details regarding specific soil properties and sampling methods
can be found in Findley (1998). Figure 1.2 shows the location of the SRS in proximity to the
surrounding major geologic units.
The Savannah River Site is underlain by Late Cretaceous to Holocene sediments
composed of stratified quartz sand, clay, calcareous sediments, and conglomerates (Wyatt and
Harris, 2004). Approximately 340 m of these sediments overlie the Paleozoic basement. This
sediment consists of about 215 meters of Late Cretaceous quartz sand overlain by 20 meters of
Paleocene clayey-silty sand, overlain by about 105 meters of Eocene sand, clay, and limestone
grading into calcareous sand, silt, and clay (Wyatt and Harris, 2004). These formations are
generally thicker in the southeast and thinner in the northwest. Figure 1.3 shows a structural
depiction of the sediment under the SRS. Figure 1.4 shows a generalized stratigraphic column of
the SRS.
Consideration of clay mineralogy is important for interpreting the results of K-Ar studies.
In the southeastern United States, the clay fractions of weathered soils most commonly consist of
kaolinite, gibbsite, and Al-HIV (Karathanasis et al., 1983). These soils have been characterized
extensively (Barnhisel, 1978; Rich, 1968; Weed and Nelson, 1962; Fiskell and Perkins, 1970;
Bryant and Dixon, 1963; Harris et al, 1992a; Harris et al, 1992b). The soil mineralogy provides
insight to soil properties such as cation exchange capacities, soil pH, and soil order. Specific
minerals can have profound effects on soil chemistry and cation exchange capacity. For
instance, generally speaking, dioctahedral minerals do not release K as easily as trioctahedral
layer (Bassett, 1960; Sawhney and Voigt, 1969; Schroeder, 1974) and the K-O bond length
(Leonard and Weed, 1970; Sawhney, 1972). Furthermore, there are large differences in the
amount of K among varieties of trioctahedral biotites (Leonard and Weed, 1970; Newman,
1969).
Specific to the SRS, the well drained upland soils consist predominantly of quartz while
the clay fraction is dominated by the aluminosilicate kaolinite (Findley, 1998). The temperate
climate and relatively high amounts of precipitation impact the mineralogy of the soils, rendering
carbonate minerals an insignificant component of SRS soils (Findley, 1998). Organic matter is
typically confined to the top 15 cm of soil (Rogers, 1990).
Findley (1998) originally sampled and described the soils used in this study. The Blanton
series is the most widespread soil series at the SRS (Rogers, 1990) and is characterized by a thick
eluvial horizon which begins around 10 cm deep and continues for more than a meter. The
horizon is extensively leached, having mostly sand and only small amounts of clay (Findley,
1998).
The Fuquay series has an eluvial horizon just below the surface and is characterized by
plinthite nodules (>5% by mass) in the B horizon (Findley, 1998). (Plinthite is an iron-rich,
humus-poor, redoximorphic feature found in soils, which eventually hardens irreversibly as an
aggregate as a result of repeated wetting and drying during pedogenesis.)
The Lakeland series is a soil made up almost entirely of unweathered quartz sands and is
characterized by its almost complete lack of horizon development. The sands begin at roughly 8
The Orangeburg series has no eluvial horizon, has a reddish hue in the subsurface
horizons, and generally has a finer texture than the other soils (Findley, 1998).
The Vaucluse series has a mature eluvial horizon depleted in colloidal materials. The
deeper horizons ―have a characteristic thin, dense, and brittle layer that is rich in clay‖ (Findley,
1998).
1.3.1 Alkali Sorption on Illite
There are multiple reasons for the variance of exchangeability of K in micas, even among
similar varieties of biotite. For instance, the partial oxidation of octahedral iron in biotite can
change the orientation of the hydroxyl ion dipole from perpendicular tothe mica layer to oblique,
creating a more stable interlayer site for K, which in turn decreases the exchangeability of K
(Gilkes et al., 1972, 1973; Thiry et al., 2005). However, an even more important source of
variance is the generation of frayed edge sites (FES) from weathering of muscovite (illite) to
HIV (or other weathered micas). FES are found in boundaries between illites and vermiculites
and represent a specific portion of the micaceous interlayers where alkali metal is most
commonly sorbed (Delvaux et al., 2001; Nakao et al., 2009). Between the primary mica
interlayer and the larger interlayer space of vermiculite is an intergrade intermediate zone that
exists between the non-expanded interlayer of 10 Å illite (or mica) and the expanded interlayer
of 14 Å vermiculite (Rich and Black, 1964; Sawhney, 1972). FES form as expanded layers
(vermiculite) are formed from non-expanded mica layers during weathering (Le Roux and Rich,
al., 1999 a, b). As the interlayer of mica (illite) expands and layer charge decreases by oxidation
of Fe, the mineral becomes vermiculite (or HIV). The greater interlayer thickness of HIV allows
ready exchange of cations from sites within the expanded interlayers. The concept of a wedge
zone between mica and vermiculite in weathered mica particles is illustrated in Figure 1.5.
Frayed edge sites of illite are thought to be in wedge zones near the edges of the particles.
The frayed edge sites of illites (micas) have a strong affinity for other large monovalent
cations such as Cs (Cremers et al., 1988; Maes et al., 1999a). Over time, the Cs deposited into
soils eventually becomes concentrated onto the frayed edges of the soils’ micaceous mineral
components (Francis and Brinkley, 1976). Furthermore, FES have demonstrated a greater affinity
for Cs than do the expanded-interlayer cation exchange sites (Sawhney, 1972). This specificity
for Cs has been shown to be the primary controlling factor of 137Cs exchange in soils (Delvaux et
al. 2001).
Much work has been done regarding the formation of FES from illitic materials. In order
to quantify the amount of FES present in a soil, Cremers et al. (1988) developed the theoretical
basis for the method which has become known as the radiocesium interception potential (RIP)
(Cremers et al., 1988). Because Cs is bound almost exclusively to the FES, the RIP value is an
accurate way to assess the extent of this site in soil (Delvaux et al., 2001; Nakao et al., 2009).
Illite or mica chemically weathers to vermiculite in low pH environments (Birkeland,
1999). Upland soils in the SRS are acidic, typically ranging in pH from 4-5 (Findley, 1998),
which over time promotes the weathering of non-expanded illite to vermiculite. Expanded
interlayers, formed from unweathered and nonexpanded micas in humid climates with high
hydroxy-aluminum polymers to form hydroxy-interlayered vermiculite, or HIV (Bain et al., 1990; Lin et
al., 2002; Matsue and Wada, 1989; Watanabe et al., 2006). HIV layers containing interlayer
wedge zones may act as 137Cs selective sites in a manner similar to the FES (Goto et al., 2008;
Kruyts and Delvaux, 2002). Thus, soils with a large HIV component, such as the SRS soils, have
the potential for 137Cs concentration. Because K is an alkali metal with similar chemical
behavior to Cs (at first approximation), the study of SRS soils by the K-Ar method has
implications for the behavior of Cs in SRS soils.
In the expanded layers, in FES, and, to a lesser extent, in sites near the apices of
interlayer wedges (Figure 1.5), the expanded interlayer spacing is sufficient to allow argon to
escape and to allow exchange of K and other cations. The exchange of cations within expanded
layers and wedge sites can alter the measured ratio of K to radiogenic Ar, which in turn impacts
the apparent age. For instance, if 40K is sorbed to the vermiculite component of a clay, where the
14 Å interlayer provides a void large enough for gases to freely exchange with the atmosphere,
then the radiogenic 40Ar nuclide will leave the mineral system as the 40K decays. The loss of
40
Ar(rad) and retention of 40K creates a low 40Ar(rad) to 40K ratio, which results in a low apparent
age value. Likewise, the preferential removal of K from HIV due to ion exchange also impacts
apparent age values.
The removal of exchangeable K by acid extraction can be used to isolate K in the
(mica-like) interlayer in the illitic constituent of clay. If this illitic constituent formed from mica in the
soil’s parent material and contains non-exchangeable K and the 40
Ar(rad) formed by decay of
non-exchangeable 40K, removing exchangeable K (and Ar) from other sites leaves a ratio of 40K and
40
Specific conditions of acid extraction which remove K from vermiculite, but leave illite intact
can be used to obtain clay components which yield apparent ages interpretable in respect to
tracing the origin of the clay to parent mica (or possibly to identification of newly formed illite
Table 1.1 Series names, taxonomic names, and coverage at SRS in percent.
(From Findley, 1998)
Series Name Taxonomic Name
Coverage at SRS (% of Total Area)
Blanton Loamy, siliceous, thermic Grossarenic Paleudults 21%
Fuquay Loamy, siliceous, thermic Plinthic Paleudults 11.3%
Lakeland Thermic, coated Typic Quartzipsamments 4.3%
Orangeburg Fine-loamy, siliceous, thermic Typic Paleudults 3.4%
Vaucluse Fine-loamy, siliceous, thermic Typic Hapludults 6.9%
Notes: Blanton, Fuquay, Orangeburg, and Vaucluse are Ultisols; Lakeland is an Entisol.
Soil coverage does not add up to 100% because there are other soils at the SRS not used in this
study.
Table 1.2 Sampling depths (Adapted from Findley, 1998).
Soil Sampling
Series Depth
Blanton 10-20"
Fuquay 48-60"
Lakeland 20-30"
Orangeburg 22-32"
[image:24.612.176.399.480.595.2]Figure 1.2 Location of the SRS relative to major geologic units (Modified from Hatcher et
al., 2007)
Figure 1.3 Cross section of sediments, categorized by depositional environment, underlying
the SRS. The black line on the small South Carolina map represents the cross
Figure 1.5 Depiction of a wedge zone where mica grades into vermiculite. (Modified from Goto et al., 2008.)
Wedge Zone
Mica
(illite)
Hydroxy Interlayered
Vermiculite
1.0 nm
Cs+
Cesium ion
K+
Potassium ion Oxygen atom Hydroxyl ion
Mg2+
Magnesium ion, hydrated
Mg2+ Mg2+
K+ K+ K+ K+ Cs
+
Cs
+
K+
Cs
CHAPTER 2.0 MATERIALS AND METHODS
2.1 Materials
The five soil samples studied were collected from the Savannah River Site,
approximately 25 miles southeast of Augusta, Georgia by the Westinghouse Savannah River
Company in 1996. In 1996, Findley (1998) collected the samples used in this project. A
stainless steel hand auger was used to collect the samples and the auger was washed between
sampling events. Samples were stored in labeled plastic containers. Findley (1998) described
the collection methods in more detail. Locations and sample depths are shown in Table 2.1. The
five samples used in this study were named after the soil series from which they were obtained,
namely Blanton, Fuquay, Lakeland, Orangeburg, and Vaucluse. Momoko Goto later prepared a
clay fraction from a portion of each soil sample in 2000 (Goto, 2001).
K-Ar apparent ages were determined for untreated portions of bulk soils and clay
fractions and for additional portions of these materials treated by acid extraction. Acid
extractions of bulk soil were under either strong conditions (strongly treated) or moderate
conditions (moderately treated). Clay fractions of the soils were subjected to acid extraction
under moderate treatment only. All acid-extraction procedures are described below. See Figure
2.1 for a flow chart of separations and treatment procedures and Table 2.2 for sample names and
2.1.1 Clay Separations
Because portions of the clay fractions separated by Goto (2001) arrived suspended in
solution, de-suspension was required. To remove the clay from suspension, Jackson’s (1969)
methods were followed. 15 ml of each clay suspension was poured into a centrifuge vial and
centrifuged for 10 minutes at 2,000 RPM. Clear supernatant liquid was removed and 20 ml of a
1M sodium acetate (NaOAc)-acetic acid (HAc) (pH=4.5) solution was added to ensure that
sodium substituted for the available exchangeable cations in the clay sized minerals. The
solution was shaken vigorously until the entire clay portion was resuspended. After centrifuging
for ten minutes, the NaOAc –HAC supernatant was removed and roughly 15 ml of deionized
water was added to rinse the clay. The mixture was shaken vigorously until the entire clay
portion was resuspended and centrifuged for 10 minutes at 2,000 RPM. The previous steps
(rinsing, re-suspending, and centrifuging) were repeated at least two more times until small
amounts of solid material appeared in the supernatant liquid, giving the liquid a very slight hazy
appearance. A final suspension was poured into a Saran Wrap-lined drying dish, placed in an
oven set to 50°C, and dried overnight. The remaining dried clay residue was powdered in an
agate mortar and weighed. This procedure produced a Na-saturated clay.
2.1.2 Acid Extraction Methods
Acid extraction of 0.1 g to 0.3 g test portions of bulk soil and roughly 0.05 g test portions
concentrated HNO3 and 50% water by volume) near 100°C was used for strong acid extraction
of bulk soil, while 10% HNO3 near 80°C was used for moderate acid extraction of bulk soil.
Moderate acid extraction of clay was by ~6% HNO3 at 80°C. Bulk soils were weighed before
and after leaching. The mixtures reacted for three hours with shaking at minute 5 and minute 15
and at subsequent intervals of fifteen minutes. The mixtures were then centrifuged at 2000 RCF
for ten minutes. The residue resulting from centrifuging was washed with deionized water,
centrifuged, and dried overnight at 50°C.
2.2 Potassium – Argon Age Methods
2.2.1 Assumptions
40
K is a long-lived radioisotope of potassium which decays to two daughter nuclides. By
either positron emission or electron capture, 40K can decay to 40Ar, or alternately, 40K can decay
by beta emission to 40Ca (Dalrymple and Lanphere, 1969). In clay minerals, non-exchangeable
K is present in the mica interlayer sites (Thompson and Hower, 1973). Consequently, the large
radiogenic 40Ar atoms (van der Waals radius of 1.88 Å) remain trapped within the micaceous
interlayers of clay minerals. Because the micaceous interlayer sites retain radiogenic Ar, the
ratio of parent 40K to radiogenic daughter 40Ar atoms found in the micaceous interlayer sites can
The decay of 40K follows the basic radioactive decay equation
- dN/dt = λN (Eq.1)
where dN/dt is the number of atoms that disintegrate per unit time, λ is the decay constant, and N
is the number of atoms of the radioactive species present. The apparent age (t) of a mineral using
the K-Ar system is determined by the equation below (Dalrymple and Lanphere, 1969):
t = (1/(λε+λβ))loge[(40Ar(rad)/40K)(λε+λβ)/λε) + 1] (Eq. 2)
where λε is the decay constant for decay of 40K to 40Ar and λβ is the decay constant for decay of
40
K to 40Ca. Accepted values for λε and λβ as recommended by the International Union of
Geological Sciences Subcommission on Geochronology of λε = 0.581 × 10⁻¹⁰ y-1 and λβ = 4.962
× 10-10 y-1 (Steiger and Jäger, 1977).
Dalrymple and Lanphere (1969) described five key assumptionsfor the determination of
mineral age using the K-Ar age equation. These assumptions include fixed decay constants of
40
K decay; a constant proportion of 40K to Ktotal throughout the materials to which the equation is
applied; all measured Ar is either from the sample or from the atmosphere (i.e., no extraneous Ar
other than atmospheric Ar has entered the system); the mineral has been a closed system since
mineral formation (t = 0); there has been no fractionation of 39K and 40K; and that the duration of
mineral formation is insignificantly small compared to the mineral’s age. Not all these
assumptions are applicable to this work. The concern in this case is not to obtain the age of the
original micas, but to use the K-Ar values to relate the micas in SRS soil with those in Piedmont
2.2.2 Analysis of K Content
K analysis was done by dissolution of dried materials for determination by atomic
absorption spectrophotometry. In a clean Savillex PFA container, 0.5 ml of a 10:3 ratio
concentrated HF:HNO3 acid mixture was added to approximately 30 mg of solid material. The
PFA containers were closed and heated under a fume hood on a hot plate at a temperature of
approximately 90ºC until the solid material was digested. Opening the PFA containers allowed
silicon to leave the solution as SiF4 as the vials were heated more strongly. Excess HF and
HNO3 also evaporated (into a fume hood) leaving nitrate salts. Following the precipitation of
nitrate salts in the bottom of the PFA container and acid fumes arising from within, a diluting
solution containing CsCl was added to dissolve the salts. The solution was then transferred to a
pre-weighed bottle. Additional CsCl solution was used to rinse the PFA vials. Rinse solutions
were added to the bottles and then the bottles were filled with more of the solution to ensure all
salts within the PFA container were effectively transferred to the pre-weighed bottle. Capping,
shaking, and reweighing the bottle completed preparation of the solution for K determinations.
A Perkin Elmer atomic absorption spectrophotometer, model 3110, was used to measure
atomic absorption by potassium from aspirated sample solutions within an air-acetylene flame at
a wavelength of 766.5 nm. The light source was a sodium-potassium hollow-cathode lamp
operated at 12 mA. During aspiration of each solution, ten measurements of absorbance were
made in increments of one second and the results were averaged. The process was repeated three
or four times. The instrument was set to zero before analyzing the test solutions and reference
interpolation of absorbance values between the absorbance values of two reference solutions of
known K concentration prepared from a potassium chloride standard. Guidelines for K
determination and a step-by-step procedure for dissolving soils are in Appendix A.
2.2.3 Argon Isotope Methods
Isotope analysis by mass spectrometry after isotope dilution with 38Ar, in accordance with
procedures provided by J.M. Wampler (see Appendix B), determined both the ratio of radiogenic
40
Ar to total 40Ar and the total amount of radiogenic 40Ar extracted from test portions of clay and
bulk soil. Test portions of approximately 30 mg of clay or 100 mg of bulk soil were weighed
into pre-weighed copper capsules, which were then closed by folding and crimping in order to
prevent loss of material and ensure proper capsule size.
The argon extraction process began by placing the copper capsules into a vacuum line.
(The main components of such a vacuum line are described in Dalrymple and Lanphere's 1969
book Potassium-Argon Dating and a schematic drawing of the line itself is shown in Figure 2.2).
After the capsules had been under vacuum at least overnight to eliminate essentially all adsorbed
water, the capsules were heated one at a time by an electrical resistance furnace. All materials
(except for moderately treated clays, described below) were heated by an internal resistance
furnace. A Powerstat variable transformer having ―power-levels‖ of zero to 100 controlled the
voltage to (and thus the temperature of) the furnace. Samples were heated to a temperature well
above the ~1060°C melting temperature of copper, causing complete melting of the clay sample
the viscosity of molten quartz grains may have led to retention of some of the argon therein. To
ensure slow release of gas from the capsule, the variable transformer setting was increased
stepwise once per minute in increments of five level units from an initial setting of
power-level 20. Powerstat settings were initiated at power power-level 20 and ended at 50. The maximum
power setting was held for ten minutes. A known amount of Ar highly enriched in 38Ar with
known isotopic composition was added from a reservoir during fusion of the samples to permit
quantification of 40Ar by isotope dilution.
In a second heating technique used for the moderately treated clays, the test portions of
moderately treated clay were heated by an external resistance heater, which consisted of
insulated resistance wire wrapped around a fused quartz tube. The treated clays were heated
slowly by raising the voltage in 1 V increments for 2 minute intervals and remaining on the
maximum voltage for ten minutes. The maximum temperature for the external resistance heater
was ~860°C, which was believed sufficient to remove Ar from the sample, but not hot enough to
cause the sample or the copper capsule to melt. The copper capsules were later removed for K
determinations. The treated clay fractions were analyzed for Ar in this manner because there was
not enough material for separate test portions for K and Ar measurements. A spike of 38Ar was
also added during heating of these samples for isotopic characterization.
Because the gases released from the clay samples heated by either method include
reactive gases that would interfere with argon-isotope measurements during mass spectrometry,
reactive gases were removed by condensation or by chemical reaction with heated Ti. From the
furnace, the released gases traveled through a U-tube cooled by liquid N2. Water and CO2 vapor
that did not condense with heated Ti, the purified mixture of argon from the sample and 38Ar
spike was adsorbed on charcoal in a finger cooled by liquid N2.
Care was given to account for the possibility that Ar may have been trapped in the crystal
lattice of the H2O and CO2 ice bound to the U-tube. Melting the ice destroyed the lattice and
released any trapped Ar, which continued to the cooled charcoal trap. A second liquid nitrogen
cooled finger within a U-tube trapped the H2O and CO2 as the gases moved further through the
line.
The cooled charcoal was then isolated from the front of the line by closing a valve. To
release the purified Ar from the cooled charcoal, the liquid N2 was removed and the charcoal
finger was warmed with tap water. Opening a second valve allowed the Ar to expand over the
course of 1.5 minutes into the mass spectrometer and a portion of the vacuum line having a
second Ti-getter.
The purified gas was analyzed by mass spectrometry with an Associated Electrical
Industries Limited type MS-10 mass spectrometer. A chart recorder provided a means of
recording the output current from the mass spectrometer as a proportional voltage).
Measurements were only made across the mass range where Ar peaks were expected. Variation
in accelerating voltage of the mass spectrometer was controlled by the spectrometer’s ―automatic
slow-scan‖ circuitry, which slowly decreased accelerator voltage over time. Because the MS-10
mass analyzer is a permanent magnet, the mass of the atoms detected by the spectrometer is
determined by the accelerating voltage according to the equation:
e/m = 2V/H2r2 (Eq. 3)
of the mass analyzer’s magnetic field, and r is the radius of the ion’s circular path through the
magnetic field to the ion detector. Variation in accelerator voltage permitted various isotopes of
Ar to be detected by the mass spectrometer. Consequently, peaks in signal from the mass
spectrometer, documented on the chart paper, corresponded with the relative quantities of Ar
isotopes 36Ar, 38Ar, and 40Ar detected by the mass spectrometer. (Minor peaks related to
hydrocarbon background signals at m/e = 37, 39, and 41 were also detectable. The signal at m/e
= 37 was measured to allow minor corrections to the argon-isotope peaks for hydrocarbon
background.) Care was given to record the baseline before and after each peak.
Measurement of the peak heights provided a means for quantifying the amount and
isotopic composition of the argon released from each test portion. Values of peak heights
(measured from baseline to peak) were inserted into a spreadsheet used for calculating K-Ar age
values from measurements of potassium and argon isotopes (J. M. Wampler, personal
communication, April 2010). Values of isotopic ratios were corrected by a mass discrimination
factor of -0.005 per mass unit for whole soil samples and -0.016 per mass unit for clay fractions,
as determined by Dr. Wampler from separate isotopic analyses of atmospheric argon.
Lastly, the Ar from a first test portion of the moderately treated Lakeland bulk soil was
lost just before isotope analysis during transfer to the mass spectrometer. A second set of test
portions for argon measurement was prepared from the remaining moderately treated bulk soils
to provide for the missing Lakeland data; however, not enough moderately treated soil remained
for both K and Ar analysis of the moderately treated bulk soils. The remaining material was used
for Ar isotope analysis of moderately treated Blanton, Fuquay, and Lakeland soils. (Argon
completed owing to further complications during Ar analysis.) Because the dearth of available
material precluded a second measurement of K, the K contents determined in association with
the first set of argon isotopic analyses were used in calculating K-Ar age values from the second
set of argon isotopic analyses. Of note is that transfer to copper capsules was achieved by
scooping the treated material from the containers for all test portions except the second set
prepared for argon isotopic analyses of the moderately treated bulk soils, which required
overturning the container and vigorously tapping the bottom of the containers because only small
amounts of the treated materials remained.
2.2.4 K-Ar Error Estimates
The error values assigned to the determinations of K, 40Arrad, and apparent age are based
on estimates of the uncertainty in measurements rather than on statistical analysis of repeated
measurements. Each error estimate is for the 95% confidence level, which corresponds to twice
the standard deviation (2σ) expected for the quantity had it been determined repeatedly. The
error estimates for measured quantities are based on long-term experience (J.M. Wampler,
personal communication, 2010) with the various kinds of measurement supplemented in some
cases by specific information on the internal precision of the actual measurements. For example,
the 2σ error in determination of the K-content of test solutions was set at 2% on the basis of
long-term experience (J.M. Wampler, personal communication, 2010), but in any case where the
internal precision of the several values determined by atomic absorption spectrophotometry
are larger than the usual owing to special difficulties in measurement. For example, larger than
usual uncertainty in the argon isotope ratios was estimated for the first five isotopic analyses of
argon, which were done when the electron-emission current of the mass spectrometer was not
properly stabilized.
Relative errors for calculated quantities were obtained by quadratic combination of
relative error terms from the independent quantities used in the calculation, where the error term
for each independent quantity is the estimated 2σ relative error times a factor (which may be
unity) that depends on the functional relationship of the variables (e.g., Dalrymple and Lanphere,
1969, Eq. 7-1). The quadratic combination is achieved by taking the positive square root of sum
of the squares of the component error terms. The equation used to calculate error in apparent age
includes a factor that accounts for the decreasing sensitivity of that error to error in 40Arrad/K as
apparent age increases, which was not included in Dalrymple and Lanphere’s (1969) Eq. 7-1.
The estimation of measurement errors on the basis of experience is an inexact process.
Hence the error values are themselves uncertain. Judiciously, the error calculated for an age
value is itself uncertain by at least 25% (of the error value, not of the age value). For that reason,
estimated errors in age value that exceed ± 10 million years have been rounded upward to a
value ending in 5 or 0 and the corresponding age value was rounded, upward or downward as
appropriate, to a value ending in 5 or 0. Early literature of radiometric dating sets a precedent for
such rounding. Finally, it must be noted that the estimates of analytical error do not include an
estimate of how ―sampling errors‖ (i.e., difficulty in taking equivalent small portions of soil
Table 2.1 Locations and depths of soil samples (Adapted from Findley, 1998)
Approximate Sample Coordinate s Sampling
Se rie s SRP N SRP E De pth
Blanton 33,348 54,468 10-20"
Fuquay 87,219 37,347 48-60"
Lakeland 95,318 82,743 20-30"
Orangeburg 93,938 65,113 22-32"
Table 2.2 Sample name and extraction conditions
S o il S e d im e n t %
N a m e S iz e C o n d it io n o f A c id E xt ra c t io n H N O3 °C B la nto n B ulk S o il No Ac id Extra c tio n
F uqua y B ulk S o il No Ac id Extra c tio n La ke la nd B ulk S o il No Ac id Extra c tio n Ora nge burg B ulk S o il No Ac id Extra c tio n Va uc lus e B ulk S o il No Ac id Extra c tio n
B la nto n B ulk S o il M o de ra te C o nditio ns o f Ac id Extra c tio n (F irs t R un) 10 80 F uqua y B ulk S o il M o de ra te C o nditio ns o f Ac id Extra c tio n (F irs t R un) 10 80 La ke la nd B ulk S o il M o de ra te C o nditio ns o f Ac id Extra c tio n (F irs t R un) 10 80 Ora nge burg B ulk S o il M o de ra te C o nditio ns o f Ac id Extra c tio n (F irs t R un) 10 80 Va uc lus e B ulk S o il M o de ra te C o nditio ns o f Ac id Extra c tio n (F irs t R un) 10 80 B la nto n B ulk S o il M o de ra te C o nditio ns o f Ac id Extra c tio n (S e c o nd R un) 10 80 F uqua y B ulk S o il M o de ra te C o nditio ns o f Ac id Extra c tio n (S e c o nd R un) 10 80 La ke la nd B ulk S o il M o de ra te C o nditio ns o f Ac id Extra c tio n (S e c o nd R un) 10 80 B la nto n B ulk S o il S tro ng C o nditio ns o f Ac id Extra c tio n 50 100 F uqua y B ulk S o il S tro ng C o nditio ns o f Ac id Extra c tio n 50 100 La ke la nd B ulk S o il S tro ng C o nditio ns o f Ac id Extra c tio n 50 100 Ora nge burg B ulk S o il S tro ng C o nditio ns o f Ac id Extra c tio n 50 100 Va uc lus e B ulk S o il S tro ng C o nditio ns o f Ac id Extra c tio n 50 100 B la nto n C la y F ra c tio n No Ac id Extra c tio n
F uqua y C la y F ra c tio n No Ac id Extra c tio n La ke la nd C la y F ra c tio n No Ac id Extra c tio n Ora nge burg C la y F ra c tio n No Ac id Extra c tio n Va uc lus e C la y F ra c tio n No Ac id Extra c tio n
Figure 2.1 Flowchart of subdivision and treatment of soil samples
Original bulk soil sample (taken in 1996). Brackets [ ] denote portions of the bulk soils and
portions of Goto’s (2001) clay fractions that were not part of this study.
[Portions studied by Findley (1998)]
[Portions (if any) retained at Savannah River Site]
Portion obtained for work by Goto and others (Goto et al., 2008)
o Portion for separation of clay from sand and silt
[Sand and silt fractions—discarded]
Clay fraction
[Portions studied by Goto et al. (2008)]
Portion used in this study (removed from suspension)
Test portion for determination of K in untreated clay
Test portion for Ar isotope analysis of untreated clay
Portion for moderate acid extraction
Extracted material
Solid residue
Single test portion for both Ar and K measurement
Remaining clay (in some cases only)
[Remaining clay (still in suspension)]
o [Other portions of bulk soil studied by Goto et al. (2008)]
o Test portion for determination of K in untreated soil
o Portion for strong acid extraction
Extracted material
Solid residue
Test portion for Ar isotope analysis (all the material was taken for this test
portion)
o Portion for moderate acid extraction
Extracted material
Solid residue
Test portion for determination of K
Test portion for Ar isotope analysis
CHAPTER 3.0 RESULTS
3.1 K-Ar Apparent Age Values
The results of K-Ar age analyses are summarized in Table 3.1. The error values shown
on Table 3.1 represent the estimated value of two standard deviations from the apparent age.
Apparent age values of all materials and all conditions of acid extraction are depicted graphically
in Figure 3.1. A comparison of the apparent age values for untreated bulk soil and untreated clay
fractions is shown in Figure 3.2. The age values of all materials (including both bulk soil and
clay fractions and regardless of treatment conditions) range from 255 Ma to 975 Ma and average
499 Ma. The apparent age values of the untreated clay fractions were all lower than the
corresponding age values for untreated bulk soils. In the untreated clay fractions, the apparent
ages range from 285 to 370 Ma, averaging 325 Ma. Apparent ages of untreated bulk soils range
from 370 to 850 Ma, averaging 598 Ma. For every soil sample, age values and 2σ estimated
errors are greater for bulk soils than corresponding values for clay fractions (Table 3.1).
3.1.1 K-Ar Ages of Clay Fractions
Together, apparent age values of all clay fraction test samples range from 255 to 370 Ma
and numerically average 311 Ma. The clay fraction age values have much less variance than the
ages of bulk soils. The age values of clay fractions treated under moderate conditions range from
decreased as a result of acid extraction. Statistically, however, the age values for four of the five
untreated clay fractions are the same (within estimated error) as those for the treated clay
residues.
3.1.2 K-Ar Ages of Bulk Soil
For bulk soil test portions (untreated, moderately treated Run 1, and strongly treated),
apparent age spans from 370 to 975 Ma and averages 634 Ma, with no apparent grouping of ages
around one consistent age value (Table 3.1, Figure 3.1, Figure 3.4). Compared to the relatively
consistent clay fraction age values, there is greater variation in apparent age among all bulk soils.
Acid extraction of the bulk soils yielded substantially different apparent age values than the
untreated samples, as depicted in Figure 3.1. Three out of the four moderately treated (10%
HNO3, 80°C) bulk soils from Run 1 resulted in the highest recorded age values per soil sample,
having values ranging from 515 to 975 Ma with an average of 676 Ma (Table 3.1, Figure 3.1,
Figure 3.4). The age values of strongly treated (50% HNO3, 100°C) bulk soils range from 500 to
770 Ma and average 636 Ma (Table 3.1, Figure 3.1, Figure 3.4). With the exception of the
Orangeburg soil, strongly treated soils yielded lower age values than the Run 1 moderately
treated soils. The test portion of Lakeland bulk soil treated under moderate conditions was lost
to the vacuum pump during transfer to the mass spectrometer for Ar isotope analysis and is not
shown in the results.
Enough material of moderately treated Blanton, Fuquay, and Lakeland soils remained to
treated soils in Run 2 vary from 415 to 720 Ma and average 520 Ma (Table 3.1, Figure 3.1,
Figure 3.5). For the only two samples possessing measured age values from both Run 1 and Run
2, the age values in Run 2 are less than the age values in Run 1.
Strongly treated soils and moderately treated soils in Run 1 all yielded higher age values
than the ages of the moderately treated soils in Run 2. Fuquay’s Run 2 apparent age of 415 Ma
is the lowest of any measurement among the treated soils, but it is not significantly lower than
the value for Blanton Run 2. When the results of Run 2 are combined with the other results, the
overall average apparent age of bulk soils becomes 614 Ma (previously 634 Ma); the average for
moderately treated bulk soils becomes 609 Ma (previously 676 Ma); and the average for all
particle sizes and treatments is 501 Ma (previously 499 Ma).
3.1.3 Summary of K-Ar Data
Acid extraction of the clay fractions resulted in insignificant (one case excepted) but
consistent decrease in numeric age values. Only one soil sample showed a difference in age
values outside of the error margins. Bulk soils exhibited larger age values and a larger variation
of the age values. Bulk soils generally showed the greatest age values after moderate treatment.
With one exception, strong treatment of bulk soils resulted in age values between those of
3.2 K Analyses
The results of K analysis for all samples are shown in Table 3.1 and depicted in Figures
3.6 - 3.9. The mass fraction of K averages 0.07% for all bulk soil test portions and averages
0.68% for all clay fraction test portions. Among bulk soils (for all treatment conditions), the
percent K by mass ranges from 0.02% to 0.14% (Figure 3.8). Differentiation among treatment
conditions shows untreated bulk soils averaging 0.08% K, moderately treated bulk soils
averaging of 0.06% K, and strongly treated bulk soils averaging 0.05% K. For all samples, bulk
soils had a higher concentration of K than treated samples of the same series. Untreated bulk
soils showed higher concentration of K than moderately treated soils for all five test-portions
(Figure 3.8). Likewise, the untreated soils also yielded a higher concentration of K than the
strongly treated bulk soils.
The potassium concentration in clay fractions ranges from 0.50% to 0.88% K (Figure
3.7). Behaving conversely to the bulk soils, acid extraction of clay fractions resulted in increased
concentration of K (Figure 3.9). Untreated clays had an average of 0.62% K while moderately
treated clays averaged 0.75% K. The average value for clays regardless of acid extraction
conditions is 0.68% K.
3.3 Ar Analyses
Clay fractions show a greater concentration of 40Ar(rad) (pmol/g) than the bulk soil
(pmol/g) following acid extraction (Figure 3.11). Three of the five clay fractions showed
increased 40Ar(rad) (pmol/g) after moderate acid extraction, but the increases were small.
The behavior of Ar in bulk soil (Figure 3.12) with acid treatment is different than the
behavior of Ar in the clay fractions. In strongly treated bulk soils, 40Ar(rad) (pmol/g) is lower than
in untreated bulk soil for all five soils. Of the seven total 40Ar(rad) (pmol/g) values for moderately
treated bulk soils, six values are higher than those for strongly treated soils and the seventh value
(Lakeland) is equivalent within error. In the first run, two moderately treated soils yielded values
of 40Ar(rad) (pmol/g) the same within error as those for untreated soils; values for the other
moderately treated soils are slightly below those for the untreated bulk soils. Values for 40Ar(rad)
(pmol/g) in the second run are lower than those in the first run in the two cases where
comparison is possible, and two of the three measured second run values are significantly lower
Table 3.1 Results of K-Ar measurements
S a m p le H N O3 T e m p e ra t u re K ( %) R a d io g e n ic A rg o n A p p a re n t A g e ID % °C ( b y m a s s ) ( % o f 4 0A r) ( p m o l/ g ) ( M a )
B l B ulk S o il, No Tre a tm e nt 0.05 ± 0.001 76.3 72 ± 2 630 ± 20
F u B ulk S o il, No Tre a tm e nt 0.14 ± 0.003 58.6 96 ± 10 370 ± 35 La B ulk S o il, No Tre a tm e nt 0.07 ± 0.001 74.3 104 ± 3 670 ± 20
Or B ulk S o il, No Tre a tm e nt 0.11 ± 0.002 73.4 103 ± 8 470 ± 35 Va B ulk S o il, No Tre a tm e nt 0.03 ± 0.001 68.3 54 ± 2 850 ± 25
B l B ulk S o il, M o de ra te Tre a tm e nt (R un 1) 10 80 0.04 ± 0.001 81.8 64 ± 2 695 ± 25 F u B ulk S o il, M o de ra te Tre a tm e nt (R un 1) 10 80 0.10 ± 0.002 81.2 101 ± 7 515 ± 35
La B ulk S o il, M o de ra te Tre a tm e nt (R un 1) 10 80 0.05 ± 0.001 - - - -Or B ulk S o il, M o de ra te Tre a tm e nt (R un 1) 10 80 0.10 ± 0.002 85.0 106 ± 7 520 ± 30
Va B ulk S o il, M o de ra te Tre a tm e nt (R un 1) 10 80 0.02 ± 0.000 70.7 49 ± 2 975 ± 40 B l B ulk S o il, M o de ra te Tre a tm e nt (R un 2) 10 80 0.04 ± 0.001 61.2 37 ± 4 425 ± 40
F u B ulk S o il, M o de ra te Tre a tm e nt (R un 2) 10 80 0.10 ± 0.002 59.7 79 ± 10 415 ± 50 La B ulk S o il, M o de ra te Tre a tm e nt (R un 2) 10 80 0.05 ± 0.001 63.4 76 ± 8 720 ± 65
B l B ulk S o il, S tro ng Tre a tm e nt 50 100 0.05 ± 0.002 81.7 59 ± 2 600 ± 30 F u B ulk S o il, S tro ng Tre a tm e nt 50 100 0.07 ± 0.003 66.9 68 ± 6 500 ± 45
La B ulk S o il, S tro ng Tre a tm e nt 50 100 0.05 ± 0.003 77.2 83 ± 3 770 ± 40 Or B ulk S o il, S tro ng Tre a tm e nt 50 100 0.08 ± 0.004 72.4 93 ± 4 570 ± 35
Va B ulk S o il, S tro ng Tre a tm e nt 50 100 0.02 ± 0.001 61.5 34 ± 2 740 ± 50 B l C la y F ra c tio n, No Tre a tm e nt 0.83 ± 0.019 44.4 537 ± 24 340 ± 20
F u C la y F ra c tio n, No Tre a tm e nt 0.55 ± 0.016 47.5 300 ± 20 290 ± 20 La C la y F ra c tio n, No Tre a tm e nt 0.56 ± 0.013 31.3 366 ± 18 340 ± 20 Or C la y F ra c tio n, No Tre a tm e nt 0.50 ± 0.016 54.4 270 ± 16 285 ± 20
Va C la y F ra c tio n, No Tre a tm e nt 0.66 ± 0.015 56.9 471 ± 15 370 ± 15 B l C la y F ra c tio n, M o de ra te Tre a tm e nt 6.2 80 0.85 ± 0.031 58.0 516 ± 41 320 ± 25
F u C la y F ra c tio n, M o de ra te Tre a tm e nt 6.2 80 0.69 ± 0.009 57.9 325 ± 20 255 ± 25 La C la y F ra c tio n, M o de ra te Tre a tm e nt 6.2 80 0.74 ± 0.028 55.2 444 ± 20 320 ± 20
Figure 3.1 Apparent age values for all materials.
[image:52.612.76.541.94.484.2]Figure 3.4 Apparent age values by acid concentration during extraction
(not including second run of bulk soils).
[image:55.612.72.541.94.492.2]Figure 3.5 Apparent age values by acid concentration (including the second run of
moderately treated bulk soils).
Figure 3.9 Mass fraction of K in materials as a function of acid concentration during
CHAPTER 4.0 DISCUSSION
4.1 Interpretation of K Determinations
4.1.1 K Analysis of Bulk Soils
Moderate and strong acid extractions of bulk soil test portions resulted in decreases in
measured percentages of K by mass (Figure 3.8). Furthermore, two soils, Fuquay and
Orangeburg, had even lower concentrations of K in strongly treated soils than in moderately
treated soils. The Blanton, Lakeland, and Vaucluse soils had no substantial difference in
concentration of K between the residual materials after moderate and strong treatments. The
change in mass fraction of K in the solid during acid extraction depends on the mass of K
extracted and on the change in mass of solid material during the extraction. Acid extraction
removes exchangeable K and at least part of the ―fixed K‖ in soils (Wood and DeTurk, 1940).
Very strong acid extraction may also remove some of the ―primary mineral K‖ (as defined by
Wood and DeTurk, 1940) from soil. (It was a purpose of this study to investigate the degree to
which strong acid extraction removes K from remnants of primary minerals in SRS soils.) Soil
mass decreases during acid extraction owing to dissolution of acid-soluble minerals such as
gibbsite and iron hydroxyoxides, to partial dissolution of silicate minerals such as kaolinite and
HIV, and to exchange of heavier ions (for example, K+, Mg(H2O)62+) by hydronium ions.
Moderate treatment removed exchangeable K and likely removed K that was ―fixed‖ (in
treatment apparently did not remove K from the remnants of primary mica in the HIV, for it
seems to have removed virtually none of the radiogenic argon.
The stronger treatment removed about half of the K from the Fuquay sample, about 1/3 of
the K from the Orangeburg and Lakeland samples, and smaller fractions of the K from the
Blanton and Vaucluse samples. The specific amounts of radiogenic argon also decreased during
the harsher extraction, which indicates that the extraction affected the remnants of primary mica
in the HIV and removed both K and radiogenic argon.
4.1.2 K Analysis of Clay Fractions
For all five soil samples, the K concentration of the clay fraction increased as a result of
acid extraction under moderate conditions (Figures 3.6 and 3.7). This increase in K supports the
concept that acid extraction under these conditions effectively removes the acid-soluble
components of the clay fraction such as gibbsite, which is soluble in the conditions used in this
experiment. As acid dissolution removes materials that do not contain K (gibbsite, perhaps some
kaolinite, vermiculite, etc.), the proportion of non-exchangeable K in insoluble materials (such as
micaceous interlayers in HIV) becomes larger compared to the mass of the residual solid.
4.1.3 K Analysis Summary
The percentage of K present in the clay fractions is much greater than the percentage of K
components of the clays and the lack of K in the quartz-rich sand fraction. In bulk soils, which
had not been treated to remove exchangeable K, acid extraction resulted in lower K. In clay
fractions, from which exchangeable K had been removed by Jackson’s pre-treatments, acid
extraction resulted in higher K (Figure 3.6).
4.2 Interpretation of Results, Ar Analysis
Clay fractions show a greater concentration of 40Ar(rad) than the bulk soil counterparts
(Figure 3.10). Because the sand component of the bulk soils is predominantly composed of
quartz, low amounts of K and Ar are present in the bulk soil.
For the clay fractions, there was little change in 40Ar (pmol/g) following acid extraction
(Figure 3.11). An apparent trend of acid extraction yielding greater Ar concentrations is
probably due to the dissolution of non-K bearing clay (gibbsite) during acid extraction. The
removal of mass by dissolution reduced the total mass of clay material, causing an increase in the
specific amount of 40Ar (pmol/g) in the remaining clay material.
The residues of bulk soil (Figure 3.12) after the stronger acid extraction have less 40Ar(rad)
(pmol/g) than untreated samples. The removal of some of the radiogenic Ar indicates that
remnants of mica in the soil, whose interlayers had not yet been opened by weathering, can lose
radiogenic Ar (and K) to strong acid under very harsh conditions.
Moderately treated bulk soils for Blanton and Fuquay are higher in 40Ar(rad) in the first run
than the second run, possibly because of a higher content of clay in the first run. There may have