www.hydrol-earth-syst-sci.net/12/1285/2008/ © Author(s) 2008. This work is distributed under the Creative Commons Attribution 3.0 License.
Earth System
Sciences
Infiltrative instability near topography with implication for the
drainage of soluble rocks
P. Genthon1and A. Ormond2,*
1Pal´eotropique, IRD, BP A5 98848 Noum´ea, New Caledonia 2DTP, Obs. Midi Pyr´en´ees, Toulouse, France
*now at: HydroSciences, IRD BP11416 Niamey, Niger
Received: 30 January 2008 – Published in Hydrol. Earth Syst. Sci. Discuss.: 12 March 2008 Revised: 4 August 2008 – Accepted: 3 October 2008 – Published: 1 December 2008
Abstract. We present here numerical modeling of infiltra-tion instability near a topographic edge of a water-saturated porous slice by analogy with a limestone formation devoid of initial heterogeneities such as fractures faults or joints and limited by a vertical cliff. In our runs a first dissolution finger develops near the cliff edge, and ends to intersect it above its mid height. Additional fingers develop upstream with a de-creasing growth rate and an inde-creasing width. This results from the decrease of the infiltration velocity with distance to the cliff in our models. A sensitivity study shows that a larger permeability contrast between the fingers and the ini-tial undissolved porous medium produces a larger number of fingers, while increasing the dispersivity (lower Peclet num-ber) produces wider fingers. A slower reaction rate (lower Damkh¨oler number) produces fingers that follow the initial flow lines, since dissolution occurs simultaneously along the entire finger. These results suggest that alteration by disso-lution of limestones or other soluble formations may pro-duce different underground channel structures in the same drainage basin due to local changes of the non-dimensional P eandDanumbers.
Correspondence to: P. Genthon ([email protected])
1 Introduction
transfer numerical models to define the morphology of dis-solution channels that develop inside a porous medium, as a function of the non-dimensional parameters of the system, which are the Peclet and Damk¨ohler numbers (hereafterP e andDa). LargeP eandDacorrespond to the strong insta-bility regime, where fingering may set up on any heterogene-ity of the porous medium. ForP e<5, dispersion prevents the development of the instability. Moreover, Ormond and Ortoleva (2000) have modeled the fingering process with a Brinckman equation, which allows coupling of Darcy flow in the porous medium with Navier Stokes flow in voids, and compared it with a Darcy model, where dissolution zones were described by a several order of magnitude permeabil-ity increase. They conclude that although the propagation of fingers was faster when the entire medium was subject to dis-solution, the general wormholing pattern was rather insensi-tive to the equation used in dissolved area. This suggests that flow focusing and finger competition are not sensitive to the kind of equation used in the finger, once flow is much easier in dissolution zones.
Siemers and Dreybrodt (1998) and Kaufmann and Braun (1999) compute the dissolution pattern occurring in a fracture set with realistic boundary conditions including topography. Further publications improve the description of the porous medium, introducing a dual fissures set or a porous matrix exchanging fluid with fractures (Kaufman and Braun, 2000; Gabrovsek et al., 2004). Gabrovsek and Dreybrodt (2001) allow fluctuation of the water table and Kaufmann (2003) considers flow inside the unsaturated zone. These publications consider topography as a driving force for flow. However, their initial fissure network constitutes a set of large-scale heterogeneities that channel dissolution. We propose here that dissolution should be also modeled in an homogeneous porous medium to understand how the insta-bility works by itself in the presence of topography. Our models consider mainly fast reactions, by reference to cal-cite dissolution, but owing the evidence of pseudo-karstic structures in silicated rocks altered under tropical climate (Trescases, 1975; Wray, 1997; Willems et al., 2002), the in-fluence of a slower dissolution rate is briefly explored. Our results should be viewed as a first step to bridge the gap be-tween infiltration instability models using an initial 1D circu-lation scheme such as those of Ormond and Ortoleva (2000) and Golfier et al. (2002) and dissolution events occurring at the scale of a geological formation.
The simplifications introduced in the coupled equations of infiltration instability are discussed first. These simplifica-tions allow to develop a compact, robust and efficient nu-merical model for unstable dissolution of porous media with fast dissolution rate. Then the growth of dissolution struc-tures and a sensitivity analysis are presented. Finally possi-ble consequences for the porosity distribution in carbonated and other soluble rocks are discussed.
2 The model
2.1 Equations
We use equations able to capture the nature of the infiltrative instability and to produce a simple and fast code. We model a water-saturated medium, where the Darcy flow Eq. (1) links the filtration velocityvto the pressure gradient∇P. Hereµ stands for the fluid dynamic viscosity,ρfor its density,kfor the porous medium permeability, andgis the gravity.
µ
kv= −∇P +ρg (1)
This equation accounts well for flow in a carbonate-cemented sandstone, where a silicated matrix remains after dissolution of the cement, but is only an approximation inside a carbon-ate where the whole matrix is soluble. Here, dissolved zones are characterized by a several orders of magnitude perme-ability increase.
Our reaction-transport equation considers a single chem-ical species, say H+ dissolving the porous matrix with a first order kinetics. The concentration of the active species at equilibrium with limestone is assumed to be negligible. Then, Quintard and Whitaker (1999) and Golfier et al. (2002) have shown that the reactive transport of this species can be described by Eq. (2) whereCis the averaged solute concen-tration of the species.
ϕ∂C
∂t +v·∇C=D∇
2C−αC (2)
Here,ϕis the porosity, the first term depicts the accumulation of the species, the advection velocity in the second term is the filtration velocity, the third term describes mixing of chem-ical species by a diffusion process of diffusivityD, and the first order kinetics reaction is characterized by the constant α. The use of only one chemical species, of a single diffusiv-ityDfor the mixing of species, and of first order kinetics are clearly approximations. However, more sophisticated disper-sivity models and reaction kinetics could be easily included. As the time constant needed for Eq. (2) to reach a steady so-lution is much lower than the one required for a significant change of porosity, the accumulation term may be canceled in the Eq. (2). This point will be further quantified in the section devoted to the numerical model. Moreover, in our models, the amount of fluid advected during a time step is several orders of magnitude larger than the increase of fluid volume due to the increase of porosity by dissolution. This allows also to adopt the steady state approximation of the mass conservation Eq. (3)
∇·v=0 (3)
Equations are used in their non-dimensional form (1’)– (3’), with the distance scaled by the topographic jump, h, the permeability byk0, the permeability before dissolution,
the concentration by C0, the concentration of the
infiltrat-ing fluid, the filtration velocities by v0=ρgk0/µ which is
the velocity induced by the gravity in a vertical slice of the initial porous medium. The non-dimensional pressure is P0=(P−ρgz)/ρgh. These non dimensional parameters are valid if the fluid density and viscosity are constant during dis-solution, which is the case for low solubility minerals such as limestone and silicates. Fluid density changes, such as those involved during karst development in evaporites, could be considered by introducing explicitly in the Eq. (1) the con-centration dependence of density.
k0
k v
0= −
∇0P0 (4)
P ev0·∇0C0= ∇02C0−P e Da C0 (5)
∇0·v0=0 (6)
Equation (5) includes the non-dimensional numbers P e=ν0h/DandDa=αh/ν0that are those of the infiltration
instability, to which should be added the permeability ratio between the fully dissolved and the non dissolved media (Rk) and the aspect ratio of the modeled area, which is 2 in our models. It can be seen in their definitions that P e measures the ratio between advection and diffusion, while Dameasures the ratio of reaction rate by advection.
Equations (4) and (6) are combined to obtain:
∇0·
k
k0 ∇0P0
=0 (7)
2.2 Geometry and parameters
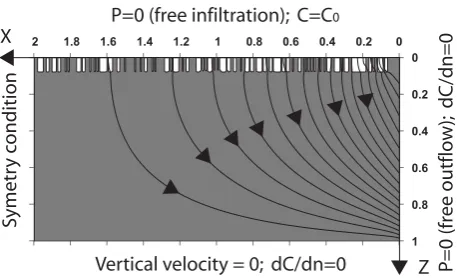
The initial condition and boundary conditions are pictured on Fig. 1. Our equation set is solved on a 2-dimensional area consisting of a slice of porous medium with a height h of 100 m, an aspect ratio of 2, an initial permeabilityk0
of 3×10⁻¹⁴m2, and a porosityϕ0equal to 0.3, which is
as-sumed to overlie a horizontal impervious medium. The right boundary of this porous slice is a vertical surface from which water is free to escape and that corresponds to a vertical cliff. The constant atmospheric pressure (P=0) is applied there. This corresponds toP0=−z/ h. A symmetry condition is ap-plied at the left boundary. The flow lines are curved and con-vergent toward the right free boundary. Moreover, the infil-tration velocity (i.e. the vertical Darcy velocity) is maximum near the free boundary and decreases toward the upstream region, for example from 0.82 atx=0.2 to 0.12 atx=0.99.
A constant concentration of active species C0=10−5mol/kg is maintained at the upper surface
of the model. The characteristic filtration velocity is ν0=3×10⁻⁷m/s, withµ=10−3Pas andg=10 ms−2, and the
characteristic time scale is h/ν0=3×108s≈10 yr. In our
Figure 1
2 1.8 1.6 1.4 1.2 1 0.8 0.6 0.4 0.2 0
Vertical velocity = 0; dC/dn=0 P=0 (fr
ee outflo
w);
dC/dn=0
S
ymetr
y c
ondition
P=0 (free infiltration); C=C0
0
0.2
0.4
0.6
0.8
1
[image:3.595.313.542.63.202.2]Z X
Fig. 1. Geometry and boundary conditions of our models. Initial
(before dissolution) flow lines are drawn. The white stripes at the top of the model represent the vertical random high permeability slots introduced to insure vertical infiltration of water.
models the diffusion term describes hydrodynamic disper-sion occurring due to the tortuous paths followed by fluid particles inside the porous medium. It operates mainly near the borders of wormholes, where the concentration gradient is perpendicular to the fluid velocity. Hence, the transverse dispersivity is used, which is estimated to 0.3 m in the scale range 10–100 m, according to Gelhar et al., 1992. With the velocityν0, this correspond to a diffusivityD=10−7m2s−1
which yieldsP e=300. The constantα has been estimated for limestone by considering thatα=KdissS0/C0whereKdiss
is the kinetic constant for dissolution of calcite, and S0 is
the specific interfacial area between the solid and the fluid, for which a value of 102m2/kg has been adopted. The dissolution of calcite is a fast reaction up to a 60% or to a 90% saturation index, according to Palmer (1991) and to Dreybrodt (1996), respectively. Here, we use the constantα deduced from the results of Dreybrodt (1996) up to complete saturation in order to ensure a first order kinetics. This leads to Kdiss=2×10⁻⁷molm−2s−1 which yields Da=7×10⁸.
Considering that our fluid velocity is ν0/ϕ and that 1/α is
the time constant of the dissolution reaction, fluid covers a distance of 5×10⁻⁷m during reaction, and the reaction front is much thinner than the grid mesh. This allows us to assume an infinitely thin reaction front and thus infinite Da. With the Da of 10 used for the test of a finite dissolution rate, however the front is 10 m thick, and several grid points are out of equilibrium. P e values in the range of 30–3000 are explored by changing the initial permeability of our layer. Rk values between 10 and 105are considered.
The characteristic time scale is given byh/v0and is equal
to 1, 10, and 100 yr for P e equal to 3000, 300, and 30, respectively.
2.3 Approximations and numerical methods
Pe = 30 Da infinite
Pe = 300 Da infinite
Pe = 300 Da = 3
a) b) c)
d) 1.0 0.75 0.5 0.25 0.
Dissoluton amount (imposed)
0.001 0.35 0.55 0.75 0.95
Non dimensional active species concentration (computed)
Advection of the porosity front with inifinite Da VN
VNdt
γ C' VNdt
[image:4.595.111.491.60.428.2]Figure 2
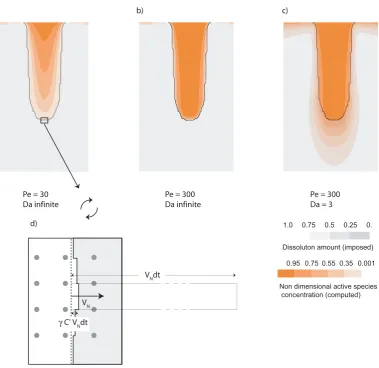
Fig. 2. Examples of flow and concentration in a imposed finger-like porosity distribution, for differentP eand Da. The width of the
concentration front is controlled byP ein (a) and (b) and byDain (c). The finger boundary is defined by the heavy grey line. (d) is an enlargement of the finger tip illustrating the dissolution process in the infiniteDacase. Due to theγ factor a huge amount of fluid flows through the interface, before it is significantly advected by dissolution (from the straight dotted line to the broken heavy line) at theγ V C0
velocity.
interface between non dissolved limestone and voids created by dissolution. The first one consists in tracking a sharp in-terface without allowing it to spread on several grid points. The second one consists in accounting the permeability jump arising at this interface.
Assuming instantaneous dissolution allows key simplifica-tions: firstly the time constant required by the mass transfer equation (Eq. 2) to reach steady state depends on advection and diffusion, only. In our models diffusion operates in the fingers and at their border, tending to smooth the concen-tration of active species inside them (Fig. 2a, and b). Thus, the characteristic time to reach steady state in Eq. (2) is the one required to establish the concentration profile inside the longest and widest finger, which is nearly equal to the time
required for the fluid to travel along the whole length of the finger, i.e. of the order of magnitude of 1. It results that steady state in Eq. (2) is reached in a non-dimensional time of 1.
Secondly, the modeled slice can be divided in a non dis-solved volume, where no active species may be present, and a fully dissolved volume, where no limestone is present and therefore no reaction may occur. Thus, Eq. (2) can be sim-plified to yield:
P ev0∇0C0= ∇02C0(fully dissolved volume) (8)
C0=0(non dissolved volume) (9)
reaction term, while Eq. (9) indicates that infinitely fast dis-solution reaction brings the concentration of active species to zero as soon as there is still some limestone to dissolve. Since the dissolution front is infinitely thin, the combination of Eqs. (8) and (9) matches the whole volume of the modeled slice.
Then, dissolution reduces to the advection of the infinitely thin porosity front at a velocity γ vNC0 with γ=(1−1ϕ)
C0
CS, vN being the normal velocity at the interface, and(1−ϕ)Cs
the carbonate volume concentration inside the solid phase (Fig. 2d). Considering a molar mass and density of 100 g and 2.800 kgm−3 for calcite and our concentration of ac-tive species in the infiltrating fluid of 10−5mol/kg, it comes γ=5×10⁻⁷. Finally, asγ1, the interface moves at a much lower velocity than the filtration velocity and the time needed to record a significant porosity change is much larger than 1. This implies that the steady state mass transfer Eq. (5) may be used.
Multigrid methods, known for fast convergence in the presence of steep gradients (Hackbusch, 1985) are employed to solve alternatively Eq. (7) and the combination of Eqs. (8) and (9) on a 257×129 grid with some checks of consistency on a 513×257 grid. Equation (9) is applied as a constraint in-side the non dissolved volume. The advection term of Eq. (8) is discretized with the finite-analytic method of Lowry and Li (2002), which prevents spreading by artificial diffusion of concentration gradients. The non diffusive VOF method, de-veloped by Hirt and Nichols (1981) is adopted to track sharp porosity fronts. The time step is adjusted so that less than 1/10 of the volume of a mesh element is dissolved at each iteration. Coupling the set of Eqs. (8) and (9) with Eq. (7) is achieved via permeability changes. The multigrid solver and the VOF method have been checked against analytical solu-tions. The whole code has been carefully checked against the examples given by Ormond and Ortoleva (2000) in their Figs. 1 and 2.
3 Results
In our first models, the upper right corner was first dissolved and attracted further dissolution, that was then concentrated at the surface to produce an analog of a river. To constrain vertical infiltration from the surface, a series of vertical high permeability slots, analog to an epikarst, were imposed ran-domly down to an 8-m depth. No dissolution was allowed inside these slots as well as on a 15 m length at the upper right corner. This does not imply that no dissolution occurs inside the epikarst, but that here dissolution results in verti-cally organized structures that allow infiltration of rainwater. For easier comparison, the distribution of the vertical slots is identical in all the simulations. However several initial distri-butions of vertical slots have been checked and the influence of this parameter is discussed in the forthcoming sections.
3.1 The reference case
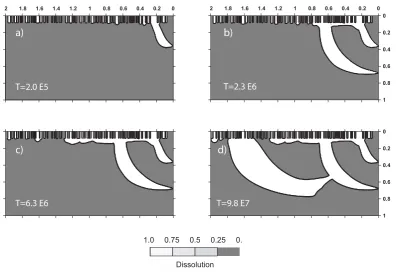
Our reference case is characterized byRk=100,P e=300 and infinite Da. A first finger develops atx=0.25 in a direction nearly parallel to the initial flow lines. The finger curves in the immediate surrounding of the free boundary and ends crossing the cliff at a z=0.65 after a time lapse of 2×10⁵ (Fig. 3a). The position of this first finger depends slightly on the initial permeability distribution. After the breakthrough, neither the porous flow nor the water saturated medium as-sumptions are valid and dissolution is no longer computed in the finger. The pressure in this finger is almost equal to the at-mospheric pressure due to the large permeability ratio. This induces on subsequent fingers an attraction effect similar to that of the right topographic edge.
The second finger grows at x=0.7 and reaches the cliff at z=0.3 after a non-dimensional time lapse of 2.3×10⁶ (Fig. 3b). The development of this second finger is signif-icantly slower than the first one even considering its larger length before breakthrough. It is slightly wider than the first one. This can be viewed as a consequence of the decreas-ing initial fluid velocity in the upstream direction resultdecreas-ing in a decrease of the local Peclet number and an increasing smoothing of aggressive species inside the finger due to dif-fusion. Thus, only wider fingers can develop, an effect that has already been noted by Steefel and Lasaga (1990).
Two fingers that set on atx=1.1 andx=1.2 are prevented from developing by hydrodynamic capture of the aggressive fluid by the second finger through a superficial horizontal dis-solution drain (Fig. 3c). The third finger is wider than the previous ones and develops after a longer while. It follows firstly the initial flow lines and then is captured and converges toward the second finger after a non-dimensional time lapse of 9.8×10⁷(Fig. 3d).
Simulations with various initial vertical high permeability slots distributions gave slightly different finger distributions all with the same common characteristics: (i) a first finger arrives above mid cliff height after a short time lapse, (ii) 2 or 3 additional fingers reach the cliff nearz=0.3, their width and the duration of their growth increasing in the upstream direction, (iii) fingers growing near another fully developed finger are stopped by hydrodynamic capture.
3.2 Sensitivity analysis onRkandP e
T=2.0 E5 T=2.3 E6
T=6.3 E6 T=9.8 E7
Figure 3
a)
b)
c)
d)
2 1.8 1.6 1.4 1.2 1 0.8 0.6 0.4 0.2 0 2 1.8 1.6 1.4 1.2 1 0.8 0.6 0.4 0.2 0
1 0.8 0.6 0.4 0.2 0
1 0.8 0.6 0.4 0.2 0
0. 0.25 0.5 0.75 1.0
Dissolution
Fig. 3. Dissolution evolution for our reference case with infiniteDa,P e=300 and the permeability ratio between the fully dissolved and
the non dissolved media (Rk) equal to 1000. Time is in non-dimensional units. (a) and (b) correspond to the arrival of the first and second finger at the vertical boundary, c) corresponds to the capture by the second finger of a series of fingers developing up tox=1.4 and (d) to the connection of the second and third finger, the latter being afterwards drained to the vertical boundary.
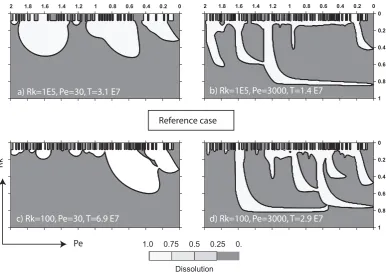
Smaller Peclet numbers (Fig. 4a and c) allow only the de-velopment of wide fingers. This results from diffusion, that smoothes the concentration of active species inside thin fin-gers to almost zero. The second finger of Fig. 4a andC de-velops slowly and is at least 200 m wide. Atx=0.7 the in-filtration velocity is only 0.5 and the resulting local Peclet number is reduced to 15, near the value of 5 under which no fingers are allowed to develop for the high permeability ra-tios of this study (Ortoleva, et al., 1987; Steefel and Lasaga, 1990). The local Peclet decreases in the upstream direction and reaches 5 atx=1.1. Figure 4a andCshow then that dis-solution produces large pockets around the widest initial ver-tical high permeability slots. Probably, these pockets could not develop without an initial high permeability zone able to focus the aggressive fluid flow. They could be compared to dolines that are common dissolution features of karstic land-scape (Ford and Williams, 1994).
The runs of Fig. 4a and b are characterized by the largest permeability contrast (Rk=105)and thus by enhanced hydro-dynamic capture of reactive fluid that prevents the simulta-neous development of neighbour fingers, an effect that has been previously noted by Ormond and Ortoleva (2000). This is best evidenced in Fig. 4b where the finger atx=0.95
devel-ops on almost half the cliff height before it is stopped by the progression of an horizontal channel that originates from the first finger.
Figure 4a shows that after the development of the first fin-ger, only large dissolution pockets grow around large initial permeability zones. They do not evolve as fingers even until 30% of the initial limestone is dissolved. We suspect how-ever that in real geological examples, due to superficial ero-sion and run-off, rainwater could be focused at the center of these pockets and that instable dissolution could set on as a result of the increased infiltration velocity and Peclet num-ber. Finally the case of Fig. 3d is characterized by the de-velopment of several dissolution fingers, as a consequence of the high Peclet number, that enhances instability, and of the low permeability contrast that limits the competition between fingers by hydrodynamic capture.
3.3 Effect of a finite dissolution rate
[image:6.595.99.497.67.340.2]c) Rk=100, Pe=30, T=6.9 E7
a) Rk=1E5, Pe=30, T=3.1 E7 b) Rk=1E5, Pe=3000, T=1.4 E7
d) Rk=100, Pe=3000, T=2.9 E7 Reference case
Pe
Rk
1 0.8 0.6 0.4 0.2 0 2 1.8 1.6 1.4 1.2 1 0.8 0.6 0.4 0.2 0
1 0.8 0.6 0.4 0.2 0 2 1.8 1.6 1.4 1.2 1 0.8 0.6 0.4 0.2 0
Figure 4
0. 0.25 0.5 0.75 1.0 [image:7.595.107.494.65.340.2]Dissolution
Fig. 4. Sensitivity study for theP eandRkparameters. RkandP evalues are bracketing those of the reference case. The final state, only,
where no additional finger is allowed to develop, is drawn. The permeability ratio between dissolved and non dissolved zones increases from bottom to top, and theP eincreases from left to right. The white rectangle labeled as “reference case” represents the final state of the reference case (Fig. 3d). As in Fig. 2, time is in non-dimensional units.
permeability is modeled with a Kozeni-Karman type (i.e.k proportional toφ3/(1–φ)2)law, up to a porosity of 0.6, and beyond that value tends asymptotically to 100. The accu-mulation term of Eq. (2) can still be neglected according to the results of Ogata (1964, 1970) and Lichtner (1988). The dissolution rate is given at each grid point by the term P e×Da C0.
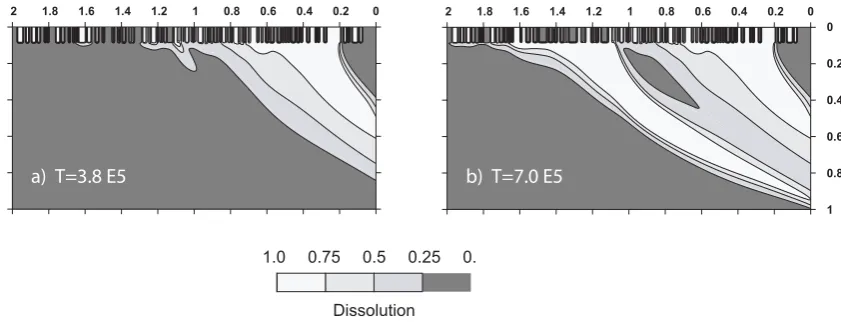
Figure 5a shows a diffuse dissolution zone of width close to 0.5 developing nearly along the initial flow lines and reaching the cliff near its mid-height. This can be viewed as a consequence of the reaction front width, that is between 0.1 and 0.5 due to the initial infiltration instability velocity of 1 to 5 in the area where the dissolution develops. Thus the reaction front will include a large part of the porous slice thickness. Our results are consistent with those of Golfier et al. (2002) for the style of instability and those of Ormond and Ortoleva (2000) who note that only fingers wider than the dis-solution front are allowed to grow. Moreover, due to the slow dissolution kinetics, a finger develops simultaneously on its whole length and therefore is driven in orientation by the ini-tial flow lines. We have noted that this effect was dependent on the porosity-permeability law and was more pronounced if a steep permeability change was introduced at the begin-ning of dissolution.
One notes also in Fig. 5a the onset of a second dissolution finger atx=1.05, sharper than the first one, due to the sharper dissolution front resulting from the decrease of the infiltra-tion velocity in the upstream direcinfiltra-tion. This finger develops also along the initial flow lines and reaches the base of the cliff att=7×10⁵(Fig. 5b).
Thus, a slow kinetics reaction tends to induce dissolution parallel to the initial flow lines and, as in the previous section, the instability style may change as a consequence of the de-creasing infiltration velocity and Damk¨ohler away from the cliff edge.
4 Discussion and conclusion
a) T=3.8 E5 b) T=7.0 E5
2 1.8 1.6 1.4 1.2 1 0.8 0.6 0.4 0.2 0 2 1.8 1.6 1.4 1.2 1 0.8 0.6 0.4 0.2 0
Figure 5
0. 0.25 0.5 0.75 1.0Dissolution
0
0.2
0.4
0.6
0.8
[image:8.595.87.508.65.227.2]1
Fig. 5. Dissolution with a finite dissolution rate, characterized byDa=10,P e=300, andRk=1000 (non-dimensional time units). Due to the
finite dissolution rate, there is smooth transition between the fully dissolved (in white) and the non-dissolved media. (a) and (b) correspond to the arrival of the first and second finger at the right free boundary.
are generally produced away from the jump, or fingers are replaced by large dissolution pockets. These effects are the consequence of the decrease of the infiltration velocity and of the resulting decrease of the Peclet number. They were hid-den in previous quantitative models of karst generation since dissolution was channeled in permeability heterogeneities in-troduced by the initial fracture set of these models.
Considering the approximations introduced in the equa-tions, our results have to be compared with great caution to real geological examples. A major assumption is to con-sider that the porous medium is saturated with water. Thus, the model assumes the infiltration of 10 myr−1of rainwater for a non-dimensional vertical velocity of 1, a value that can hardly be achieved, even in most rainy climates. Moreover, our models differ primarily from real karst by the amount of connected porosity, since one of our runs produces a con-nected network with a near 30% porosity, while a fully ma-ture karst could work with a 1% porosity (Mangin, 1995), including large caves and shafts poorly connected with the main drainage network. Further insight into the geometry of the fingering process might be gained by using 3-dimensional modelling, which is achievable with numerical method simi-lar to those of this study and up-to-date computers.
In the case of silicate rocks altered by dissolution and thus possibly subjected to the infiltration instability, two addi-tional effects should be considered. First, incomplete disso-lution will result in less permeable channels than in the karst case, which has been shown here to produce the simultaneous growth of numerous fingers. A second effect will arise from the slow dissolution kinetics that will produce a thick disso-lution front possibly including the entire formation thickness and prohibiting the development of the instability. However, a thinner dissolution front may result from the decrease of the fluid velocity in some areas of the infiltration basin, so that the infiltration instability could set on there, under the
con-dition that the Peclet number has not decreased below 5. In these formations, the infiltration instability is likely not to be detected, since it might govern the permeability distribution in some places only.
In summary, modeling infiltration instability could yield qualitative tools for better understanding the permeability distribution and its time-evolution inside a formation altered by dissolution. In the light of the present results we propose further modeling efforts accounting for dissolution inside the unsaturated zone, 3d aspects and variable density effects in evaporites.
Acknowledgements. This work has been partly funded by the
program PNRH of CNRS/INSU and benefited from fruitful discussions with M. Rabinowicz.
Edited by: J. Carrera
References
Bekri, S., Thovert, J. F., and Adler, P. M.: Dissolution of porous media, Chem. Eng. Sci., 50, 2765–2791, 1995.
Dreybrodt, W.: Principles of early development of karst conduits under natural and man-made condition revealed by mathemati-cal analysis of numerimathemati-cal models, Water Resour. Res., 32, 2923– 2935, 1996.
Daccord, G. and Lenormand, R.: Fractal patterns from chemical dissolution, Nature, 325, 41–43, 1987.
Ford, D. C. and Williams, P. W.: Karst geomorphology and hydrol-ogy, Chapman and Hall, London, 601 pp., 1994.
Fredd, C. N. and Fogler, H. S.: Influence of transport and reaction on wormhhole ormation in porous media, AIChE J., 44, 1933– 1949, 1998.
Gabrovsek, F. and Dreybrodt, W.: A model of the early evolution of karst aquifers in limestone in the dimensions of length and depth, J. Hydrol., 240, 206–224, 2001.
Gabrovsek, F., Romanov, D., and Dreybrodt, W.: Early karstifica-tion in a dual-fracture aquifer: the role of exchange of flow be-tween prominent fractures and a dense net of fissures, J. Hydrol., 299, 45–66, 2004.
Golfier, F., Zarcone, C., Bazin, B., Lenormand, R., Lasseux, D., and Quintard, M.: On the ability of Darcy-scale models to capture wormhole formation during the dissolution of a porous medium, J. Fluid Mech., 457, 213–254, 2002.
Hackbusch, W.: Multi-grid methods and applications, Springer Ver-lag, New York, 1985.
Hirt, C. W. and Nichols, B. D.: Volume of fluid (VOF) method for the dynamics of free boundaries, J. Comput. Phys., 39, 201–225, 1981.
Kaufmann, G.: Modelling unsaturated flow in an evolving karst aquifer, J. Hydrol., 276, 53–70, 2003.
Kaufmann, G. and Braun, J.: Karst aquifer evolution in fractured rocks, Water Resour. Res., 35, 3223–3228, 1999.
Kaufmann, G. and Braun, J.: Karst aquifer evolution in fractured, porous rocks, Water Resour. Res., 36, 1381–1391, 2000. Lichtner, P. C.: The quasi-stationnary state approximation to
cou-pled mass transport and fluid/rock reaction in a porous media, Geochim. Cosmochim. Acta, 52, 143–165, 1988.
Lowry, T. and Li, S.: A characteristic-based finite ana-lytic method for solving the two-dimensional steady state advection-diffusion equation, Water Ressour. Res., 38(7), 1123, doi:10.1029/2001WR000518, 2002.
Mangin, A.: Karst hydrogeology, in: Groundwater Ecology, edited by: Gilbert, J., Danielopol, D. L., Stanford, J., and Thorp, J. H., Academic Press, New York, 1995.
Ogata, A.: Mathematics of dispersion with linear absorbtion isotherm, US Geol. Surv. Prof. Paper, 411-H, 9 pp., 1964.
Ogata, A.: Therory of dispersion in granular medium, US Geol. Surv. Prof. Paper, 411-I, 34 pp., 1970.
Ortoleva, P. J., Chadam, J., Merino, E., and Sen, A.: Geochemical self-organization II, The reactive infiltration instability, Am. J. Sci., 287, 1008–1040, 1987.
Ormond, A. and Ortoleva, P. J.: Numerical modelling of reaction-induced cavities in porous rock, J. Geophys. Res., 105, 16 737– 16 747, 2000.
Palmer, A. N.: Origin and morphology of limestone caves, Geol. Soc. Am. Bull., 103, 1–21, 1991.
Quintard, M. and Whitaker, S.: Dissolution of an immobile phase during flow in porous media, Ind. Eng. Chem. Res., 38, 833–844, 1999.
Siemers, J. and Dreybordt, W.: Early development of karst aquifers on percolation networks of fractures in limestone, Water Resour. Res., 34, 409–419, 1998.
Steefel, C. I. and Lasaga, A. C: Evolution of dissolution pat-terns: permeability changes due to coupled flow and reaction, in: Chemical Modelling of Aqueous Systems II, edited by: Mel-chior, D. C. and Bassett, R. L., Am. Chem. Soc. Symp. Ser., 416, 212–225, 1990.
Steefel, C. I. and Lasaga, A. C.: Putting transport into water-rock interaction models, Geology, 20, 680–684, 1992.
Trescases, J. J.: L’evolution g´eochimique superg`ene des roches ul-trabasiques en zone tropicale: formation des gisements nicke-lif`eres de Nouvelle Cal´edonie, Mem. Orstom, 78, 259 pp., 1975. Willems, L., Pouclet, A., and Vicat, J. P.: Existence de karst en roches cristallines silicat´ees non carbonat´ees en Afrique Sah´elienne et ´equatoriale, implications hydrog´eologiques, Bull. Soc. Geol. Fr., 173, 337–345, 2002.