Hydrol. Earth Syst. Sci., 17, 453–460, 2013 www.hydrol-earth-syst-sci.net/17/453/2013/ doi:10.5194/hess-17-453-2013
© Author(s) 2013. CC Attribution 3.0 License.
EGU Journal Logos (RGB)
Advances in
Geosciences
Open Access
Natural Hazards
and Earth System
Sciences
Open AccessAnnales
Geophysicae
Open AccessNonlinear Processes
in Geophysics
Open AccessAtmospheric
Chemistry
and Physics
Open AccessAtmospheric
Chemistry
and Physics
Open Access DiscussionsAtmospheric
Measurement
Techniques
Open AccessAtmospheric
Measurement
Techniques
Open Access DiscussionsBiogeosciences
Open Access Open Access
Biogeosciences
Discussions
Climate
of the Past
Open Access Open Access
Climate
of the Past
Discussions
Earth System
Dynamics
Open Access Open Access
Earth System
Dynamics
DiscussionsGeoscientific
Instrumentation
Methods and
Data Systems
Open Access
Geoscientific
Instrumentation
Methods and
Data Systems
Open Access DiscussionsGeoscientific
Model Development
Open Access Open Access
Geoscientific
Model Development
DiscussionsHydrology and
Earth System
Sciences
Open AccessHydrology and
Earth System
Sciences
Open Access DiscussionsOcean Science
Open Access Open Access
Ocean Science
DiscussionsSolid Earth
Open Access Open Access
Solid Earth
Discussions
The Cryosphere
Open Access Open Access
The Cryosphere
Discussions
Natural Hazards
and Earth System
Sciences
Open Access
Discussions
A universal calibration function for determination of soil moisture
with cosmic-ray neutrons
T. E. Franz, M. Zreda, R. Rosolem, and T. P. A. Ferre
Department of Hydrology and Water Resources, University of Arizona, 1133 E James E Rogers Way, Room 122, Tucson, Arizona, 85721, USA
Correspondence to: T .E. Franz (tfranz@email.arizona.edu)
Received: 29 August 2012 – Published in Hydrol. Earth Syst. Sci. Discuss.: 11 September 2012 Revised: 7 January 2013 – Accepted: 11 January 2013 – Published: 1 February 2013
Abstract. A cosmic-ray soil moisture probe is usually
cali-brated locally using soil samples collected within its support volume. But such calibration may be difficult or impracti-cal, for example when soil contains stones, in presence of bedrock outcrops, in urban environments, or when the probe is used as a rover. Here we use the neutron transport code MCNPx with observed soil chemistries and pore water dis-tribution to derive a universal calibration function that can be used in such environments. Reasonable estimates of pore water content can be made from neutron intensity measure-ments and by using measuremeasure-ments of the other hydrogen pools (water vapor, soil lattice water, soil organic carbon, and biomass). Comparisons with independent soil moisture mea-surements at one cosmic-ray probe site and, separately, at 35 sites, show that the universal calibration function explains more than 79 % of the total variability within each dataset, permitting accurate isolation of the soil moisture signal from the measured neutron intensity signal. In addition the frame-work allows for any of the other hydrogen pools to be sep-arated from the neutron intensity measurements, which may be useful for estimating changes in biomass, biomass water, or exchangeable water in complex environments.
1 Introduction
Understanding the exchange of water between the land sur-face and atmosphere is critical for accurate initialization of general circulation models (Koster et al., 2004; Wang et al., 2006), understanding energy and water fluxes (Senevi-ratne et al., 2010), and thus making short-term weather pre-dictions. However, accurate and exhaustive soil moisture
datasets in space and time are difficult to obtain (Robin-son et al., 2008), hindering progress in fundamental under-standing of the land–atmosphere coupling (Jung et al., 2010; Seneviratne et al., 2010). The recently developed cosmic-ray soil moisture method (Zreda et al., 2008) and probe by Hydroinnova LLC, Albuquerque, NM, USA, allow for near surface soil moisture measurements (∼12 to 70 cm) at intermediate horizontal scales (∼35 ha) (Desilets et al., 2010). Fifty probes have been deployed around the continen-tal USA as part of the COsmic-ray Soil Moisture Observ-ing System (COSMOS) (Zreda et al., 2012; data available at http://cosmos.hwr.arizona.edu/), and other networks are be-ing installed elsewhere.
Previous work has concentrated on the relation between the neutron intensity in air above the land surface and soil moisture. However, that intensity is influenced not only by soil moisture, but also by hydrogen in other reservoirs. De-silets et al. (2010) presented a theoretical calibration func-tion that required at least one independent estimate of area-average soil moisture to define the free parameter,N0. Anal-ysis of 35 different COSMOS site calibration datasets indi-cates thatN0varies significantly from site to site and in time within the same site (Table S1) due to presence of other time-varying sources of hydrogen, such as fast-growing maize (Hornbuckle et al., 2012).
water is still exchanged between the land surface and at-mosphere at these sites, and observations of area-average moisture are necessary to understand the transfer of mass, momentum, and energy in these systems. Such observations may be possible with the aid of a universal calibration func-tion. In this work we aim to show that measurements of neu-tron intensity and other more easily measurable hydrogen pools (water vapor, soil lattice water, soil organic carbon, and above-ground biomass) are adequate to provide reason-able estimates of soil moisture through a universal calibration function.
Universal calibration functions and algorithms have been developed in the past, with some of them being transfor-mative in terrestrial hydrology. For example, Knyazikhin et al. (1998) utilized a radiative transfer model in six differ-ent vegetation classes to derive a global leaf area index and fraction of absorbed photosynthetically active radiation from satellite-derived spectroradiometer measurements. Topp et al. (1980) found a single relationship between the measured dielectric constant and volumetric water content across a wide range of soil types using coaxial transmission lines.
In this work, we develop a universal calibration function for the cosmic-ray neutron probe. It accounts for several sources of time-varying hydrogen signals that may be present in the probe’s support volume in order to expand the po-tential use of the probe to hitherto difficult sites and novel applications. We first develop the function using the neu-tron transport code MCNPx (Pelowitz, 2005), for two dif-ferent cases: uniform variations of pore water in 50 differ-ent soil chemistries, and vertical variations in pore water in four different soil textures using a numerical solution to the 1-D Richards equation. We then test the validity of the func-tion by using observed neutron data from 35 COSMOS sites (where we have full calibration datasets) with a wide range of conditions.
2 Methods
2.1 Relationship between low-energy neutron intensity and hydrogen
The intensity of low-energy neutrons in air above the land surface is controlled mainly by the number of atoms of hy-drogen in the combined soil–air system (Zreda et al., 2008). Hydrogen at the surface is present in three forms: static (soil mineral structure, mostly constant in time), quasi-static (veg-etation and soil organic carbon, possibly varying in time) and transient (water vapor, pore or ponded water, snow, all chang-ing in time). The support volume of a cosmic-ray probe is governed by the average travel distance of neutrons in air near the land surface (Desilets et al., 2010). Because of the additional sources of hydrogen, it is difficult to isolate a sin-gle transient signal (here, soil moisture) from the convoluted
detected signal (here, neutron intensity) without additional information, constraints or simplifications.
The influence of additional sources of hydrogen is evident from the wide range ofN0values computed for COSMOS sites using the Desilets et al. (2010) calibration function:
θ (N )= 0.0808
N N0
−0.372
−0.115 (1)
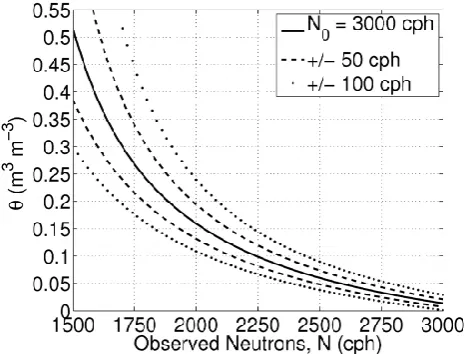
where θ is the volumetric pore water content (m3m−3),
N is the neutron counting rate/flux normalized to a refer-ence atmospheric pressure and solar activity level and N0 is the counting rate/flux over dry soil under the same refer-ence conditions. Figure 1 illustrates an example of Eq. (1) for one value of N0 and includes uncertainty bounds for two count rate uncertainties of 50 and 100 counts per hour, cph. We note that the uncertainty in the pore water con-tent grows with increasing water concon-tent given the non-linearity in Eq. (1). Using 45 calibration datasets from 35 different COSMOS sites, we find N0 varies signifi-cantly (mean = 2632 cph, st.dev. = 433 cph, min = 1892 cph, max = 3394 cph; Table S1). This parameter should be approx-imately constant when accounting for all hydrogen sources; therefore the large spread indicates that not all sources of hy-drogen are taken into account.
2.2 A practical framework
Given the deficiency of Eq. (1) to account for additional or time-varying hydrogen signals, we present a simplified but general framework to account for all hydrogen sources present. We assume that a monotonic relationship exists be-tween observed neutrons and the amount of hydrogen present in the support volume. In order to isolate the different tran-sient signals, we employ neutron intensity correction fac-tors and assign average properties within the support volume. From neutron transport simulations, Zreda et al. (2008) found that 86 % of the neutron signal occurs within a 335-m radius and is nearly independent of soil moisture. They also found that the vertical extent of the neutron signal depends on soil moisture, ranging from 12 cm in wet soils (0.40 m3m−3)to 70 cm in dry ones (0 m3m−3).
In the air, the support volume is approximately a hemi-sphere with a radius of 335 m. The neutron signal is normal-ized to the same reference pressure, geomagnetic latitude, and the incident high-energy neutron intensity as summa-rized in Zreda et al. (2012) and implemented in the COS-MOS project (Level 2 data available at http://cosmos.hwr. arizona.edu/). In addition, the neutron signal is corrected for variations in atmospheric water vapor (Franz et al., 2012b; Rosolem et al., 2013):
Fig. 1. Example relationship and uncertainty bounds between ob-served neutron counts and pore water content using Eq. (1) and a typicalN0value of 3000 cph.
water vapor (N·CWV),ρv0(g m−3)is the absolute humid-ity at the surface, andρvref(g m−3)is the absolute humidity at the surface at a reference condition (here we use dry air,
ρvref=0). Estimates of absolute humidity can be made with surface measurements of air temperature, air pressure, and relative humidity following Rosolem et al. (2013) (see Ta-ble S1). We note that the support radius is a weak function of water vapor and that it may be reduced by∼10 % for fully saturated air as compared to dry air (Rosolem et al., 2013). Here we correct the neutron intensity to dry air conditions and do not consider the small changes in the support radius.
In the subsurface, the support volume is a cylinder with a fixed radius of 335 m and a depth that varies with pore wa-ter content. In order to calculate the measurement depth and depth-weighted average of properties within the volume, we modified the framework outlined in Franz et al. (2012a). For uniform distributions of pore water, lattice water, soil organic carbon, and bulk density, Franz et al. (2012a) found the ef-fective depthz∗(cm) as
z∗= ρ 5.8
bd
ρw(τ+SOC)+θ+0.0829
(3)
where 5.8 (cm) represents the 86 % cumulative sensitivity depth of low-energy neutrons in liquid water, 0.0829 is con-trolled by the nuclear cross sections of SiO2,ρbd is the dry bulk density of soil (g cm−3), ρw is the density of liquid water assumed to be 1 (g cm−3), τ is the weight fraction of lattice water in the mineral grains and bound water, de-fined as the amount of water released at 1000◦C preceded by drying at 105◦C (g of water per g of dry minerals, also known as lattice water), and SOC is the soil organic car-bon (g of water per g of dry minerals, estimated from stoi-chiometry using measurements of total soil carbon and CO2, SOC = TC−12
44CO2). For this work, measurements of lattice
water, total soil carbon, and CO2measurements were made on a∼100 g composite sample collected at the study site and analyzed at Actlabs Inc. of Ontario, Canada. The 100 g com-posite sample was made by collecting∼1 g of soil from 108 individual samples at 18 locations with the footprint (sam-ples collected at 6 depths, 0–5, 5–10, 10–15, 15–20, 20–25, 25–30 cm, and 18 horizontal locations, bearings of 0◦, 60◦, 120◦, 180◦, 240◦, 300◦, and radii of 25, 75, and 200 m). As a slight modification to the original equation (Franz et al., 2012a), we have added the effects of soil organic carbon (Ta-ble S1) on the effective depth of the sensor by treating it sim-ilarly to lattice water following Zreda et al. (2012), as it may contain a significant amount of hydrogen molecules. Given the complexity of soil organic carbon molecules, here we as-sume that the weight percent of organic carbon is the same as lattice water based on the stoichiometry of lignin (C9H10O2) and equivalent amount of hydrogen. We note that the effects of SOC and lattice water on the effective depth will be most pronounced for low soil water contents.
With the estimates of sensor support volume and average properties within that volume, the total mass in the system and the total number of moles of each element can be cal-culated (Table S1). Following the neutron correction factor for variations in atmospheric water vapor Eq. (2), we as-sume the atmosphere is composed of only nitrogen (79 % by weight) and oxygen (21 % by weight). We estimate wet above-ground biomass, AGB (kg m−2), from US Forest Ser-vice maps in the continental USA (http://webmap.ornl.gov/ biomass/biomass.html) and assume vegetation is only com-posed of water (60 % by weight) and cellulose (C6H10O5, 40 % by weight). We assume the subsurface is composed of solid grains (pure quartz, SiO2, plus lattice water and SOC lattice water equivalent) and pore water. With the estimates of volume, mass, and chemical composition, hydrogen molar fraction, hmf (mol mol−1), is
hmf= P
Hi P
Ai
= Hτ+HSOC+Hθ+HAGB
NO+SiO2+H2Oτ+H2OSOC+H2Oθ+C6H10O5+H2OAGB(4) whereHi is the sum of hydrogen moles from lattice water Hτ, soil organic carbon lattice water equivalentHSOC, pore waterHθ, and vegetationHAGBinside the support volume, andAi is the sum of all moles from air NO, soil SiO2, lat-tice water H2Oτ, soil organic carbon lattice water equiva-lent H2OSOC, pore water H2Oθ, and above-ground biomass C6H10O5+H2OAGB inside the support volume. Table S1 presents a summary of all calculations from the 45 calibra-tion datasets at 35 different COSMOS locacalibra-tions (some loca-tions have more than one calibration dataset).
2.3 Modeled neutron intensity for variations in soil mineral chemistry
model (Pelowitz, 2005), a general purpose Monte Carlo code that tracks the individual life history of a particle and sub-sequent particles as it interacts with matter. At 1 to 2 m above the surface, the fast neutron flux,N(energy range 10– 100 eV), is tallied; it corresponds to approximately the same energy neutrons that are measured by the cosmic-ray neu-tron detector moderated or “fast” channel (Desilets, 2011). Desilets (2011) notes that the moderated channel measures a range of neutron energies with the median value near 10 eV, where detection frequencies drop off as 1/e for higher-energy neutrons. We note that MCNPx simulations of neutron flux of each binned energy level between 1 and 105eV indicate nearly identical response functions to soil moisture changes, thus justifying the use of the energy range used here. The neutron transport simulations used soil mineral chemistries from 50 different soil types, 49 COSMOS sites mostly across the continental USA ranging from sand to clays, and the hy-pothetical case of SiO2(Table S2). Using these soils we sim-ulated 12 different uniformly distributed pore water contents (Fig. 2). Despite large variations in soil chemistry and soil texture, the framework presented in Sect. 2.2 explained 99 % of the variation (Table 1) between relative neutron flux and hydrogen molar fraction within the sensor support volume using a two-term exponential function:
N Ns
=4.486 exp(−48.1·hmf)+4.195 exp(−6.181·hmf). (5) As opposed to dry soil, which was used in previous work (Desilets et al., 2010), neutron flux is normalized to the case of an infinitely deep layer of water beneath the sensor (i.e., no soil) because of site to site differences in lattice water and soil organic carbon. The modeled neutron intensity over SiO2is 8.5 times higher than that over water, which is similar to the theoretical value reported in Fig. 1 of (Hendrick and Edge, 1966). To compare modeled neutron fluxes to observed neu-tron counts, the parameterNs, which represents the cosmic-ray neutron count rate normalized to that over water, must be specified. This parameter may be sensor dependent, but can be easily specified by measurements over a large water body (>∼500 m on all sides and deeper than 1 m) and by follow-ing the standard correction factors summarized in Zreda et al. (2012).
[image:4.595.312.544.66.304.2]Most notably, the results in Fig. 2 illustrate that all 49 ob-served soil chemistries collapse to the SiO2case when using hmf, where we can account for the hydrogen in the lattice water and soil organic carbon. This result justifies the use of Eq. (4) and its simple representation of soil chemistry con-sisting of only SiO2, lattice water, and organic carbon. With respect to future work using stationary or mobile cosmic-ray neutron probes, we recommend site-specific estimates of lat-tice water and soil organic carbon for most accurate results.
Fig. 2. MCNPx modeled relative neutron flux versus (a) 12 uni-formly distributed pore water content profiles (0, 0.02, 0.05, 0.10, 0.15, 0.20, 0.25, 0.30, 0.35, 0.40, 0.45, 0.50 m3m−3)and (b) com-puted hydrogen molar fraction in the support volume of cosmic-ray neutron probe for 50 different soil mineral chemistries at COSMOS sites (Table S2). The horizontal axis in (b) is the ratio of the sum of all hydrogen moles that are present in the support volume (vege-tation, pore water, soil mineral water, and soil organic carbon) and the sum of all moles from all elements that are present in air, vege-tation, soil, and pore water. Note the combined modeled chemistry and pore water profile cases were used for the best curve fitting analysis (see Table 1 for individual data fits).
2.4 Modeled neutron intensity for variations in pore water
Table 1. Summary of coefficients and fitting statistics for modeled and observed cases.
RMSE
Case (cph) R2 aa ba ca da Nsa
Poisson Counting 12.9 to NA NA NA NA NA NA Uncertainty for 6 h 20.4
average period (1000 to 2500 cph)
Modeled Variable 63.9b 0.995 4.264 −49.4 4.382 −6.401 NA Chemistry
Modeled Variable 75.1b 0.965 4.114 −49.4 4.228 −6.401 NA Pore Water Profiles,
all
Modeled Variable 107.0b 0.855 4.091 −49.4 4.204 −6.401 NA Pore Water Profiles,
sand
Modeled Variable 78.4b 0.831 4.184 −49.4 4.300 −6.401 NA Pore Water Profiles,
sandy loam
Modeled Variable 39.3b 0.783 4.107 −49.4 4.221 −6.401 NA Pore Water Profiles,
silt
Modeled Variable 39.8b 0.447 4.058 −49.4 4.171 −6.401 NA Pore Water Profiles,
silty clay loam
Modeled Chemistry 83.8b 0.989 4.486 −48.1 4.195 −6.181 NA and Pore Water
Profilesc
Observed, Santa 110.1 0.854 4.486 −48.1 4.195 −6.181 1037.0 Rita Experimental
Range
Observed, 45 199 0.791 4.486 −48.1 4.195 −6.181 1019.0 Calibration
Datasets
aCoefficients for the Eq. (5),N/N
s=a·exp(b·hmf)+c·exp(d·hmf).bAssuming
Ns=1000cph to convert between counts count−1to cph.cCoefficients used in all figures and observed fitting.
used to estimate the equivalent uncertainty in terms of pore water content for different count rates and uncertainties.
2.5 Neutron intensity observations at Santa Rita experimental range
To further validate the universal calibration function, we compare observed neutron data with estimates of hydro-gen molar fraction for five different volumetric calibration datasets (Table S1, COSMOS site number 11) and for con-tinuous measurements from a distributed sensor network in Southern Arizona over a six-month period (details of the distributed sensor network observations are presented in Franz et al., 2012b). Continuous measurements were taken at depths of 10, 20, 30, 50, and 70 cm, in the same spa-tial pattern as the volumetric calibration samples. Using the five volumetric sample data points, we estimate anNs value of 1037 cph using Eq. (5). Then, using the indepen-dently distributed sensor network measurements, we com-pute an RMSE of 110.1 cph and R2 of 0.854 (Fig. 4, Ta-ble 1). However, we note that there is a slight bias at the wet end for the independent distributed sensor network mea-surements. Because the shallowest soil moisture sensor was placed at 10 cm, the dynamics in the top 5 cm are likely not well captured, leading to a bias when shallow wetting fronts exist shortly after precipitation (Franz et al., 2012b).
[image:5.595.48.287.91.361.2]Fig. 3. MCNPx modeled neutron flux versus hydrogen molar frac-tion for four different soil textures undergoing one wetting and dry-ing cycle. Each soil moisture profile was generated usdry-ing a nu-merical solution to the 1-D Richards equation for a top boundary condition of a 2.54 cm rain event that lasted 24 h followed by a 2 mm day−1potential evapotranspiration for 9 days, a free drainage lower boundary condition, initial condition set to field capacity, and a vertical resolution of 2 cm. Note the combined modeled chemistry and pore water profile cases were used for the best curve fitting anal-ysis (see Table 1 for individual data fits).
Fig. 4. Observed neutron counts and computed hydrogen molar fractions from five sets of multiple soil samples collected for cal-ibration purposes at five different times, and continuous measure-ments from a network of time-domain transmission sensors (TDT, Acclima Inc. Meridian, ID, USA) from 1 July 2011 to 5 Jan-uary 2012, at Santa Rita Experimental Range in Southern Arizona (31.9085◦N, 110.8394◦W). See Table S1 for calibration datasets.
[image:5.595.311.541.371.548.2]Fig. 5. Observed neutron counts versus (a) hydrogen molar fraction and (b) total soil water from 45 calibration datasets at 35 different cosmic-ray neutron probes. See Table S1 for calibration datasets. Note the 95 % confidence intervals are shown by the dotted line; data inside the dotted line red ellipse show dry sites with large amounts of above-ground biomass (site numbers 43, 51, 52, 53, see Table S1), and data inside the solid line blue ellipse show sites with hydrogen molar fraction values above 0.23 (site numbers 30, 31, 35).
2.6 Neutron intensity observations at multiple sites
The analysis of 45 calibration datasets from 35 different cosmic-ray neutron probe locations shows that Eq. (5) rea-sonably describes the data with an RMSE of 199 cph andR2
of 0.791 (Fig. 5a), over a wide range of soil moisture, soil bulk density, soil texture classes, lattice water, soil organic carbon, vegetation, and water vapor conditions. As a direct comparison with Eq. (1), we find the best fit between total soil water θ+ρbd
ρw (τ+SOC)
and the observed neutrons counts leads to an RMSE of 310.2 cph and aR2 of 0.493 (Fig. 5b). By including the differences in AGB between sites, Eq. (5) reduces RMSE from 310.2 to 199 cph and increases
R2from 0.493 to 0.791.
Looking at the residuals between Eq. (5) and observed val-ues, we find two sets of data that account for a large portion of the remaining uncertainty. The first subset (data inside solid line blue ellipse) comprises three sites where the ob-served hydrogen molar fraction is greater than the liquid wa-ter case at∼0.23, as the sites have a large amount of above-ground biomass and were relatively wet on the day of the
Fig. 6. Contours of predicted neutron counts (cph) using Eqs. (3)– (5), bulk density = 1.4 g cm−3, andNs=1000 cph for (a) and (b) a range of pore and lattice water values and two different above-ground biomass cases and for (c) and (d) a range pore water and above-ground biomass values for two different lattice water cases.
calibration. Above this value of 0.23, the count rate becomes flat, as the neutron probe is no longer sensitive to hydrogen being gained or lost to the system. The second subset of data (data inside dotted line red ellipse) is from four sites where large forests grow in dry sandy soils supported by shallow water tables (southeastern USA and northern Michigan); it will be discussed in the next section.
3 Remaining uncertainties
[image:6.595.310.545.64.244.2]observational and theoretical work should aim to understand the effect on neutron intensity of biomass above and below ground surface. In terms of calibration datasets, accurate spa-tial estimates of volumetric water content may be difficult to obtain because of a large uncertainty in the determination of soil bulk density (Table S1) (Dane and Topp, 2002). Addi-tional experimental work on accurate determinations of bulk density at intermediate spatial scales, and better quantifica-tion of above- and below-ground biomass and soil organic matter will help reduce the overall uncertainty in the cosmic-ray moisture measurements.
4 Outlook
With the presented framework, reasonably accurate estimates of soil moisture at difficult sampling sites or many points when using mobile surveys are now possible using cosmic-ray neutron probes. The proposed method requires ancillary data on location (for the computation of the incident cosmic-ray intensity), surface pressure, air temperature, and relative humidity to perform the necessary neutron intensity correc-tions. In addition, estimates of soil bulk density and total biomass are needed, but spatially contiguous data are readily available from various sources. The most challenging aspect is a spatial map of lattice water and soil organic carbon. Here we provide data from 50 sites (Table S1), but additional mea-surements along the mobile survey need to be made, or, alter-natively, relationships between bulk density and more readily available properties (Greacen, 1981) need to be established.
In addition to computing pore water from the neutron in-tensity measurements, it is possible to isolate any one of the hydrogen signals, given measurements of the other pools (Fig. 6). Figure 6 illustrates the expected neutron count rates solving Eqs. (3)–(5) for different combinations of pore wa-ter, lattice wawa-ter, and above-ground biomass. This method and framework has potential applications to mapping total biomass or changes in biomass, which could be used as vali-dation datasets for remote-sensing products (Lu et al., 2012; Weiss et al., 2007) or to help understand carbon cycle dynam-ics. Furthermore, it may be possible to isolate the fraction of the total neutron signal that corresponds to an exchange of water from the surface to the atmosphere. It is the exchange of all water from the surface that will influence the transfer of mass, momentum, and energy, and this total exchangeable water is the critical climatic variable in interactions between land surface and the atmosphere and in ecosystem processes.
Supplementary material related to this article is
available online at: http://www.hydrol-earth-syst-sci.net/ 17/453/2013/hess-17-453-2013-supplement.zip.
Acknowledgements. This research and the COSMOS project were supported by the US National Science Foundation under grant AGS-0838491. We would also like to thank COSMOS site collaborators, Darin Desilets, Gary Womack, and Santa Rita Experimental Range for their support. In addition we would like to thank Heye Bogena for his helpful comments.
Edited by: N. Romano
References
Dane, J. H. and Topp, C. G.: Methods of Soil Analysis: Part 4 Phys-ical Methods, Soil Science Society of America, Madison, WI, 2002.
Desilets, D.: Sandia Report: SAND2011-1101, Radius of influence for a cosmic-ray soil moisture probe: Theory and Monte Carlo simulations, Sandia National Laboratories, Albuquerque, New Mexico 87185 and Livermore, California 94550, 2011.
Desilets, D., Zreda, M., and Ferre, T. P. A.: Nature’s neutron probe: Land surface hydrology at an elusive scale with cosmic rays, Water Resour. Res., 46, W11505, doi:10.1029/2009wr008726, 2010.
Franz, T. E., Zreda, M., Ferre, P. A., Rosolem, R., Zweck, C., Stillman, S., Zeng, X., and Shuttleworth, W. J.: Measurement depth of the cosmic-ray soil moisture probe affected by hy-drogen from various sources, Water Resour. Res., 48, W08515, doi:10.1029/2012WR011871, 2012a.
Franz, T. E., Zreda, M., Rosolem, R., and Ferre, P. A.: Field valida-tion of cosmic-ray soil moisture sensor using a distributed sensor network, Vadose Zone J., 11, doi:10.2136/vzj2012.0046, 2012b. Greacen, E. L.: Soil Water Assessment by the Neutron Method,
CSIRO, Melbourne, 1981.
Hendrick, L. D. and Edge, R. D.: Cosmic-ray Neutrons Near Earth, Phys. Rev., 145, 1023–1025, doi:10.1103/PhysRev.145.1023, 1966.
Hornbuckle, B., Irvin, S., Franz, T. E., Rosolem, R., and Zweck, C.: The potential of the COSMOS network to be a source of new soil moisture information for SMOS and SMAP, paper presented at Proc. IEEE Intl. Geosci. Remote Sens. Symp., Munich, Ger-many, 2012.
Jung, M., Reichstein, M., Ciais, P., Seneviratne, S. I., Sheffield, J., Goulden, M. L., Bonan, G., Cescatti, A., Chen, J. Q., de Jeu, R., Dolman, A. J., Eugster, W., Gerten, D., Gianelle, D., Gobron, N., Heinke, J., Kimball, J., Law, B. E., Mon-tagnani, L., Mu, Q. Z., Mueller, B., Oleson, K., Papale, D., Richardson, A. D., Roupsard, O., Running, S., Tomelleri, E., Viovy, N., Weber, U., Williams, C., Wood, E., Zaehle, S., and Zhang, K.: Recent decline in the global land evapotranspira-tion trend due to limited moisture supply, Nature, 467, 951–954, doi:10.1038/nature09396, 2010.
Verseghy, D., Vasic, R., Xue, Y. K., Yamada, T., and Team, G.: Regions of strong coupling between soil moisture and precipi-tation, Science, 305, 1138–1140, doi:10.1126/science.1100217, 2004.
Lu, D., Chen, Q., Wang, G., Moran, E., Batistella, M., Zhang, M., Laurin, G. V., and Saah, D.: Aboveground Forest Biomass Esti-mation with Landsat and LiDAR Data and Uncertainty Analy-sis of the Estimates, International Journal of Forestry Research, 2012, 436537, doi:10.1155/2012/436537, 2012.
Pelowitz, D. B. (Ed.): MCNPX user’s manual, version 5, Rep. LA-CP-05-0369, Los Alamos National Laboratory, Los Alamos, 2005.
Rivera Villarreyes, C. A., Baroni, G., and Oswald, S. E.: Integral quantification of seasonal soil moisture changes in farmland by cosmic-ray neutrons, Hydrol. Earth Syst. Sci., 15, 3843–3859, doi:10.5194/hess-15-3843-2011, 2011.
Robinson, D. A., Binley, A., Crook, N., Day-Lewis, F. D., Ferre, T. P. A., Grauch, V. J. S., Knight, R., Knoll, M., Lakshmi, V., Miller, R., Nyquist, J., Pellerin, L., Singha, K., and Slater, L.: Advancing process-based watershed hydrological research using near-surface geophysics: a vision for, and review of, electrical and magnetic geophysical methods, Hydrol. Process., 22, 3604– 3635, 2008.
Rosolem, R., Shuttleworth, W. J., Zreda, M., Franz, T. E., and Zeng, X.: The Effect of Atmospheric Water Vapor on the Cosmic-ray Soil Moisture Signal, J. Hydrometeorol., in review, 2013.
Seneviratne, S. I., Corti, T., Davin, E. L., Hirschi, M., Jaeger, E. B., Lehner, I., Orlowsky, B., and Teuling, A. J.: Investigating soil moisture-climate interactions in a changing climate: A review, Earth-Sci. Rev., 99, 125–161, doi:10.1016/j.earscirev.2010.02.004, 2010.
Topp, G. C., Davis, J. L., and Annan, A. P.: Electromagnetic De-termination of Soil-Water Content – Measurements in Coaxial Transmission-Lines, Water Resour. Res., 16, 574–582, 1980. Wang, A. H., Zeng, X. B., Shen, S. S. P., Zeng, Q. C., and
Dickin-son, R. E.: Time scales of land surface hydrology, J. Hydromete-orol., 7, 868–879. doi:10.1175/jhm527.1, 2006.
Weiss, M., Baret, F., Garrigues, S., and Lacaze, R.: LAI and fAPAR CYCLOPES global products derived from VEGETA-TION. Part 2: validation and comparison with MODIS col-lection 4 products, Remote Sens. Environ., 110, 317–331, doi:10.1016/j.rse.2007.03.001, 2007.
Zreda, M., Desilets, D., Ferre, T. P. A., and Scott, R. L.: Measuring soil moisture content non-invasively at intermediate spatial scale using cosmic-ray neutrons, Geophys. Res. Lett., 35, L21402, doi:10.1029/2008gl035655, 2008.