Georgia State University
ScholarWorks @ Georgia State University
Public Health Theses School of Public Health
8-11-2015
Pathway Group Lasso for Integrating
Metabolomics and Transcriptomics
Sophia BantonFollow this and additional works at:https://scholarworks.gsu.edu/iph_theses
This Thesis is brought to you for free and open access by the School of Public Health at ScholarWorks @ Georgia State University. It has been accepted for inclusion in Public Health Theses by an authorized administrator of ScholarWorks @ Georgia State University. For more information, please contact [email protected].
Recommended Citation
1
ABSTRACT
PATHWAY GROUP LASSO FOR INTEGRATING METABOLOMICS AND TRANSCRIPTOMICS
by
SOPHIA A. BANTON
JUNE 17, 2015
INTRODUCTION: Transcriptomics and metabolomics are high-throughput technologies that are critical to contemporary biomedical sciences, measuring gene expression levels and metabolite concentrations, respectively. Effective methods of integrating metabolomics and
transcriptomics data are highly desired. Gene and metabolic pathways represent accumulated expert knowledge in particular domains. LASSO regression is widely used for feature selection, and group LASSO incorporates prior knowledge of groups of variables.
AIM: To address the current need to integrate the two data types, a novel approach in the framework of group LASSO was developed and tested using a set of metabolomics and transcriptomics data on malaria intermittent preventative treatment with pyrimethamine in Rhesus macaques (Macaca mulatta).
METHODS: Groups are predefined using biological pathways and variables in groups will be standardized separately. The leading principal components were obtained for each pathway for each of the two data types, and then combined into an integrated matrix, which together with the group information served as input for a group LASSO regression model.
RESULTS: We identified multiple pathways that were top contributors to the differences due to pyrimethamine exposure in the macaques and jointly predicted the association of member genes and metabolites to plasma hemoglobin levels.
DISCUSSION: By applying this integration approach via group LASSO, we identified multiple pathways that are top contributors to the differences due to pyrimethamine exposure in the macaques and jointly predicted the association of member genes and metabolites to plasma hemoglobin levels. Our findings are consistent with current literature, and provide high-quality mechanistic hypotheses. Pathway group LASSO is thus a novel and effective method of
2
PATHWAY GROUP LASSO FOR INTEGRATING METABOLOMICS AND TRANSCRIPTOMICS
by
SOPHIA A. BANTON
B.S., GEORGIA STATE UNIVERSITY M.S., GEORGIA STATE UNIVERSITY
A Thesis Submitted to the Graduate Faculty of Georgia State University in Partial Fulfillment
of the
Requirements for the Degree
MASTER OF PUBLIC HEALTH
3
APPROVAL PAGE
PATHWAY GROUP LASSO FOR INTEGRATING METABOLOMICS AND TRANSCRIPTOMICS
by
SOPHIA A. BANTON
Approved:
___Ruiyan Luo, Ph.D.______ Committee Chair
__Shuzaho Li, Ph.D._____ Committee Member
__June 17, 2015_____________
4
Acknowledgments
5
Author’s Statement Page
In presenting this thesis as a partial fulfillment of the requirements for an advanced degree from Georgia State University, I agree that the Library of the University shall make it available for inspection and circulation in accordance with its regulations governing materials of this type. I agree that permission to quote from, to copy from, or to publish this thesis may be granted by the author or, in his/her absence, by the professor under whose direction it was written, or in his/her absence, by the Associate Dean, School of Public Health. Such quoting, copying, or publishing must be solely for scholarly purposes and will not involve potential financial gain. It is understood that any copying from or publication of this dissertation which involves potential financial gain will not be allowed without written permission of the author.
___Sophia A. Banton_____________
6
TABLE OF CONTENTS
ACKNOWLEDGMENTS ...iv
LIST OF TABLES………....vii
LIST OF FIGURES……….…...viii
INTRODUCTION...9
Materials and Methods ………...11
RESULTS...14
DISCUSSION AND CONCLUSION... 16
7
List of Tables
Table 1 Pathways selected by group pathway LASSO for association with plasma
8
List of Figures
Figure 1 Features in the Rhesus macaques that are significantly correlated with
hemoglobin levels at time points (TP) 3 – 7………....……….21
Figure 2 Genes and metabolites in the macaques that were differentially expressed across
experimental time points (TP) due to drug exposure …..……….22
Figure 3 Correlation of Principal Components of differentially expressed genes and
metabolites before pathway assignment ……….……….………...23
Figure 4 The most significant gene and metabolite from the porphyrin metabolism
pathway that was selected by Group Pathway LASSO .………..……….24
Figure 5 Significant genes and metabolites from the porphyrin metabolism pathway that
were selected by Group Pathway Lasso ……….………..……….25
Figure 6 Plot of principal component analysis (PCA) of metabolites that are differentially
expressed in macaques between and after treatment with pyrimethamine ………26
Figure 7 Plot of principal component analysis (PCA) of genes that are differentially
expressed in macaques before, between, and after treatment with
9
Introduction:
Globally, malaria continues to be a major public health concern accounting for three to
five hundred million infections and twenty-percent of all childhood deaths annually1.
Historically, anti-malarial pharmaceutical usage has been largely centered on methods of
chemoprophylaxis with chloroquine. However, chloroquine resistance in malaria parasites and
poor adherence among drug recipients led to poor effectiveness. To overcome this hurdle,
intermittent preventative treatment (IPT) was introduced in the early part of the twenty-first
century to replace chemoprophylaxis. Recommendations for its use by the World Health
Organization (WHO)2, 3 and the single dose advantage of IPT with pyrimethamine have led to its
use as the primary form of IPT in regions in which malaria is endemic4.
The Malaria Host-Pathogen Interaction Center5 has developed the malaria IPT model in
Rhesus macaques, and generated detailed data using transcriptomics and metabolomics.
Transcriptomics is an established scientific methodology that examines the global expression
level of mRNAs using either DNA microarrays or massively parallel sequencing. Metabolomics
is an emerging field, where high performance mass spectrometry is used to profile small
molecules (metabolites) in biological samples. Statistical analyses of the data produced by both
methods typically lead to the identification of genes and metabolites that are associated with the
outcome or exposure of interest. Gene and metabolic pathways represent accumulated expert
knowledge in particular domains, pivotal to the interpretation of these data. The integration of
transcriptomics and metabolomics at pathway level is thus highly desired in many research
projects. Thus, we sought to identify key features across both the transcriptome and metabolome
that can be used to predict host response to pyrimethamine and specifically its impact on plasma
10
Within the framework of this study, data integration is taken to mean the process by
which multiple types of omic data are combined as predictor variables in statistical models to
allow more systematic and complete modelling of multifactorial traits or phenotypes. The
reasoning behind such a definition is the supposition that these non-Mendelian traits reflect an
intricate interplay in biological system variation at multiple levels of regulation 6. Thus, the
ability to identify significant host factors and their connections that explain or predict biological
predisposition to disease or clinical outcome is the primary motivation of omic integration 6.
Here, we report a novel approach of omic data integration in a framework of group
LASSO (least absolute shrinkage and selection operator) regression, and demonstrate its
application using a set of metabolomics and transcriptomics data on malaria intermittent
preventative treatment with pyrimethamine in Rhesus macaques (Macaca mulatta). LASSO
regression is widely used for feature selection, and group LASSO incorporates prior knowledge
of group information. Groups were predefined using biological pathways and standardized
separately. Using this technique, we demonstrate that the significant biological pathways
detected by a metabolomics and transcriptomics study can be successfully integrated to identify
key genes and metabolites that regulate hemoglobin plasma levels following pyrimethamine
exposure.
Materials and Methods:
Animals
Five rhesus macaques (Macaca mulatta; age, 2 y.), all males, from the Yerkes National
Primate Center were selected for study and each primate was exposed to all treatment conditions
in a crossover experimental design. The primates were housed at the Yerkes National Primate
11
Use Committee (IACUC). The study design and the husbandry of the animals have been
described elsewhere7. Briefly four monkeys were housed in pairs and a fifth monkey was housed
alone. These monkeys were followed over a 100 day time course; during which samples for
clinical and omic measurements were collected daily.
Study design was to collect samples 1) baseline upon entry into the study, 2) baseline
after 20 days, 3) after primary pyrimethamine exposure on day 27, 4) after primary
pyrimethamine injection and before secondary pyrimethamine injection on day 52, 5) after
secondary pyrimethamine exposure on days 59, 6) after secondary pyrimethamine injection and
before tertiary pyrimethamine injection on day 90, and 7) after tertiary pyrimethamine injection
on day 98. Pyrimethamine (1 mg/kg) was delivered intramuscularly once on day 20 and for
three successive days beginning at days 52 and 90. This constitutes two pre-drug time points
(TP1 and TP2), two inter-drug time points (TP4 and TP6), and three post-drug time points (TP3,
TP5, and TP7). Samples for transcriptomics analysis were collected at time points 1-7, while
samples for metabolomics were collected at time points 3-7.
Transcriptomics
Peripheral blood (PB) samples from each time were point processed and analyzed using a
previously described protocol7. Briefly, RNA was isolated using a RNeasy minikit from Qiagen.
RNA samples (1 μg total RNA) were delivered to the Yerkes National Primate Center Genomics
Core, wheresamples were assessed for quality and prepared for gene expression array analysis as
per manufacturer protocol.
12
Plasma samples were collected with EDTA after sedation with 10 mg/ml of ketamine
given by intramuscular (i.m.) injection. Samples were processed and analyzed using a previously
described protocol8. Briefly, each biological sample was run in triplicate using a 10 µl injection
volume with separation by C18 reverse phase chromatography (Higgins Analytical, Targa, 2.1 x
10 cm) using an acetonitrile gradient8 with electrospray ionization and detection with a Thermo
Scientific LTQ-Velos Orbitrap mass spectrometer of m/z 85 to 2000 at 60,000 resolution.
Following liquid chromatography-high resolution mass spectrometry (LC-MS), the data
were collected and pre-processed using the XCalibur file converter software. apLCMS9 and
xMSAnalyzer10 were used for feature detection and extraction. A metabolic feature was defined
as a specific mass-to-charge ratio (m/z) along with its retention time and associated ion intensity;
14,339 features were detected. Data were log2 transformed and subjected to standard quality
assessment including exclusion of data for technical replicates with greater than thirty percent
missing values. For all further analyses, the median of the three technical replicates of each
metabolic feature were used.
Statistical Analysis
Statistical analysis was completed in two stages with the primary stage being used for
exploratory data analysis. First, Spearman correlation was used to identify features that are
associated with hemoglobin levels in the metabolome and transcriptome independently. Then, a
mixed-effects ANOVA model was used to identify the genes and metabolites that are
differentially expressed across the experimental conditions for each data type. The results of the
ANOVA were then subjected to principal component analysis (PCA) to observe whether or not
13
Statistical significance was determined at p < 0.05 for all tests. In the second stage of analysis, a
group LASSO regression model was constructed to integrate the two data types by identifying
the differences across experimental conditions at the pathway level, and jointly predict the
association of the selected pathways to plasma hemoglobin levels.
For Spearman correlation, each feature for each primate at each time point was correlated
against the hemoglobin levels recorded for the primate at the same time point. The mixed-effects
ANOVA model was constructed using drug-exposure as the fixed effect and animal as the
random effect. Drug exposure was treated as a predictor with three levels that reflected pre-drug
(TP1 and TP2), inter-drug (TP4 and TP6) and post-drug (TP3, TP5, and TP7) exposures.
Following feature selection with ANOVA, the top ten principal components of each platform
were subjected to Pearson correlation (p < 0.05). These primary analyses were used to establish
whether the data set was suitable for integration with LASSO regression.
In order to remove bias from analytical platforms for group LASSO regression, gene
expression and metabolite data were standardized separately. The groups of genes and
metabolites were defined based on a collection of metabolic pathways. PCA was performed on
each pathway of genes or metabolites separately for the data with subjects in drug exposure
groups (inter-drug vs. post-drug). The pre-drug measurements were not used because samples
were not available for metabolomic data. Filtering by variance explained from PCA reduced the
usable number of pathways from 64 to 38 .The leading principal components for each pathway
were then combined into an ordered integrated matrix, in which rows contain principal
components from both the transcriptome and the metabolome per subject. These principal
component scores are used as new predictors in a group LASSO regression with groups defined
14
zero or retain non-zero coefficients. Each integrated pathway of genes and metabolites was
assigned a chronological number, and all 38 groups were used to test for the association of each
pathway with plasma hemoglobin levels. Since a single model is built for the integration of all
pathways using this approach, this method answers the question of which biological pathways
best predict pathway level association with the clinical outcome. All statistical analyses were
conducted and all figures were generated using R.
Results
Features from both the metabolome and transcriptome are associated with plasma hemoglobin levels following pyrimethamine exposure
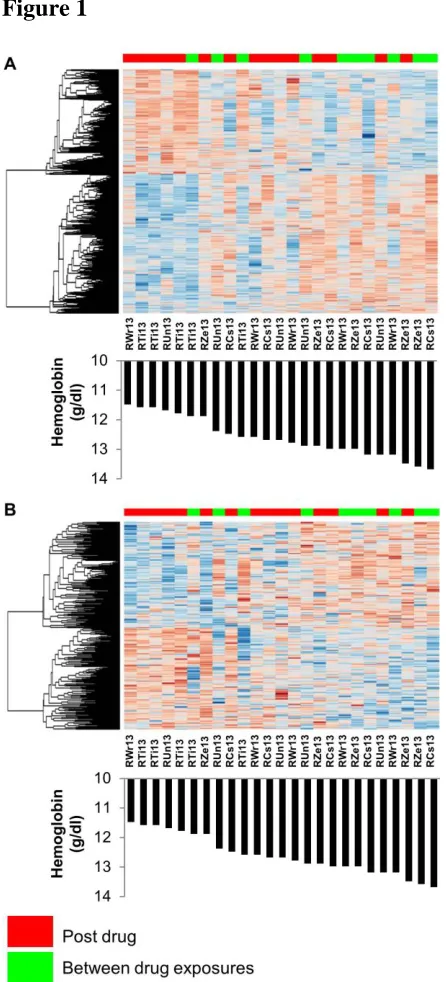
Spearman correlation determined that there were 1,074 genes from the whole blood
transcriptome and 305 metabolic features from the plasma that were correlated with plasma
hemoglobin levels in the macaques for time points 3 to 7 (p < 0.05) (Figure 1). The mixed effects
ANOVA model, in which drug effect was the fixed term and animal was the random term,
determined that 925 genes and 1,660 metabolites were differentially expressed across the
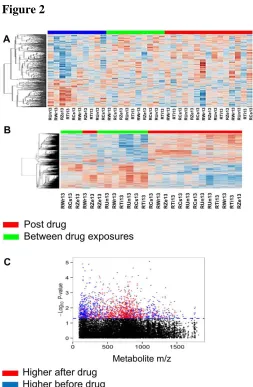
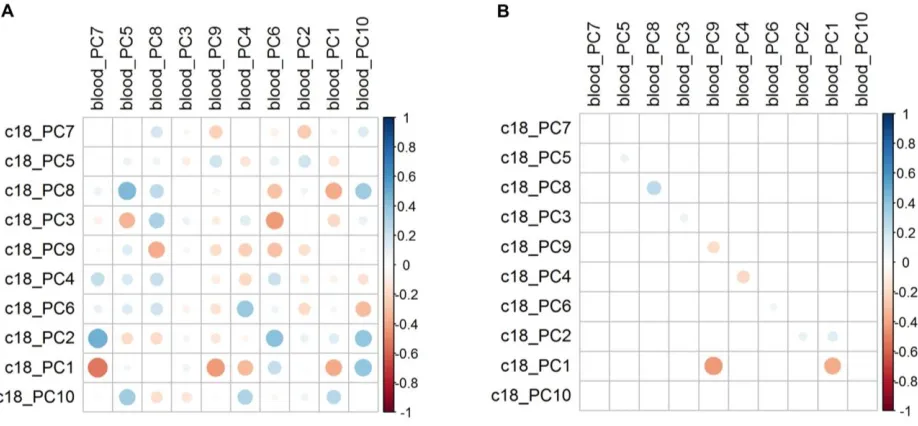
treatment conditions (p < 0.05) (Figure 2). Pearson correlation of the top ten principal
components of the significant features of each data type showed that subsets of features are
potentially co-regulated within the biological system (Figure 3).
Grouping by LASSO provides pathway level information and reduces the number of significant features
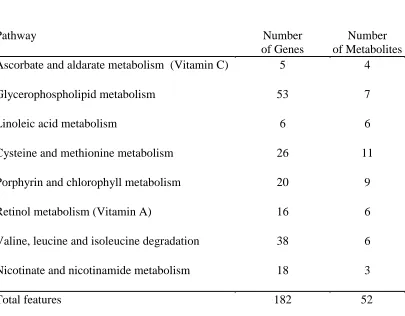
The group LASSO regression model identified eight pathways associated with
hemoglobin levels in macaques (Table 1). The number of genes and metabolites present in these
pathways were 182 and 52 respectively. These pathways involve porphyrin and chlorophyll
15
Multiple vitamin pathways were also selected for association with plasma hemoglobin levels by
the group LASSO model including vitamin A (retinol) and vitamin C.
To verify the findings of the group LASSO method, the porphyrin and chlorophyll
metabolism pathway was selected for further inspection, because heme itself is one type of
porphyrin. From this pathway, the most significant gene in terms of correlation with hemoglobin
and differential expression between inter and post-drug exposures was the ALAS2 gene
(Pearson’s r = -0.53, p = 0.0069; t = -2.225, p = 0.0365) (Figure 4). The end product of the
ALAS2 gene, aminolevulinic acid (m/z = 154.0472) was also selected by the group LASSO
model as a member of the porphyrin metabolism pathway (Pearson’s r = 0.43, p = 0.0333; t =
3.98, p = 0.0010) (Figure 4). This metabolite was also significantly correlated with hemoglobin
and differentially expressed between inter and post-drug exposures (Figure 4). Additional genes
involved in heme synthesis (ALAD and FECH) from the porphyrin pathway were selected by
LASSO, and these genes were both significantly correlated with hemoglobin (ALAD -Pearson’s
r = 0.48, p = 0.0145; FECH - Pearson’s r = -0.49, p = 0.0127). While FECH is differentially
expressed between inter and post-drug exposures (t = -2.673, p = 0.0143), the ALAD gene is not
(t = 0.1883, p = 0.8524) (Figure 5). Other genes from the porphyrin metabolism pathway that
were significantly correlated with plasma hemoglobin were the HCCS (Pearson’s r = 0.46, p =
0.0209) and MMAB (Pearson’s r = 0.41, p = 0.0396) genes.
Discussion and Conclusion
The present study was designed to investigate the effects of the anti-malarial drug
pyrimethamine on the physiology of macaques that have been administered sub-curative doses.
16
on plasma hemoglobin levels in Rhesus macaques, but to also develop a novel method for
integrating transcriptomics and metabolomics data.
Primary analysis of both omic data types using Spearman correlation and mixed effects
ANOVA revealed that there were indeed gene and metabolites that were correlated with plasma
hemoglobin levels in the macaque, and that there were genes and metabolites that could separate
the samples based on drug exposure. As is typical with most omic studies, the list of potential
genes and metabolites that were statistically significant was numerous. Thus we chose to develop
a novel methodology of integrating the data types using group LASSO regression by assigning
the principal components of the data types to knowledge-based pathways. Prior to integration,
the metabolomics data was better at classifying the pyrimethamine exposure level of macaques
than the gene expression data (Figures 6 and 7). Our approach allowed us to account for
variation between drug exposures (inter-drug vs post-drug) and to use this information to predict
associations to hemoglobin at the pathway level.
Our pathway group LASSO regression model selected 8 biological pathways that were
associated with hemoglobin levels in the macaques. Among these pathways was the porphyrin
and chlorophyll metabolism pathway that contains genes and metabolite that are involved in
heme synthesis. Heme is a well-known porphyrin, which functions a cofactor in the hemoglobin
protein that distributes oxygen to the cells of animals and humans. Inspection of the members of
the porphyrin and chlorophyll metabolism pathway revealed that it contained three genes and
one metabolite that are involved in heme synthesis, and that these genes and the metabolite were
either statistically significant for correlation with hemoglobin, differentially expressed between
inter and post-drug exposures, or both. The ALAS2 gene (Figure 4A and 4B) produces an
17
step in the heme biosynthesis pathway. The end product of the reaction, aminolevulinic acid
(Figure 4C and 4D) was also detected using our methods. The remaining two genes from the
pathway were ALAD and FECH. The ALAD gene produces a cytosolic enzyme that catalyzes
the second step in the porphyrin and heme biosynthetic pathway, and the FECH gene produces
ferrochelatase (FECH, protoheme ferrolyase), an enzyme that catalyses the terminal (eighth) step
in the biosynthesis of heme. Other pathway members that met the statistical threshold for
significance were the HCSS and MMAB genes. The HCCS gene produces an enzyme called
holocytochrome c-type synthase, which is involved in a reaction that adds heme to make mature
cytochrome c. Finally, the MMAB gene produces an enzyme that is involved in the formation of
a compound called adenosylcobalamin (AdoCbl), which is derived from vitamin B12. The ability
of the LASSO model to select the porphyrin metabolism pathway was therefore both biologically
and statistically sound.
The remaining pathways selected by group LASSO include a number of pathways that
are involved in anemia. The roles of vitamins A and C in anemia have long been established11.
Heme synthesis, which would be triggered by anemic cellular conditions, originates at the
mitochondria, so the selection of the nicotinate and nicotinamide metabolism pathway for
association with hemoglobin levels by our group LASSO method is also biologically sound. The
branched-chain amino acids (valine, leucine, and isoleucine) are proteogenic, so the involvement
of this pathway is likely a reflection of increased hemoglobin synthesis in the macaques
following pyrimethamine administration.
The evolution of biological science from a descriptive to a quantitative discipline has
ushered in an era of high-throughput omic studies. While the prospect of answering research
18
these methods is not. Certainly, the full potential of multi-omic studies has not been reached, and
this partly due to a great need to integrate the data generated by these studies. To make study
results more manageable, it is not unusual for investigators to subject the results to additional
analyses to uncover system-wide associations such as pathway enrichment and network
modelling. These methods represent domain-knowledge guided approaches6. Our method
addresses the challenge of reducing the targets of interest, while preserving pathway level
information.
Our findings are consistent with current literature, and our technique provides a means by
which this sort of pathway refinement can be performed. As with multiple other strategies for
analyzing omic data, it is difficult to assess the statistical power of the methods used here. A
major limitation is that our results are based on a small population of five subjects, though they
were followed over a 100 day time course. Additional studies must be performed to determine
the universal power of our approach. Nonetheless, our findings provide new insights into the
mode of action by which pyrimethamine influences hemoglobin metabolism, demonstrating that
pathway group LASSO is a novel and effective method of integrating metabolomics and
19
Table 1. Pathways selected by group pathway LASSO for association with plasma hemoglobin in macaques between and after pyrimethamine exposure with the numbers of contributing features.
Pathway Number
of Genes
Number of Metabolites
Ascorbate and aldarate metabolism (Vitamin C) 5 4
Glycerophospholipid metabolism 53 7
Linoleic acid metabolism 6 6
Cysteine and methionine metabolism 26 11
Porphyrin and chlorophyll metabolism 20 9
Retinol metabolism (Vitamin A) 16 6
Valine, leucine and isoleucine degradation 38 6
Nicotinate and nicotinamide metabolism 18 3
20
Figure 1
Figure 1. Features in the Rhesus macaques that are significantly correlated with hemoglobin
levels at time points (TP) 3 – 7. (A) Heat map showing the 1,074 genes that are associated with
21
hemoglobin (p < 0.05). Inter-drug exposure includes samples from TP4 and TP6. Post-drug
[image:22.612.70.323.135.522.2]exposure includes samples from TP3, TP5, and TP7.
Figure 2
Figure 2. Genes and metabolites in the macaques that were differentially expressed across
experimental time points (TP) due to drug exposure. (A) The top 925 genes (p < 0.05). (B) The
top 1660 metabolites (p < 0.05). Pre-drug exposure includes samples from TP1 and TP2.
Inter-drug exposure includes samples from TP4 and TP6. Post-Inter-drug exposure includes samples from
22
Figure 3
Figure 3. Correlation of Principal Components of differentially expressed genes and metabolites
before pathway assignment. (A) Pearson correlation of top 10 principal components before
testing for statistical significance. Pearson correlation of top 10 principal components after
23
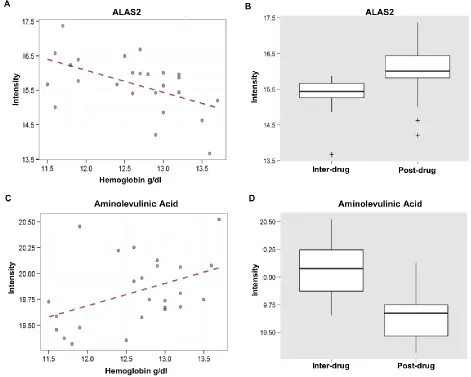
Figure 4
Figure 4. The most significant gene and metabolite from the porphyrin metabolism pathway that
was selected by Group Pathway LASSO. (A) The ALAS2 gene is correlated with plasma
hemoglobin (Pearson’s r = -0.53, p = 0.0069). (B) The ALAS2 gene is differentially expressed
between inter and post-drug exposure conditions (t = -2.225, p = 0.0365). (C) Aminolevulinic
24
acid is differentially expressed between inter and post-drug exposure conditions (t = 3.98, p =
[image:25.612.73.540.139.544.2]0.0010).
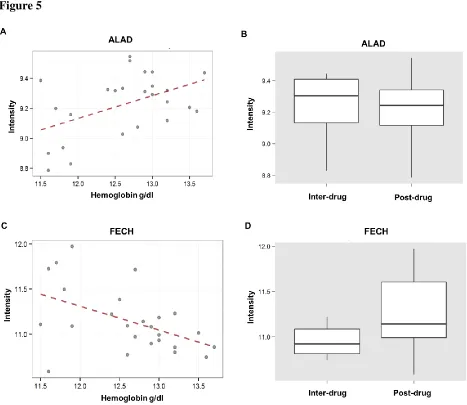
Figure 5
Figure 5. Significant genes and metabolites from the porphyrin metabolism pathway that were
selected by Group Pathway Lasso. (A) The ALAD gene is correlated with plasma hemoglobin
(Pearson’s r = 0.48, p = 0.0145); however the ALAD gene (B) is not differentially expressed
between inter and post-drug exposure conditions (t = 0.1883, p = 0.8524). (C) The FECH gene is
correlated with plasma hemoglobin (Pearson’s r = -0.49, p = 0.0127). (D) FECH is differentially
25
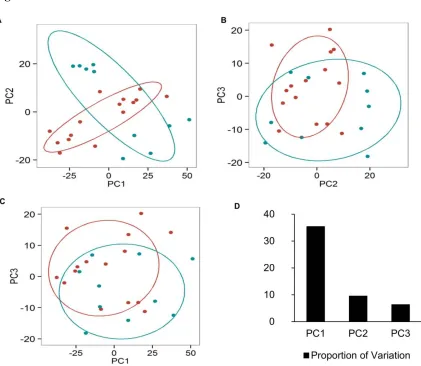
Figure 6
Figure 6. Plot of principal component analysis (PCA) of metabolites that are differentially
expressed in macaques between and after treatment with pyrimethamine. PC1, principal
component 1; PC2, principal component 2; PC3, principal component 3. Each point/circle
represents a sample. Samples from inter-drug exposure (TP4 and TP6) are colored in cyan and
26
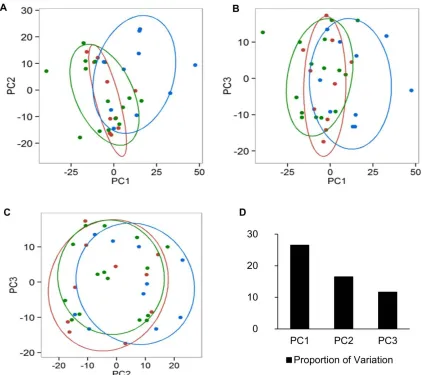
Figure 7
Figure 7. Plot of principal component analysis (PCA) of genes that are differentially expressed
in macaques before, between, and after treatment with pyrimethamine. PC1, principal
component 1; PC2, principal component 2; PC3, principal component 3. Each point/circle
27
from inter-drug exposure (TP4 and TP6) are colored in red, and samples from post-drug
exposure (TP3, TP5, and TP7) are colored in green.
References
1. WHO. World Malaria Report 2014. Available from:
http://www.who.int/malaria/publications/world_malaria_report_2014/en/.
2. Odongo, C.O., et al., Is there a distinction between malaria treatment and intermittent
preventive treatment? Insights from a cross-sectional study of anti-malarial drug use
among Ugandan pregnant women. Malar J, 2015. 14: p. 189.
3. Smith Paintain, L., et al., Intermittent screening and treatment versus intermittent
preventive treatment of malaria in pregnancy: provider knowledge and acceptability.
PLoS One, 2011. 6(8): p. e24035.
4. Mbu, R.E., et al., Clinical malaria among pregnant women on combined insecticide
treated nets (ITNs) and intermittent preventive treatment (IPTp) with
sulphadoxine-pyrimethamine in Yaounde, Cameroon. BMC Womens Health, 2014. 14: p. 68.
5. Salinas, J.L., et al., Metabolomics in the fight against malaria. Mem Inst Oswaldo Cruz,
2014. 109(5): p. 589-97.
6. Ritchie, M.D., et al., Methods of integrating data to uncover genotype-phenotype
interactions. Nat Rev Genet, 2015. 16(2): p. 85-97.
7. Lee, K.J., et al., Comparative transcriptomics and metabolomics in a rhesus macaque
drug administration study. Front Cell Dev Biol, 2014. 2: p. 54.
8. Jones, D.P., et al., Redox analysis of human plasma allows separation of pro-oxidant
events of aging from decline in antioxidant defenses. Free Radic Biol Med, 2002. 33(9):
28
9. Yu, T., et al., apLCMS--adaptive processing of high-resolution LC/MS data.
Bioinformatics, 2009. 25(15): p. 1930-6.
10. Uppal, K., et al., xMSanalyzer: automated pipeline for improved feature detection and
downstream analysis of large-scale, non-targeted metabolomics data. BMC
Bioinformatics, 2013. 14: p. 15.
11. Fishman, S.M., P. Christian, and K.P. West, The role of vitamins in the prevention and