LIGHTNING EFFECTS ON UNDERGROUND DISTRIBUTION CABLE USING ALTERNATIVE TRANSIENT PROGRAM
MOHAMAD HAFIZ BIN ABD RAHIM
A project report submitted in partial fulfillment of the requirement for the award of the
Degree of Master of Electrical Engineering
Faculty of Electrical and Electronics Engineering Universiti Tun Hussein Onn Malaysia
vi
ABSTRACT
vii
ABSTRAK
Kabel bawah tanah biasanya digunakan dalam keadaan di mana keperluan untuk menghantar kuasa ke seberang sungai, laut atau melalui kawasan berpenduduk padat. Walaupun kabel bawah tanah tidak langsung terdedah kepada bahaya voltan tinggi yang terhasil dari kilat tetapi ia juga boleh menyebabkan potensi pada penebat kabel bawah tanah. Kira-kira 80% daripada sambaran kilat di Malaysia menghasilkan voltan yang melebihi 20 kV. Kajian ini dilakukan untuk menentukan sebarang kemungkinan kerosakan pada penebat kabel bawah tanah sama ada dengan sambaran kilat secara langsung atau secara aruhan. Simulasi ini dilakukan dengan menggunakan perisian
Alternative Transient Program versi Electromagnetic Transients Program (ATP-EMTP)
viii
CONTENTS
TITLE i
DECLARATION ii
DEDICATION iv
ACKNOWLEDGEMENT v
ABSTRACT ABSTRAK
vi vii
CONTENTS viii
LIST OF TABLES xi
LIST OF FIGURES xii
LIST OF SYMBOLS AND ABBREVIATIONS xiv
CHAPTER 1 INTRODUCTION 1
1.1 Project Overview 1
1.2 Objectives of Project 2
1.3 Problem Statement 2
1.4 1.5 1.6
Scope of Project Organization of Report Conclusion
3 3 4
CHAPTER 2 EFFECT ON UNDER GROUND CABLE: A REVIEW
5
2.1 Introduction 5
2.2 Lightning
2.2.1 Definitions of Lightning
2.2.2 Direct and Indirect Lightning Strikes 2.2.3 Standard Lightning Wave Shape
ix
2.3 Underground Cable
2.3.1 Directly Buried Underground Cable Installation
2.3.2 Underground Cable Parameters 2.3.3 Material for sheath and armour cable
9 11
12 14
2.4 Soil 15
2.4.1 Soil Model in the Form of an Electrical Circuit
16
2.4.2 Wenner Soil Resistivity Testing and Other 4-Point Tests
2.4.3 Soil Resistivity and Factors Affecting Soil Resistivity
17
18
2.5 Conclusion 19
CHAPTER 3 EMTP MODEL FOR SIMULATION 20
3.1 Introduction 20
3.2 Digital Simulation Program 22
3.3 System Configuration 23
3.3.1 Lightning source 23
3.3.2 Soil Model
3.3.3 Underground Cable Model
25 26
3.4 System Data 27
3.5 Conclusion 30
CHAPTER 4 LIGHTNING EFFECT ON UNDERGROUND CABLE
31
4.1 Introduction 31
4.2 Circuit Model for Cable and Soil for the System 31 4.3 Sheath and Armour Represent Resistor 32
4.3.1 Sheath (Copper) and Armour (Aluminum)
x
4.3.2 Sheath (Copper) and Armour (Steel) 4.3.3 Sheath (Copper) and Armour (Zinc) 4.3.4 Sheath (Copper) and Armour (Lead) 4.3.5 Sheath (Copper) and Armour (Iron) 4.3.6 Sheath (Copper) and Armour (Tin)
35 36 38 40 42
4.4 Discussion 44
4.5 Conclusion 46
CHAPTER 5 CONCLUSION AND RECOMMENDATION 47
5.1 Introduction 47
5.2 Conclusion 47
5.3 Recommendation 48
REFERENCES APPENDIX
xi
LIST OF TABLES
2.1 Resistivity of selected metal (sheath and armour) 15 2.2
3.1
Soil resistivity for various soil type Air and soil characteristics
19 27 3.2 Dimensions and properties of intermediate
conductor component
28
3.3 Thickness and properties of intermediate component's insulation
28
3.4 Parameter Data of Cable 28
3.5 Soil Parameter Data 29
3.6 3.7 4.1 4.2 4.3 4.4 4.5 4.6 4.7 4.8
Armour and sheath material Armour and sheath parameter Parameter for the cable design
Peak Voltage for Armour (Aluminium) and Sheath (Copper)
Peak Voltage for Armour (Steel) and Sheath (Copper)
Peak Voltage for Armour (Zinc) and Sheath (Copper)
Parameter for the cable design
Peak Voltage for Armour (Lead) and Sheath (Copper)
Peak Voltage for Armour (Iron) and Sheath (Copper)
Peak Voltage for Armour (Tin) and Sheath (Copper)
29 29 33 34 36 38 38 40 42 43
xii
LIST OF FIGURES
2.1 Formation of Lightning 6
2.2 Direct lightning strike on overhead lines 8
2.3 Indirect lightning strike 8
2.4 Lightning Impulse Wave Shape 9
2.5 A side view and a cross section of cable 10
2.6 Cable laid directly buried underground 11
2.7 2.8 2.9
Underground cable circuit model
An example type of soil textural triangle
Equivalent electro thermal circuit (T equivalent circuit) used for each of the individual layers modelled
13 16 18
3.1 Flowchart of the analysis 21
3.2 ATP Flowchart 22
3.3 Layer name and thickness of the cable 23
3.4 Heidler type source 23
3.5 Component heidler window 24
3.6 Waveform of lightning inject 1.2/50 us for Time equal 60 us in the system
25
3.7 Soil model in electrical circuit represented 26
3.8 Underground cable model circuit 27
4.1 Circuit model for the system representing resistance induction
32
4.2 (a) Voltage induce at V1 (Red), V3 (Green), V5 (Blue) for armour
33
4.2 (b) Voltage induce at V2 (Red), V4 (Green), V6 (Blue) for sheath
xiii
4.3 (a) Voltage induce at V1 (Red), V3 (Green), V5 (Blue) for armour
35
4.3 (b) Voltage induce at V2 (Red), V4 (Green), V6 (Blue) for sheath
35
4.4 (a) Voltage induce at V1 (Red), V3 (Green), V5 (Blue) for armour
37
4.4 (b) Voltage induce at V2 (Red), V4 (Green), V6 (Blue) for sheath
37
4.5 (a) Voltage induce at V1 (Red), V3 (Green), V5 (Blue) for armour
39
4.5 (b) Voltage induce at V2 (Red), V4 (Green), V6 (Blue) for sheath
39
4.6 (a) Voltage induce at V1 (Red), V3 (Green), V5 (Blue) for armour
41
4.6 (b) Voltage induce at V2 (Red), V4 (Green), V6 (Blue) for sheath
41
4.7 (a) Voltage induce at V1 (Red), V3 (Green), V5 (Blue) for armour
42
4.7 (b) Voltage induce at V2 (Red), V4 (Green), V6 (Blue) for sheath
43
4.8 Armour and sheath peak voltage for the type of metal
xiv
LIST OF SYMBOLS AND ABBREVIATIONS
a kA kV Cu XLPE SWA AWA CWS PVC HDPE Ω ρ ɛo ɛr µo l m Z I L
r
out 𝜌𝑠 m² J(r) Tsta Tsto - - - - - - - - - - - - - - - - - - - - - - - - - - Ampere Kilo Ampere Kilo Volt CuprumCross link polyethylene Steel Wire Armored Aluminum Wire Armored Copper Wire Screen Polyvinyl Chloride
High Density Polyethylene Ohm
Resistivity
Permittivity of Vacuum Relative Permittivity Permeability
Length Meter Impedance
Lightning current amplitude Inductance
Outside radius of insulation
Soil Resistivity Meter square
Current density at radius r (A/m²) Time Start
xv
T N s A
µ
r
in- - - - - -
time speed seconds Area Micro
CHAPTER 1
INTRODUCTION
1.1 Project Overview
Underground or submarine cables is an effective method for the delivery of electricity across crowded areas or body of water such as river or sea to consumers other than using overhead lines. For some cases, it is impossible to accommodate for distribution using the overhead line system approach and as an option the underground cable become necessary to replace the overhead line system for transmission and distribution. The use of underground cables is the other method because it is a high cost during installation but reduces maintenance costs. In addition to the advantages of underground cables can also avoid the occurrence of such heavy snow and thunderstorms which may cause damage if used on the overhead line. Underground cables suitable for urban areas because it is hidden from the high-rise buildings in addition to reducing the area for installing poles for overhead lines.
2 current and voltage into the cable. The effects of electric fields due to direct lightning strikes on ground to underground cable need to be considered.
1.2 Objectives of Project
The objectives of this study are as follows:
1. To design and model circuit that represent soil and underground cable; 2. To investigate the effects of lightning strike to ground on underground
cable system over various condition due to its induced voltage And to underground cable at near, middle and far on the cable
3. To verify any possibility of having insulation breakdown or damage due to lightning induced voltage;
1.3 Problem Statement
3 1.4 Scope of Project
This project emphasizes on the voltage induced when 40,000 Volt lightning voltage injected into the aforesaid system designed. The 33000 Voltage rated underground cable system was modelled by taking into consideration all parameters involve. The analysis will be based on voltage induced due to lightning strike on ground for the determination of any possibility that can cause insulation failure or breakdown to the underground cable at 100 meter length. The effect will be focus on the mechanical protection such as armour and sheath.
1.5 Organization of Report
Generally this thesis can be divided into five chapters. The chapters are presented as follows:
Chapter I describes about project background, problem statement project’s objectives and project’s scopes as an introduction to this research project.
Chapter II consists of some theory background of this project such as lightning introduction, parameters of lightning, lightning components, underground cable characteristic, soil type and parameters, etc. Studies on literature review are needed in order to carry out the experiment and for the thesis writing’s references.
Chapter III explains the experimental procedures and simulation studies. The method of the experiments will be presented in flow chart together with some brief explanations.
4 Finally, Chapter V will summarize and conclude all the results of the research project followed by some recommendations which will contribute for the future research.
1.6 Conclusion
CHAPTER 2
EFFECT ON UNDER GROUND CABLE: A REVIEW
2.1 Introduction
Overvoltage is a condition where the voltage raised higher than it’s rated. A transient overvoltage is a high voltage which has a rapid rise to the peak value and slowly decays to zero value [2]. Transient overvoltage can cause breakdown of insulation. A typical natural source of transient overvoltage events is lightning. Lightning is natural phenomena that accomplished by thunder which is very intense and unpredictable that can induce overvoltage. The current diffusion in the ground may also affect underground networks. When lightning strikes the ground, the discharge current diffuses uniformly into the surrounding soil. Soil type is also important in the impact of excess voltage where resistance in soil can reduce the resulting voltage of lightning to get to underground cables. In addition to the types of cable, underground cable depth grown can also reduce damage to the cable depends on soil resistivity
2.2 Lightning
6
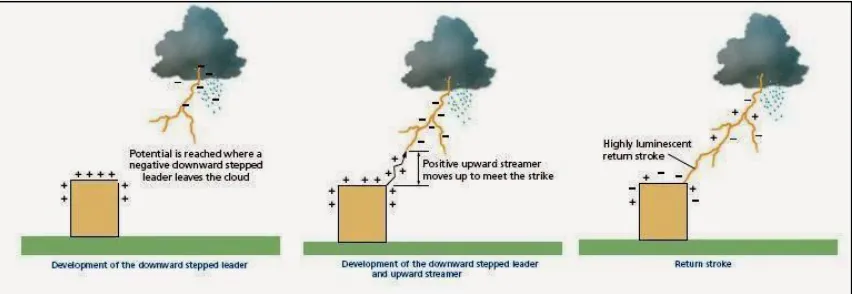
in the clouds separate charges so that positive charges moves end up at the top of the cloud while negative flow to the bottom. When the negative charge moves down, a "pilot leader" is created. 'This leader rushes toward the earth in 150-foot discrete steps, ionizing a path in the air. 'The final breakdown generally occurs to a high object the major part of the lightning discharge current is then carried in the return stroke which flows along the ionized path. An estimation that had been done by scientists that the earth is struck by lightning on the average of 100 times every second. Most lightning strike occurrences contain multiple strokes. 20% of these occurrences are only one stroke and 80% are two or more strokes, while the mean stroke is 5 to 6. The maximum that has been recorded is 26 but the most common number is 3 to 4 with the time interval between strokes of 40 ms.
[image:17.612.116.542.507.654.2]According to Martin A. Uman [4], 90% of cloud-to-ground lightning initiated by downward moving negative charged leader while only 10% of the cloud-to-ground lightning are initiated by downward moving positive leader. After leader, there is an arc current travels from ground to thundercloud, called return stroke. After few tens of milliseconds, another leader will travel down and produce second return stroke and this process can be repeated for a numbers of times. The maximum return strokes recorded by Martin A. Uman are 26 strokes, while the most common number of return stroke are 3 to 4 strokes with a time interval between strokes is about 30 ms to 40 ms.
7
2.2.1 Definitions of Lightning
There are many definitions of lightning. Lightning can be explained from several perspectives with different references. Martin A. Uman [4] said lightning is a transient, high-current discharge whose path length is measured in kilometres. Lightning also occur when one part in atmosphere consist large electric charges which can lead to electric field and charge that can cause air breakdown. While Britannica Micropedia said lightning occurs when some region of the atmosphere attains an electrical charge of sufficient potential to cause dielectric breakdown of the air. Last but not least, from BS 6651 1992 said lightning is an electrical discharge between cloud and earth, of atmospheric origin, comprising one or more impulses of many kilo amps. The electric field strength in soils at a radius of r meters is given by the following equation, by determining of lightning current distributed in radius around lightning strike point in hemisphere [5, 6].
𝐸(𝑟) = 𝜌𝑠𝐽(𝑟) = 𝜌𝑠 𝐼
2𝜋𝑟2 (2.1)
Where,
𝜌𝑠 Soil resistivity (Ωm)
J(r) Current density at radius r (A/m²) I Lightning current amplitude (A)
2.2.2 Direct and Indirect Lightning Strikes
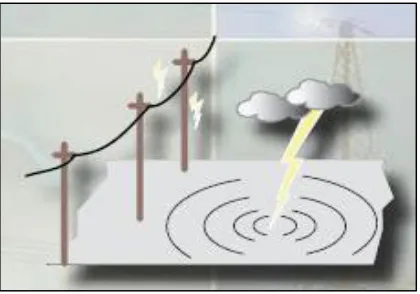
Lightning causes damage because it generates electrical transients (very short-lived events) like overvoltage and power surges and strikes.
8
[image:19.612.222.434.127.274.2]structure, electric distribution system, and cause fires. And the electromagnetic pulse energy of a lightning strike can affect electrics and electronics 2 kilometres away.
Figure 2.2: Direct lightning strike on overhead lines
Indirect lightning strikes are one, though not the only, cause of low-level transients. Strikes in the vicinity of a building and on power lines lead to overvoltage induced by the electromagnetic fields from the lightning current. Though typically less damaging than direct strikes, they are enough to melt electronic circuitry.
[image:19.612.223.433.430.577.2]9
2.2.3 Standard Lightning Wave Shape
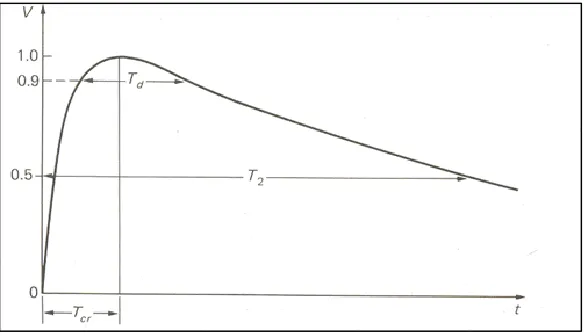
[image:20.612.182.474.237.405.2]The breakdown or flash-over voltage of the electrical equipment with this wave shape are required to be equal or higher than the basic insulation level fixed and the spark over voltage and discharge voltage of the protecting devices. The Basic Lightning Impulse Insulation Level (BIL) are specified for the standard lightning impulse wave shape [7]. The general lightning impulse wave shape is illustrated in Figure below.
Figure 2.4: Lightning Impulse Wave Shape
BIL implies the limits up to which the insulator could withstand impulse due to lightning stoke. The front time and the tail time of the impulse is represented by TCf and T2 respectively. Front time is the interval between t=0 to the peak voltage or current. While tail time is the interval between t=0 to where the function amplitude has fallen 50% of its peak value. The standard lightning impulse wave shape is 1.2/50 μs which means 1.2 μs for the front time and 50 μs for the tail time [7].
2.3 Underground Cable
10
[image:21.612.114.541.136.266.2]operational lifetime and improved system security. To ensure a reliable underground cable network, care must be taken during the installation of the cables.
Figure 2.5: A side view and a cross section of cable [1]
Distribution of electricity is one of the core businesses, hence high efficiency and optimum use of cable properties in delivering electricity for powering the desired load is of upmost interest. The selected method of installation shall optimize the current carrying capacity or known as ampacity [8].
There are two mainly costs associated in choosing the right method of installation which are the initial cost and long-term cost. Initial cost consists of planning constructing and commissioning of the cable. Long-term cost includes any works that require direct access to the cable.
11
There were four types of installation systems that were studied in this study that are:
a. Cable directly buried underground b. Cable laid inside duct bank
c. Cable laid inside cable trench d. Cable laid inside tunnel
Based on the results, cable directly buried underground gives higher ampacity and the cost is less compare to other types of installation. However the option to choose it will depends on the local authority requirement [9].
2.3.1 Directly Buried Underground Cable Installation
[image:22.612.243.410.528.669.2]Majority cables in Malaysia are directly buried 1.5 meter depth in the ground as shown in Figure 1. This type of installation is usually prone to third party digging which will lead to breakdown [9]. However, the safety of the cable is maintained by ensuring that the minimum distance between the underground cables with other service is 6 inches. Besides that, roads, ditches, railroads need to use glass ceramic pipes for added protection. The. Slab and brick installation in subsoil means there are underground cables that provide additional security in the event of third party cable makes excavation.
12
A layer of sand should be planted around the cable before the original soil area is used for fine sand structure, easy to absorb moisture and high humidity (cold).
2.3.2 Underground Cable Parameters
The line equations are the same for underground or submarine cables and overhead lines because the parameters R’, L’, G’, C’ per unit length are distributed along a cable in the same way as on an overhead lines.
− [𝑑𝑉
𝑑𝑥] = [𝑅
′(𝜔) + 𝑗𝜔𝐿′(𝜔)][𝐼] (2.1)
− [𝑑𝐼
𝑑𝑥] = [𝐺
′(𝜔) + 𝑗𝜔𝐶′][𝑉] (2.2)
Overhead lines are simple in geometry. There are more variations in underground and submarine cable geometries. Shunt conductance G’ is negligible on overhead lines but in underground cable it is much larger and represents dielectric losses [10].
𝐺′= tan 𝜕. 𝜔𝐶′ (2.3)
The shunt capacitance C’ is much larger than on overhead lines because the conductors core conductor, sheath etc.) are very close together. The value for inductance L’ is small typically of L’ overhead. While the value for C’ is large which typically 20 times of overhead. The parameter L’ and C’ can be converted to surge impedance Z and wave peed c by the following equation [10].
𝑍 = √𝐿′
𝐶′ (2.4)
𝐶 = 1
13
Give typical values for underground cable
Z ≈ 30 to 70 Ω (1/10 of overhead line) C ≈ 160 000 km/s (1/2 of overhead line)
The shunt capacitance for insulation between core conductor and sheath, or sheath and armour, or sheath and soil can be calculated using equation (2.6).
𝐶′ = 2𝜋𝜀𝑜𝜀𝑟 𝑙𝑛 𝑟𝑜𝑢𝑡 𝑟𝑖𝑛
(2.6)
Where;
ɛo Permittivity of vacuum ɛr Relative permittivity rout Outside radius of insulation rin Inside radius of insulation
[image:24.612.166.489.498.642.2]Since C’ of an underground cable is very large, it may be good enough to represent a “short” cable as a lumped capacitance, if the frequencies are not high.
14
2.3.3 Material for sheath and armour cable
Mechanical protection is one of the layers contained in a cable. Sheath and shield is a material called mechanical protection where it is very important to protect the power cable of a cable of material or heavy vehicles such as trucks, concrete, etc. which can damage the cable. Many covers and shields made of metal materials that have the ability to carry an electrical current (conductor).
Many resistors and conductors have a uniform cross section with a uniform flow of electric current, and are made of one material. In this case, the electrical resistivity ρ (rho) is defined as:
𝜌 = 𝑅𝐴
𝑙 (2.7)
where
R is the electrical resistance of a uniform specimen of the material (ohms, Ω) l is the length of the piece of material (meters, m)
A is the cross-sectional area of the specimen (meter square, m2).
15
Table 2.1: Resistivity of selected metal (sheath and armour) [11]
Metal Resistivity, ρ (Ωm)
Aluminum 26.5𝑥10−9
Steel (plain) 180𝑥10−9
Copper 17.1𝑥10−9
Zinc 59𝑥10−9
Lead 208𝑥10−9
Iron 96.1𝑥10−9
Tin 115𝑥10−9
2.4 Soil
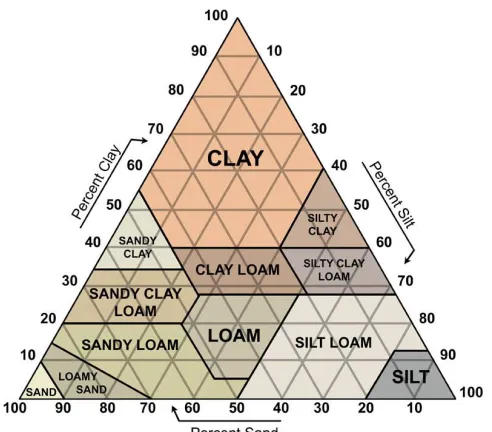
16
Figure 2.8: An example type of soil textural triangle
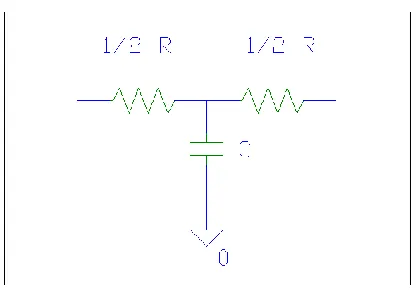
2.4.1 Soil Model in the Form of an Electrical Circuit
Soil resistivity testing is the process of measuring a volume of soil to determine the conductivity of the soil. The resulting soil resistivity is expressed in ohm-meter or ohm-centimetre.
17
2.4.2 Wenner Soil Resistivity Testing and Other 4-Point Tests
The Wenner 4-point Method is by far the most used test method to measure the resistivity of soil. Other methods do exist, such as the General and Schlumberger methods, however they are infrequently used for grounding design applications and vary only slightly in how the probes are spaced when compared to the Wenner Method.
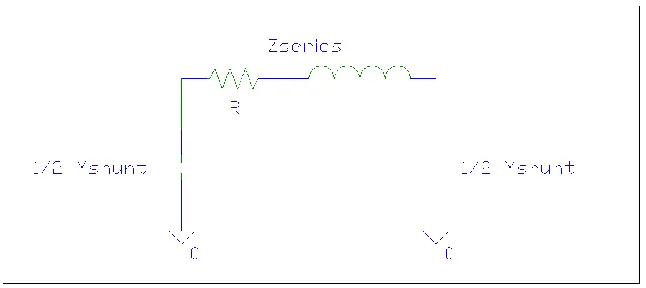
An alternative to the exponential equation of the IEC standards is proposed in [12] and [13] to model the soil. The underlying idea is to subdivide the soil surrounding the cables into several concentric layers. Each soil layer is represented with its RC thermal T equivalent circuit (Fig. 2.9) to be compatible with the IEC standards [14], [15]. The soil model parameters are computed from the thermal resistivity, the heat capacity of the soil, and the dimensions of each layer using the following formula [16]
𝜌 = 4𝜋𝐴𝑅
1+ 2𝐴
√(𝐴2+4𝐵2)−√(𝐴2+𝐵2)
(2.8)
𝐶 = 𝜀𝑟 (𝑠𝑜𝑖𝑙)𝑥 𝜀0(𝑓𝑟𝑒𝑒 𝑠𝑎𝑝𝑐𝑒) (2.9)
18
Figure 2.9: Equivalent electro thermal circuit (T equivalent circuit) used for each of the individual layers modelled
The physical discretization of the soil can be observed, where the T equivalent circuits representing each layer are illustrated. The values of R and C in the circuit are defined in (2.8) and (2.9). Once the equivalent resistances and capacitances are calculated for each layer, the RC ladder of the soil can be constructed by concatenating all the T equivalent sub circuits into a complete ladder model.
2.4.3 Soil Resistivity and Factors Affecting Soil Resistivity
19
Table 2.2: Soil resistivity for various soil type [18]
Soil Type Resistivity (Ω-cm)
Minimum Average Maximum
Ashes, brine or cinders 590 2,370 7,000
Concrete (below ground) - 3,000 -
Clay, gumbo, loam or shale 340 4,060 16,300
Clay, gumbo. Loam or shale with varying portions of sand and gravel
1,020 15,800 135,000
Gravel, sand or stone with little clay or loam
59,000 94,000 458,000
In general, soil resistivity decreases (improves) as electrolytes increase. Because the resistivity of soil is directly affected by its moisture content and temperature, it is reasonable to conclude that the resistance of any grounding electrode system will vary throughout the different seasons of the year. Temperature and moisture content both become more stable as distance below the surface of the earth increases.
2.5 Conclusion
CHAPTER 3
EMTP MODEL FOR SIMULATION
3.1 Introduction
21
Figure 3.1: Flowchart of the analysis Start
Cable Model Using EMTP
Soil Model Using EMTP
Modelling of prameters for soil and cable, eg. R
& C
Evaluation of modelling parameter
Apply lightning on soil/earth
Analysis the effect of lightning on underground cable
Plot the related graph
End
Adjustment of R parameters No
22
3.2 Digital Simulation Program
The Alternative Transient Program (ATP) and Electromagnetic Transient Program (EMTP) are one of the most widely used software by electric power industry for digital simulation of electrical system transient phenomena of electromagnetic as well as electromechanical nature in electric power systems. ATP program is a powerful tool for modelling power system transients [6]. The Alternative Transient Program version of the Electromagnetic Transients Program (ATP-EMTP) is an integrated engineering software tools that have been used world-wide for switching and lightning surge analysis, insulation coordinate on studies and etc. ATP Draw is a graphical pre-processor to the ATP version of the EMTP. ATP Draw has a standard Windows layout and offers a large Windows help file system. User can build up the electric circuit in the program by selecting predefined components from an extensive palette.
[image:33.612.244.398.369.616.2]
Figure 3.2: ATP Flowchart Start
ATP Setting (Time Domain)
Data Setting ( Parameter such as modelling of the soil
and cable)
ATP Plot XY ( Graph Plot)
23
3.3 System Configuration
[image:34.612.175.481.217.417.2]The system consists of a 33kV Cu/XLPE/CWS/PVC/HDPE insulated armoured Polyvinyl Chloride (PVC) sheathed cablerated [1] underground cable with a length of 100 meters buried underground at a depth of 1.5 and 2.0 meters. The cable dimensions are illustrated in the Figure 3.3 below.
Figure 3.3: Layer name and thickness of the cable
3.3.1 Lightning source
The lightning source represent by surge function of Heidler type 15 in ATP. The source can be selected by setting the current or voltage refer to our priority.
24
[image:35.612.172.483.255.525.2]The Figure 3.5 shown that detail component heidler where we can setting to create the lightning waveform base on the original data such as 1.2/50 µs. T_f is the front duration time in seconds which is the interval between t=0 to the function peak. The stroke duration which is the interval between t=0 to the point on the tail where the function amplitude has fallen 50% of its peak value is represented by tau in seconds. Tsta is the starting time in seconds, Tsto is the ending time also in seconds and n is the factor influencing the rate of rise of the function. The maximum steepness will be increased if the value of n increase.
Figure 3.5: Component heidler window
49
REFERENCES
[1] Central Cable Bhd. Batu Berendam, Melaka, XLPE Insulated Power Cable – JKR Specification
[2] M S Naidu and V Kamaraju (2004). High Voltage Engineering. 3rd Edition. Tata Mcgraw-Hill Publishing Company Limited
[3] B. Franklin, Experiments and Observations on Electricity at Philadelphia, E. Cave, London, 1774; See Also I. B. Cohen, Benjamin Franklin's Experiments, Harvard Univ. Press, Cambridge, 1941
[4] Martin A. Uman, “Natural Lightning”, IEEE Transaction on Industry Application, Vol. 30, No. 3, Pp.785-790, May/June 1994.
[5] N. Klairuang, W. Pobpom and J. Hokierti, Member, EEE (Nov. 2004). Effects of Electric Fields Generated By Direct Lightning Strikes on Ground to
Underground Cables. International Conference on Power SystemTechnology –
POWERCON, Singapore.
[6] Zeqing Song, M. R. Raghuveer, Jingliang He (2002). Complete Assessment Of
Impact Of Lightning Strikes On Buried Cables. IEEE Canadian Conference On
Electrical & Computer Engineering
[7] Subir Ray, ‘An Introduction High Voltage Engineering’, Professor Department Of Electrical Engineering College of Technology Govind Ballabh Pant University Of Agriculture and Technology, New Delhi 2006
50 Hazirawati Hashim1, A, Masliza Md. Noah2, B, Azrul Mohd. Ariffin3, C, Mahmoud
[9] Ampacity Simulation of Various Underground Cable Installation Systems Z. Aida Abu Zarim
[10] Hermann W. Dommel (Sept. 2010). Underground And Submarine Cable
Parameters. The University Of British Columbia. Power System Consultants,
Vancouver, Canada.
[11] Http://Physics.Info/Electric-Resistance/
[12] R. S. Olsen, J. Holboll, and U. S. Gudmundsdottir, ``Dynamic Temperature Estimation and Real Time Emergency Rating of Transmission Cables,'' In Proc. IEEE Power Energy Soc. Gen. Meet., Jul. 2012, Pp. 1_8.
[13] R. Olsen, G. J. Anders, J. Holboell, And U. S. Gudmundsdottir, ``Modelling Of Dynamic Transmission Cable Temperature Considering Soil-Speci_C Heat, Thermal Resistivity, And Precipitation,'' IEEE Trans. Power Del., Vol. 28, No. 3, Pp. 1909_1917, Jul. 2013.
[14] G. J. Anders, Rating Of Electric Power Cables. New York, NY, USA: Mcgraw-Hill, 1997.
[15] Calculation of the Cyclic and Emergency Rating of Cables, IEC Standards 60853-1 and IEC 60853-2, 1989.
[16] Http://Www.Esgroundingsolutions.Com/About-Electrical-Grounding/What-Is-Soil-Resistivity-Testing.Php
51 And Computer Engineering, Nyu Polytechnic School Of Engineering, New York University, Rooklyn, Ny 11201 Usa, 20 October 2014.
[18] Soil Resistivity Variability And Factors Affecting Soil Resistivity, Standards And Guidelines For Communication Sites, Motorola Company, 9/1/05
[19] Simulation Study on Lightning Effects to 132 Kv Underground Cable, Noremyliah
![Figure 2.5: A side view and a cross section of cable [1]](https://thumb-us.123doks.com/thumbv2/123dok_us/8761909.894423/21.612.114.541.136.266/figure-view-cross-section-cable.webp)
![Figure 2.6: Cable laid directly buried underground [9]](https://thumb-us.123doks.com/thumbv2/123dok_us/8761909.894423/22.612.243.410.528.669/figure-cable-laid-directly-buried-underground.webp)
![Table 2.1: Resistivity of selected metal (sheath and armour) [11]](https://thumb-us.123doks.com/thumbv2/123dok_us/8761909.894423/26.612.113.542.107.282/table-resistivity-selected-metal-sheath-armour.webp)
![Table 2.2: Soil resistivity for various soil type [18]](https://thumb-us.123doks.com/thumbv2/123dok_us/8761909.894423/30.612.113.542.133.327/table-soil-resistivity-various-soil-type.webp)
