Reducing seat dip attenuation
Davies, WJ and Cox, TJ
Title
Reducing seat dip attenuation
Authors
Davies, WJ and Cox, TJ
Type
Article
URL
This version is available at: http://usir.salford.ac.uk/2438/
Published Date
2000
USIR is a digital collection of the research output of the University of Salford. Where copyright
permits, full text material held in the repository is made freely available online and can be read,
downloaded and copied for noncommercial private study or research purposes. Please check the
manuscript for any further copyright restrictions.
Reducing seat dip attenuation
W. J. Davies and T. J. Cox
School of Acoustics and Electronic Engineering, Salford University, Salford M5 4WT, United Kingdom
共Received 4 January 2000; revised 1 June 2000; accepted 18 August 2000兲
Strategies for reducing seat dip attenuation in concert halls are considered. It is shown that the dip is established 4 ms after the direct sound from the stage arrives at the listener. Sound scattered from the seats and floor is the main cause of the dip. By controlling these very early reflections the attenuation can be reduced to below its subjective threshold. With this in mind, changes to the shape and impedance of the seats and floor are trialed using a boundary element model and a physical scale model. It is found that the seat dip effect can be rendered inaudible by introducing a 1-m pit under the seats. Smaller improvements are produced by changing the impedance of the seat squab. © 2000 Acoustical Society of America.关S0001-4966共00兲04511-2兴
PACS numbers: 43.55.Br, 43.55.Fw, 43.55.Ka, 43.20.Fn关JDQ兴
I. INTRODUCTION
This article is concerned with seat dip attenuation, the anomalous low-frequency attenuation suffered by sound traveling at grazing incidence over rows of seats. The effect was first reported by two teams in 1964,1,2 during an inves-tigation of the poor acoustics of the New York Philharmonic Hall. The reports communicated the alarming fact that the attenuation could be as severe as 20 dB around 150 Hz. A larger attenuation will be observed if the angle of incidence approaches closer to grazing, or the sound travels over more rows of seats; a smaller attenuation will be observed if the receiver height is increased.
Since these first papers, there have been further explo-rations of the effect and yet complete agreement on the cause of seat dip attenuation does not yet exist. The reports of Sessler and West and of Schultz and Watters concluded that the effect seemed mainly due to a vertical resonance in the gaps between the rows of seats. This frequency domain
ex-planation has been followed by Bradley3 who argued for
both vertical and horizontal resonances. However, frequency domain models do not explain every aspect of the seat dip effect. For example, the attenuation changes over time in the very early sound field.4Ishida et al.5were the first to explain seat dip effect in the time domain: many small reflections from the seats and floor produce a complicated impulse re-sponse immediately after the arrival of the direct sound from the stage. The seat dip attenuation is simply what results when this impulse response is Fourier transformed. More recent measurements have supported this idea.6
The frequency spectrum of the attenuation can be pre-dicted accurately for a given configuration of source, seats,
and receiver by a boundary element model共BEM兲.7A BEM
is computationally expensive, however, and several other prediction schemes with varying levels of performance have been reported.8–10As desktop computing power increases the BEM is now probably the preferred prediction scheme.
Until recently, all investigations of the seat dip effect had concentrated on measuring, predicting, or explaining the dip. There were conjectures on the subjective significance of such a large attenuation, but it was not known whether the measured and predicted dips could actually be perceived by
listeners. The subjective threshold of the effect has now been
reported11 to be a change of ⫺3.8⫾0.2 dB in the 200-Hz
octave band early energy, from 0 to 80 ms. Thus the attenu-ation is likely to be audible, though not a disastrous demerit, in the majority of auditoria.
Three schemes have so far been suggested for reducing the attenuation. Ando et al.8used a numerical model to show that introducing resonant absorbers into the floor between rows of seats reduced the attenuation. In a later practical trial4in a real concert hall, it was found that resonant floor absorbers did reduce the attenuation but the benefit was in-sufficient to render it inaudible for most seats. The second remedial method suggested in the literature is to introduce strong early reflections which have not grazed seating. Bradley3reported that introducing a strong overhead reflec-tion from ceiling reflectors reduced the seat dip attenuareflec-tion in a hall. However, this method may introduce tonal
colora-tions and may also reduce perceived spaciousness 共as the
proportion of lateral energy in the early field will be re-duced兲. Finally, the attenuation can be reduced and its fre-quency shifted slightly by moving the vertical angle of
inci-dence of the direct sound away from grazing.4However, the
reduction is not great, so that a very steep seating rake will be needed to produce a significant decrease in the attenua-tion. At present, therefore, there is no fully effective method of reducing seat dip attenuation available to auditorium de-signers. This article reports on a series of experiments to reduce seat dip attenuation by altering the shape and imped-ance of the seats and floor, informed by a time domain view of the effect.
II. METHOD
auditorium. The results reported are also only for unoccupied seating. There is evidence that the presence of an audience has little effect on the attenuation1,2,12of absorbent seats and so it is thought that the conclusions drawn will apply to the majority of occupied auditoria.
A. Scale model measurements
The 1:10 scale model seats used here had previously been developed to accurately represent the absorption and shape of typical unoccupied seats found in auditoria.13 Mea-surements were carried out in both a semi-anechoic chamber and a large reflection-free zone. In the latter, time gating of the impulse response was used to remove the effect of the reflections from the walls. A typical measurement arrange-ment is shown in Fig. 1. The source was a 2.5-cm tweeter and the sound field was sampled by a standard 14-in.
micro-phone. Measurements were carried out using an unmodified commercially available maximum length sequence
measure-ment system.14 All frequency responses and impulse
re-sponses have been normalized 共by deconvolution兲 to an
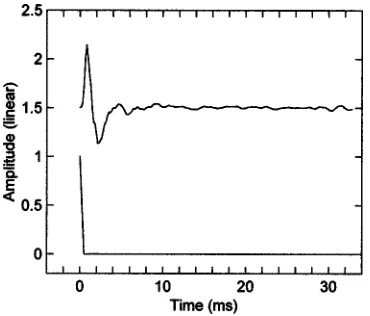
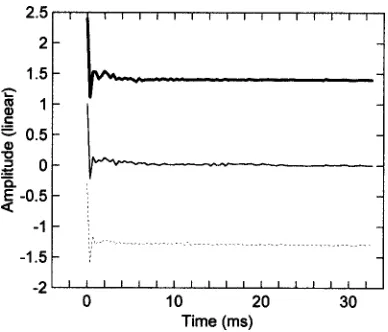
anechoic calibration of the measurement system. The anechoic response of the measuring chain is shown in Fig. 2 along with a normalized version. The normalized response is a good approximation to a pure impulse and this shows that the deconvolution introduces few errors. All the results are shown as if for a full-scale model.
B. Boundary element method
The scattering from the seats has been predicted using a
two-dimensional BEM.15 The boundary element formation
was based on the single frequency form of the Helmholtz– Kirchhoff integral equation for completely rigid surfaces. In this case the pressure P(rគ) for one point source was
冕
SP共rគs兲ⵜG共rគ,rគs兲.nគs共rគs兲dS⫹Pi共rគ,rគ0兲⫽
再
P共rគ兲, rគ苸⍀,
1
2P共rគ兲, rគ苸S,
0, rគ苸⍀0,
共1兲
where Pi(rគ,rគ0) was the sound pressure direct from the source; nគs(rគs) was the outward pointing unit vector normal
to the surface at rគs, and G(rគ,rគs) was the Green’s function. The Green’s function was the standard two-dimensional form:
G共rគ,rគs兲⫽⫺i 4关H0
共1兲共k兩rគ⫺rគ
s兩兲⫹H0共
1兲共k兩rគ⫺rគ
s
⬘
兩兲兴, 共2兲where H01(x) was the Hankel function of the first kind of order zero. The second term in Eq.共2兲was used when deal-ing with half space and creates image source effects, rគs
⬘
be-ing the location of the image source. Figure 3 shows defini-tions of the vectors used.The BEM solution technique involved first subdividing the surface into a set of elements across which the pressure
was assumed constant. For this a subdivision of /16 or
smaller was used. This small subdivision was required be-cause the interference pattern close to the seating array was delicate and sensitive to changing conditions. Once the sur-face was subdivided the calculation proceeded in two steps: first an evaluation of the surface pressures was made via simultaneous equations, then the pressures at external re-ceiver positions were calculated by a simple surface integral.
The CHIEF16was used confirm unique solutions. No
[image:3.612.85.264.32.163.2]allow-ances for corners and edges were made in the application of Eq.共1兲. Two-dimensional methods were used for the predic-tions, with a cross section through the seating array being
FIG. 1. Side elevation of geometry for measurements共insert is front
[image:3.612.343.534.32.193.2]eleva-tion兲. Dimensions in mm for 1:10 scale model.
FIG. 2. Anechoic impulse response of the scale model measurement system
共top兲and the same response normalized共bottom兲.
FIG. 3. Geometry for the Helmholtz–Kirchoff integral equation.
[image:3.612.83.268.557.715.2]defined; this vastly reduced the number of surface elements compared to three-dimensional BEMs and thus greatly de-creased calculation times.
To test the validity of the prediction method, the pres-sure above a simple array of hard seats was compared to scale model measurements. The geometry modeled is as shown in Fig. 1, except that the absorbent parts of the seats were removed. This gave a stricter test, with sharply chang-ing interference patterns close to the seats. Figure 4 shows a comparison between the experimental results and the BEM predictions. The spectrum is shown at a typical seat, where the sound had passed over eight rows of seats before reach-ing the microphone. Figure 4 shows that a very good degree of agreement had been achieved, especially considering this was a delicate interference pattern between many reflections, with the source and receiver very close to the seating array.
III. RESULTS AND DISCUSSION
A. Temporal and spectral features
The first measurements of seat dip attenuation in the literature were made using tone-bursts and single-cycle sinusoids.1,2 More recent investigations have typically used the method employed here: measure a short impulse re-sponse propagated across seating and Fourier transform it to reveal a spectrum showing a seat dip. While the dramatic attenuation due to the seat dip effect is usually arrestingly clear in the frequency spectrum, there are important clues in the time domain that point the way to a clear understanding of the effect and suggest ways of controlling it.
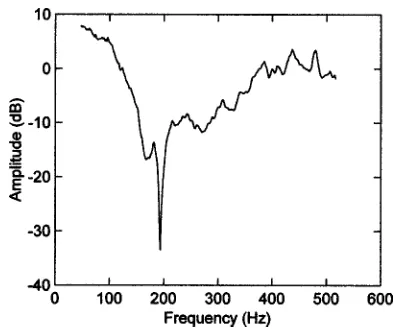
Figure 5 shows a typical seat dip spectrum. It was mea-sured using ten rows of absorbent scale model seats, as shown in Fig. 1. The microphone was in row 8, so that the spectrum in Fig. 5 is of sound passing over seven rows of seats. The size, frequency and shape of the attenuation are not untypical of those measured in auditoria. Figure 6 shows the corresponding impulse response: of particular interest are the strong reflections in the first 4 ms. There is a large nega-tive reflection immediately after the direct sound which seems to come from the top of the seat in front of the micro-phone. This is followed by three quite strong positive
reflec-tions from the seat and floor close to the microphone. Many smaller reflections arrive at the microphone after this, up to and beyond the arrival time of the first reflection from the walls or ceiling of any real auditorium. If significant amounts of sound energy arrive so early from the seats, does the seat dip attenuation also appear early? This question is answered by changing the window applied to the impulse response before using the fast Fourier transform 共FFT兲. To plot the evolution of the seat dip spectrum, one starts with a very narrow window containing only the direct sound, and calcu-lates the spectrum. The start of the window is held just be-fore the direct sound arrival, while the end is moved forward in small steps, taking a FFT at each increment. This was done to the impulse response in Fig. 6 and the results plotted as a surface in Fig. 7. What is perhaps most interesting about Fig. 7 is that the dip is established very early indeed. At 4 ms
[image:4.612.337.534.30.195.2]共full scale兲after the direct sound, the dip appears. Thereafter its frequency changes little; the attenuation changes共mainly deepens兲with the arrival of successive reflections from the seats and floor. This suggests that to control seat dip attenu-ation, one should pay the most attention to the earliest reflec-tions from the seats and floor. By changing the amplitude and/or arrival time of these reflections, it should be possible to affect the interference pattern that produces seat dip at-tenuation.
FIG. 4. Comparison of seat dip spectrum measured共light兲above a set of
[image:4.612.76.271.33.194.2]hard seats with BEM prediction共bold兲.
[image:4.612.336.536.549.713.2]FIG. 5. A typical measured seat dip spectrum共absorbent seats兲.
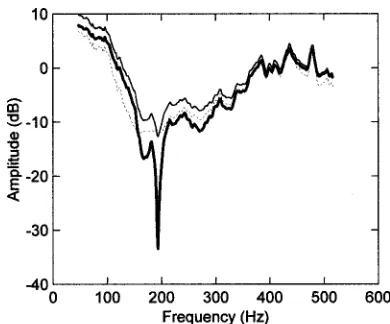
This can be simply tested in a rather crude fashion by deleting a reflection from the impulse response and viewing the resultant spectrum. In Fig. 8 this has been done, first for the initial negative reflection from the seat top, and, second, for the subsequent two reflections from the seat/floor. Figure 9 shows that, in both cases, deleting the reflections reduces the attenuation minimum by about 20 dB. The rest of the spectrum is largely unaltered. This initial success prompted attempts to control these reflections by modifying a modelled seat geometry.
B. Subjective threshold
In order to evaluate the effect of the different schemes described here, the predicted attenuation is compared with the subjective threshold. In experiments reported elsewhere, the subjective threshold for perception of seat dip attenuation
has been measured.11 The method used ten trained subjects
in a realistic simulation of a concert hall sound field. A seat dip filter was applied to several of the early reflections and this resulted in an impulse response in which the seat dip attenuation varied over time, as it does in a real hall. The attenuation of the filter could be changed to find the attenu-ation that could be just detected by half of the subjects. There are several possible ways of expressing this threshold. In Ref. 11, the energy in the impulse response in the 200-Hz
octave band from 0 to 80 ms was used. This integration time was used because it covers all the reflections attenuated and also because 80 ms is commonly used to calculate musical clarity. When expressed like this, the threshold is a change of
⫺3.8⫾0.2 dB in the 200-Hz octave band early energy, from
0 to 80 ms.
To use the subjective threshold here, however, it must be modified. The predictions and measurements reported in this article included no reverberation and no early reflections other than those from the seats and floor. The threshold must therefore be described by the attenuation of the direct sound only. Thus the integration limit was changed from 80 to 18 ms and the impulse responses from the simulated concert hall reanalyzed. This revealed that the threshold would be
⫺5.9⫾0.4 dB octave band attenuation, from 0 to 18 ms. This means that, if the direct sound in a measured impulse re-sponse shows an attenuation of greater than 5.9 dB in the 200-Hz octave band, then 50% of listeners should be able to
detect it 共though they would base their perception on the
total early sound field兲. It should be noted that the shorter integration limit has produced a larger threshold attenuation. This is because there are always several reflections in an early sound field which are not subject to seat dip attenua-tion. These arrive after the direct sound and have the effect of masking the subjective perception of the effect by increas-ing the low-frequency early energy. Thus, if one takes the impulse response at the subjective threshold, the attenuation is larger at 18 ms than it is at 80 ms.
Using the revised subjective threshold involves making an assumption about the early sound field in the concert hall one is considering: that it is similar to the early field in the simulator. As reported in Ref. 11, the simulation was de-signed to be representative of a ‘‘generic’’ good shoebox hall: values of parameters measured in it are given in that paper. Clearly, different halls have different early fields and so the relationship between the attenuation in the direct sound and the attenuation in the total early field may vary from one hall to another. For example, a hall with ceiling reflectors will tend to have a smaller attenuation in the total early field than one without. This means that hall designers should use the more general 80 ms early energy version of
[image:5.612.338.533.30.192.2]the subjective threshold where possible: the ⫺5.9-dB value
FIG. 9. The seat dip spectrum from Fig. 5共bold兲with the seat top reflection
removed共light兲and the early floor reflections removed共dashed兲.
[image:5.612.72.278.40.182.2]FIG. 7. Evolution of a typical seat dip spectrum over the period immediately after the direct sound arrives.
FIG. 8. The impulse response from Fig. 6共bold兲with the seat top reflection
removed共light兲and the early floor reflections removed共dashed兲.
[image:5.612.77.272.552.714.2]should only be used where only the direct sound is available, as here. It should also be noted that differences in the rever-berant field will have little effect on perception of seat dip attenuation.11
C. BEM predictions for modified seats
Many different geometries, some with absorbing and diffusing elements, were modeled. Figure 10 illustrates some of the basic shapes. Figure 10共a兲is the base configuration. A seat shape was adopted which allowed a realistic model of the effect of different absorbent elements on the seats. The surface impedance of each element on the seat was taken from impedance tube measurements of parts of a typical well-upholstered auditorium seat. Data was available for both the seat squab共78-mm polyurethane foam兲and backrest
共23-mm polyurethane foam兲. In the base configuration, the back of the backrest and the underside of the squab had zero admittance. In other configurations, the effects were sought of altering the admittance of different parts of the seats.
In one respect, the BEM used here is not complete. It does not model any transmission path through an absorbent seat cushion and out the other side. However, most elements of a real seat consist of absorbent cushion backed by a rigid surface, so that any transmitted levels are likely to be very low. Transmission through the seat is therefore assumed to be not significant in the total signal at the receiver.
Figure 10共b兲 illustrates one of the many geometries in-vestigated empirically to change the interference pattern by altering the timing of the seat or floor reflections. In this profile, a 1-m pit is introduced under the seats. Several other floor profiles were tried, some including diffusing and absorbing elements. Finally, Figs. 10共c兲 and 共d兲 show the underpass modifications explored.
1. Basic configuration
The magnitude and frequency of seat dip attenuation are known to vary with the number of seat rows in front of the receiver共r兲, the receiver height, and the vertical共兲and hori-zontal angles of incidence of the direct sound.2 The results reported here have a fixed source position so that r andare
increasing together. Using the standard configuration of Fig. 10共a兲 with standard admittances, the octave attenuation is less than⫺5.9 dB for values of r from 1 to 5. For r from 6 to 9 共and beyond兲 the attenuation gets steadily worse. Hence, seat dip attenuation would be audible at all rows further from
the stage than r⫽5 and remedial treatment is necessary at
these seats.
2. Floor pit
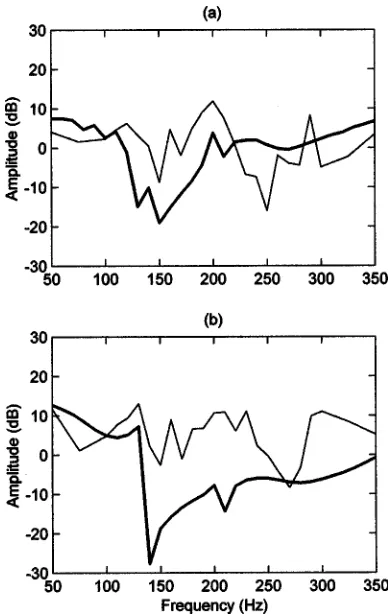
For r⬎5, the pit is the best method. Figure 11 shows
[image:6.612.339.533.31.338.2]two typical results for an empty 1-m pit. At r⫽8, the intro-duction of the pit reduces the octave attenuation from⫺11.1 dB to⫹3.1 dB. Several variants on the basic empty pit were also tried—sloped floors, diffusing lining, subdivided pits— but did not produce any significant benefit. It was found that the pit needed to be large and span many seating rows. It is envisaged that the pit could be provided by using a grid, which would be acoustically transparent at low frequencies and covered with carpeting to conceal the acoustical treat-ment. It might be possible that the pit space could be used for ventilation systems, although care would have to be taken to ensure that this would not create background noise problems. It certainly would be possible to use the space for other ser-vices such as electricity. This solution to the seat dip effect was found to be quite robust, the most important feature being the requirement for the pit to be open to many rows of seats. For example, simulation of cross beams to support seating—resulting in smaller entrances to the pits in each seating row—did not affect the decrease in the dip.
FIG. 10. Seat profiles used in BEM predictions:共a兲standard shape,共b兲with floor pit,共c兲with small underpass, and共d兲with no underpass. Dimensions in meters for full scale.
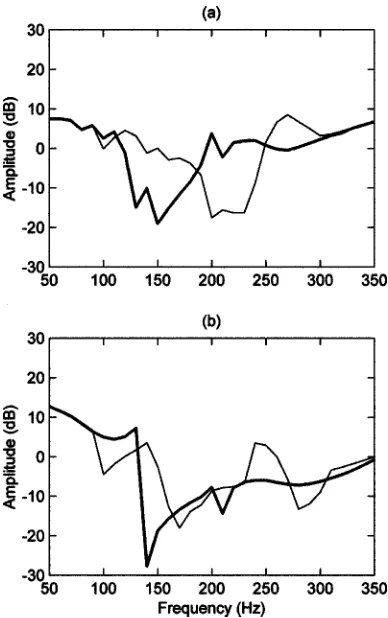
FIG. 11. Effect of floor pit on predicted spectrum at共a兲row 3 and共b兲row
[image:6.612.65.281.34.203.2]3. Changes in seat absorption
Next, attempts were made to control early reflections from the seats and floor with absorption. This was done by changing the admittance of some elements of the seat or floor to give an absorption coefficient of 1 at frequencies from 100 to 300 Hz. The most extreme absorption was used to give the best chance of seeing an effect. A real implemen-tation would be likely to have a lower absorption. Changing the underside of the seat squab from a hard surface to a resonant absorber can control sound passing through the seat underpass. This has a significant effect on the attenuation at
the receiver, as Fig. 12 shows. The audible dip at r⫽8
共⫺11.1 dB octave attenuation兲 has been moved above the
subjective threshold to ⫺4.7 dB. The reduction in
attenua-tion is more noticeable at low values of r; when the attenu-ation becomes larger, the improvement is sometimes not great enough to render the dip inaudible. It is thought that a resonant seat squab could be achieved in a real seat by drill-ing the squab underside to form Helmholtz resonators or by making the underside flexible enough to behave as a panel absorber. It is, of course, possible that doing this would in-crease the random incidence absorption in the audience area. Any increase might be small when the seats are occupied, however, because the audience would shield the resonators from the main reverberant field.
The same technique was also used to try to control the large negative reflection from the seat tops by making these highly absorbent also. As well as being much harder to achieve practically, this has little additional effect, as Fig. 12
shows. A combination of resonant squab and floor pit was also tried—this offered a slight improvement over the pit alone at some seats and none at others. The spectrum also became less flat in general. It seems likely that an audience would have an effect on the performance of the resonantly absorbing seat top. Because the improvement seen here was small, however, the effect of an audience was not pursued.
Finally, the floor under the seats was made resonantly absorbing, modeling a scheme suggested by Ando et al.8关In order that the Green’s function of Eq.共2兲could be used here, the floor absorbers were modeled as absorbent blocks placed a small distance above a hard floor.兴 The benefits of floor absorbers were less ‘‘well-behaved’’ than those of seat squab absorbers, as Fig. 13 shows. Floor absorbers help at some seats, for example at r⫽8 in Fig. 13共b兲. At other seats, how-ever, the dip is changed only in frequency, as happens at r
⫽3 in Fig. 13共a兲. These results agree only partially with Ando’s original predictions, where floor absorption is shown to reduce the dip with no other effects. The mixed results in Fig. 13 agree rather better with measured data on floor ab-sorbers in a real hall.4 It seems that if the introduction of extra absorption into the audience area is permissible, then it will have a greater beneficial effect on the seat squabs rather than on the floor. This may be because the seat squabs are closer to the point of maximum particle velocity and are therefore more effective: at 200 Hz, the quarter-wavelength will be 43 cm from the floor for normal incidence, and less for oblique incidence.
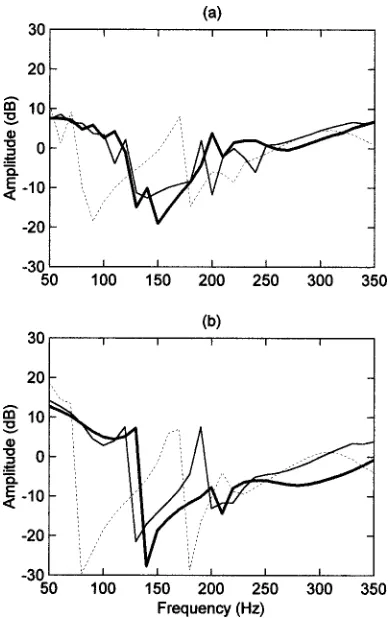
[image:7.612.340.534.31.340.2]It is interesting to compare the performance of floor ab-sorbers with that of the floor pit. When the pit is used, the FIG. 12. Effect of seat absorption on predicted spectrum at共a兲row 3 and共b兲
row 8: standard seats 共bold兲, with resonantly absorbing squab underside
[image:7.612.76.271.35.339.2]共light兲, with resonantly absorbing squab underside and seat top共dashed兲.
FIG. 13. Effect of floor absorption on predicted spectrum at共a兲row 3 and
共b兲row 8: standard seats共bold兲, with resonantly absorbing floor共light兲.
arrival of sound from the floor is altered in time and phase. When floor absorbers are introduced, the sound scattered from the floor is strongly attenuated. The floor absorbers might be seen as similar to an infinite pit. It was found em-pirically when testing the pit that 1 m was an optimum size. Larger and smaller pits did not reduce the attenuation as well, or did so less consistently. This is because the scattered sound from the floor is combined at the receiver with sound scattered from the seats. The attenuation is reduced more reliably by optimizing the way in which these different re-flections combine instead of removing just one. The only alternative would seem to be to remove all the sound scat-tered from the seats and floor to leave an anechoic direct sound, but this is less practical.
4. Seat shape
As well as altering the admittance of the seat surfaces, changes in the shape of the seats were investigated. Many profiles were investigated, though all were constrained to bear a passing resemblance to a shape that a listener could sit on! It was found, perhaps surprisingly, that the basic shape
adopted in Fig. 10共a兲 could not be improved upon. Some
profile changes made the attenuation worse, while others made little difference. Restricting the underpass as in Figs. 10共c兲 and共d兲 makes the attenuation worse at all seat posi-tions. Figure 14 shows that it is quite possible to make an inaudible dip into an audible one, though a half-underpass is much better than no underpass at all. Changing the shape of the squab underside, using several scattering profiles, had
little effect. This is mainly because considerable space is needed to introduce features which will affect the wave-lengths of interest.
D. Scale model confirmation of reduced attenuation
Once the pit method had been identified as reducing the dip, it was decided to test the arrangement in 1:10 model scale measurements. Ten rows of absorbent seats were used, with the hard floor measurements arranged as in Fig. 1. Mea-surements were also made on the same seats with a 1.1-m pit
共full scale size兲beneath them. A wire mesh and cotton sheet material were used to model the effects of grill and carpet expected in the full scale system.共The mesh and sheet were found, in fact, to have little influence on the attenuation.兲The pit was tested empty and partially filled with polyurethane foam 共to further attenuate floor reflections兲. It should be noted that the profile of the scale model seats is not identical to the BEM ones, for reasons of practical expediency, so exact agreement between results is not expected. However, the two sets of seats are expected to show the same trends.
[image:8.612.339.534.30.192.2]Figures 15 and 16 show comparisons of the sound fields with and without the pit for two typical seats. It can be seen that the dip has been significantly reduced, but has not been completely removed. At all measuring positions where the FIG. 14. Effect of seat underpass on predicted spectrum at共a兲row 3 and共b兲
row 8: full underpass 共bold兲, half underpass 共light兲, and no underpass
[image:8.612.77.272.31.340.2]共dashed兲.
FIG. 15. Effect of floor pit on measured spectrum at row 7: absorbent seats without pit共bold兲, with pit共light兲, with pit filled with foam共dashed兲.
[image:8.612.338.533.554.714.2]dip would have been subjectively significant, the pit reduced the octave band attenuation to below the threshold of percep-tion. The use of foam in the pit did not significantly improve the frequency responses; while the foam lessened the dip at some seats, it increased the dip at others. The foam does seem to deal with the comb filtering at very low frequencies, which is introduced by the pit. This extra interference effect is unlikely to be subjectively significant, though. Using foam in the pit would tend to increase the random incidence ab-sorption of the audience and so is not a favored solution.
Finally, Fig. 17 shows that the floor pit has a measurable effect on the early seat/floor reflections in the impulse sponse. Introducing foam into the pit further reduces the re-flections, as expected, but the effects in the frequency do-main are not so significant.
IV. CONCLUSION
This article has explored the options available for con-trolling seat dip attenuation in concert halls. The aim was to bring the level of the attenuation below the subjective thresh-old. Examining the effect in the time domain showed that the dip is introduced within 4 ms of the direct sound arrival by sound scattered from the seats and floor. Controlling this scattered sound gave the desired reduction in attenuation. Several changes to the profile of the seats and floor were tested using a boundary element model. The most successful change was the introduction of a pit under the seats: this consistently reduced the attenuation to below the subjective threshold. Scale model measurements were used to confirm
the size of the improvement. The next most effective method was to make the underside of the seat squab highly absorbing at the main dip frequency. Other methods, such as resonant floor absorbers, were less effective.
It is likely that no single solution to the seat dip effect will be appropriate for every auditorium. Different halls will have different constraints on the shape of the seats and floor. However, where there is scope for changes to the shape or impedance of these elements, this should be explored. Hall designers are already used to controlling the sequence of early reflections from the walls and ceiling of an auditorium. The results presented here suggest that they should also pay attention to sound arriving at the listener between the direct sound and the first major early reflection.
ACKNOWLEDGMENT
The authors are very grateful to Tim South for construct-ing the scale model and assistconstruct-ing in measurconstruct-ing it.
1G. M. Sessler and J. E. West, ‘‘Sound transmission over theater seats,’’ J.
Acoust. Soc. Am. 36, 1725–1732共1964兲.
2T. J. Schultz and B. G. Watters, ‘‘Propagation of sound across audience
seating,’’ J. Acoust. Soc. Am. 36, 885–896共1964兲.
3
J. S. Bradley, ‘‘Some further investigations of the seat dip effect,’’ J. Acoust. Soc. Am. 90, 324–333共1991兲.
4W. J. Davies and Y. W. Lam, ‘‘New attributes of seat dip attenuation,’’
Appl. Acoust. 41, 1–23共1994兲.
5
K. Ishida, K. Sugino, and I. Masuda, ‘‘On the sound reflection of the auditorium seats,’’ Proc. 13th I.C.A., Belgrade共1989兲, Vol. 2, pp. 157– 160.
6E. Mommertz, ‘‘Some measurements of the propagation of
acoustic-waves skimming over the public and seats,’’ Acustica 79, 42–52共1993兲.
7
Y. Kawai and T. Terai, ‘‘Calculation of sound fields over audience seats by using integral method,’’ Trans. ASME, J. Vib. Acoust. 113, 22–27
共1991兲.
8Y. Ando, M. Takaishi, and K. Tada, ‘‘Calculations of the sound
transmis-sion over theater seats and methods for its improvement in the low-frequency range,’’ J. Acoust. Soc. Am. 72, 443–448共1982兲.
9J. LoVetri, D. Mardare, and G. Soulodre, ‘‘Modelling of the seat dip effect
using the finite-difference time-domain method,’’ J. Acoust. Soc. Am.
100, 2204–2212共1996兲.
10
D. Takahashi, ‘‘Seat dip effect: The phenomenon and the mechanism,’’ J. Acoust. Soc. Am. 102, 1326–1334共1997兲.
11W. J. Davies, T. J. Cox, and Y. W. Lam, ‘‘Subjective perception of seat
dip attenuation,’’ Acustica 82, 784–792共1996兲.
12
J. S. Bradley, ‘‘On the effect of the audience on auditorium acoustics,’’ Proc. 15th I.C.A., Trondheim共1995兲, Vol. 2, pp. 389–392.
13W. J. Davies, ‘‘The effects of seating on the acoustics of auditoria,’’ Ph.D.
thesis, University of Salford, UK, 1992.
14D. D. Rife and J. Vanderkooy, ‘‘Transfer-function measurement with
maximum-length sequences,’’ J. Audio Eng. Soc. 37, 419–444共1987兲.
15T. Terai, ‘‘On the calculation of fields around three-dimensional objects
by integral equation methods,’’ J. Sound Vib. 69, 71–100共1980兲.
16H. A. Schenek, ‘‘Improved integral formulation for acoustic radiation
[image:9.612.78.272.31.197.2]problems,’’ J. Acoust. Soc. Am. 44, 41–58共1968兲.
FIG. 17. Effect of floor pit on measured impulse response at row 7: absor-bent seats without pit 共bold兲, with pit共light兲, with pit filled with foam
共dashed兲.