Journal of Chemical and Pharmaceutical Research, 2016, 8(8):1126-1131
Research Article
CODEN(USA) : JCPRC5
ISSN : 0975-7384
Analytical method development and validation for the estimation of Indinavir
by RP-HPLC
T. Raj Kumar, V. Rajeswari* and L. Sivasanker Reddy
Department of Pharmaceutical Analysis and Quality Assurance, Creative Educational Society’s College of Pharmacy, Kurnool, Andhra Pradesh, India
ABSTRACT
A simple, rapid, accurate, precise, specific, robust, reproducible reverse phase High Performance Liquid Chromatography method was developed for the estimation of Indinavir in bulk drug and Pharmaceutical dosage form. The quantification was carried out using BDS (250 X 4.6 mm, 5 µ) column with mobile phase comprising 0.1% OPA: acetonitrile in 45:55% v/v at flow rate 1ml/min. Detection was carried out at 258 nm using PDA detector with injection volume 10µl. The retention time was found to be 2.469 minutes. The proposed method was validated as per ICH guidelines. The method produced linear response in the concentration range of 20-100 µg/ml (R2~0.9999). The recovery studies were carried out and found to be within 98.0% - 102.0%. % RSD was found to be below 2%. LOD (Limit of Detection) and LOQ (Limit of Quantification) of Indinavir for this method were found to be 0.24µg/ml and 0.73µg/ml respectively.
Keywords: Indinavir, acetonitrile, RP-HPLC, Validation, ICH guidelines.
INTRODUCTION
Indinavir is (2S)-1-[(2S,4R)-4-benzyl-2-hydroxy-5-[[(1S,2R)-2-hydroxy-2,3-dihydro-1H-inden-1-yl]amino]-5-oxo pentyl]-N-tert-butyl-4-(pyridin-3-ylmethyl)piperazine-2-carboxamide [1]. It belongs to the class of protease inhibitor use as a component of highly active anti retro viral therapy to treat HIV/AIDS. It prevents the cleavage of the gag poly protein results in non-infectious, immature viral particles by inhibiting HIV viral protease enzyme [2]. It has a molecular formula ofC36H47N5O4 and a molecular weight 613.7895 g/mol. Its structure is given in figure No. 1. Literature survey revealed that studies had been carried out on Indinavir on RP-HPLC, LCMS/MS [3-11]. The focus of present study was to develop and validate a rapid, stable and economic RP-HPLC method for the estimation of Indinavir in bulk and its formulation. In the present study, a new RP-HPLC method was developed which shown high reproducibility and sensitivity. The developed method was validated as per ICH guidelines [12].
EXPERIMENTAL SECTION
Chemicals
Indinavir API and capsules were obtained as a gift sample from Chandra labs. The chemicals acetonitrile, OPA, were HPLC grade, Mumbai, India. Milli-Q water was used.
Instrument:
Methodology:
Preparation of 0.1% ortho phosphoric acid:
In a 100ml of volumetric flask 0.1ml of ortho phosphoric acid solution is taken and to this adds100ml of milli-Q water and then final volume was made up to 100 ml with milli-Q water.
Preparation of Mobile Phase:
An accurately measured 0.1% OPA and Acetonitrile in ratio of 45:55 % v/v were filtered through 0.45µ filter.
Preparation of Diluent:
An accurately measured 500mL of Milli-Q water and 500mL of acetonitrile in the ratio of 50:50 v/v was added, mixed well and sonicated to degas.
Preparation of Standard Solution:
40mg of Indinavir is weighed and placed into a 10 ml of volumetric flask, to this add 5 ml of diluent, For 30 minutes it is sonicated and make up the solution to 10 ml with diluents. From the above stock solution, 2.5 ml is taken in to a 10ml volumetric flask and make up the solution to final volume with diluent.1ml is taken in to a 10ml volumetric flask and make up the solution to final volume with diluent.
Analysis of Formulation:
5 Capsules of indinavir were weighed. Calculate the Average weight of each Capsule. Now transfer in to 100ml flask i.e., weight equivalent to 100mg is transferred to flask. To this add 70ml of diluent for 30 min it is sonicated, then final volume was made up with diluent. Then the above solutions was filtered and take 1ml of the filtered solution in to 10ml 0f flask and make up volume with 10ml of diluent.
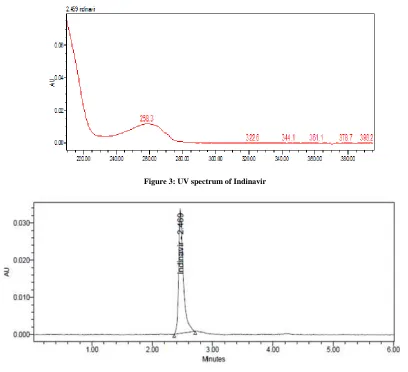
Preparation of Solution for Selection of Wavelength:
Standard solution of Indinavir was prepared and scanned in the range of 200 nm to 400 nm using a photodiode array detector. The spectrum was recorded.
RESULTS AND DISCUSSION
Validation of developed method:
Method validation as per International Conference of Harmonization is defined as “establishing documented evidence, which provides a high degree of assurance that a specific activity will consistently produce a desired result or product meeting its predetermined specifications and quality characteristics”.
System Suitability Testing:
The chromatographic conditions for the estimation of Indinavir were discussed in Table1.Indinavir standard drug solution was injected into HPLC system for six times, and checked for the system suitability parameters like theoretical plates, peak purity, tailing factor and % RSD of areas for six injections of standard Indinavir drug solution was calculated. The results were shown in the Table 2.
Blank Interference:
Blank (diluent is considered as a blank here) solution is prepared and injected into HPLC system. Any peak interference at RT (min) of Indinavir peak was checked.
Accuracy:
The accuracy of the method was determined by standard addition method. Known amount of standard drug was added to pre analyzed sample of Indinavir in according to 80%, 100% and 120% levels of labelled claim and then subjected to the proposed method. The percent recovery was calculated and results are presented in Table 3. Satisfactory recoveries ranging from 98% to 102% were obtained by the proposed method. This indicates that the proposed method was accurate.
Precision:
Linearity:
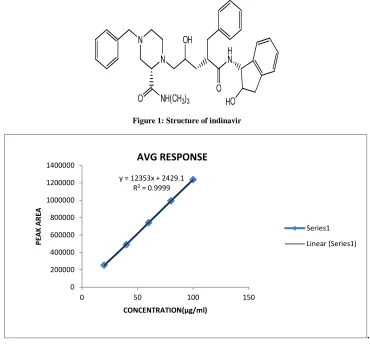
It is the ability of the method to elicit test results directly proportional to analyte concentration within a given range. Linearity was performed by preparing standard solutions of indinavir at different concentration levels 20, 40, 60, 80, 100µg/ml and the peak responses were read at 258nm and the corresponding chromatograms were recorded A linearity plot of concentration over peak areas was constructed. The results were presented in Table 6.
Limit of Detection (LOD) and Limit of Quantization (LOQ)
LOD and LOQ of the drug were calculated using the following equations according to International Conference on Harmonization (ICH) guidelines
LOD = 3.3 × σ/S
LOQ = 10 × σ/S
Where σ = the standard deviation of the response and S = the slope of the regression equation.
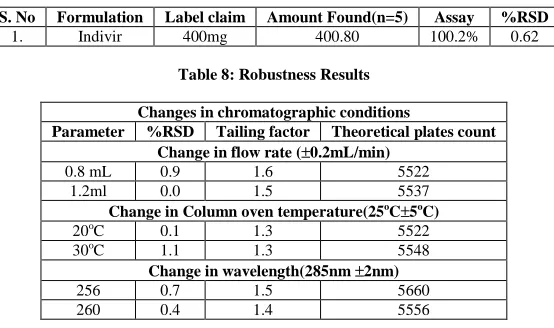
Robustness:
[image:3.595.119.489.304.653.2]Deliberate variations were made to the optimized HPLC conditions, to evaluate robustness, variations made were, flow rate varied by ±2ml/min, Column oven temperature by ±5oC, wave length varied by ±2nm.The results were presented in Table 8.
Figure 1: Structure of indinavir
.
Figure 2: Linearity Curve of Indinavir y = 12353x + 2429.1
R² = 0.9999
0 200000 400000 600000 800000 1000000 1200000 1400000
0 50 100 150
P
E
A
K
A
R
E
A
CONCENTRATION(µg/ml)
Series1
Figure 3: UV spectrum of Indinavir
Figure 4: Chromatogram of Indinavir Standard Preparation
Table 1: Optimized chromatographic conditions
S.No Chromatographic Parameters Chromatographic Conditions
1. Column BDS(250×4.6mm, 5µ) 2. Column Oven Temperature 25oc
3. Sample Compartment Temperature 25oc
5. Mobile phase Composition 0.1%OPA: ACN (45:55v/v) 6. Flow rate 1.0 ml/min 7. Injection volume 10µl 8. Run Time 8 minutes
9. Wavelength 258nm
10. Retention Time 2.469
Table 2: System Suitability Testing Parameters Results
S.No System suitability Parameters Results Acceptance Criteria
1. Tailing factor 1.4 NMT 2.0% 2. Theoretical plates 5151 NLT 2000 3. % RSD of areas for five injections of Standard Solution. 0.74 NMT 2.0%
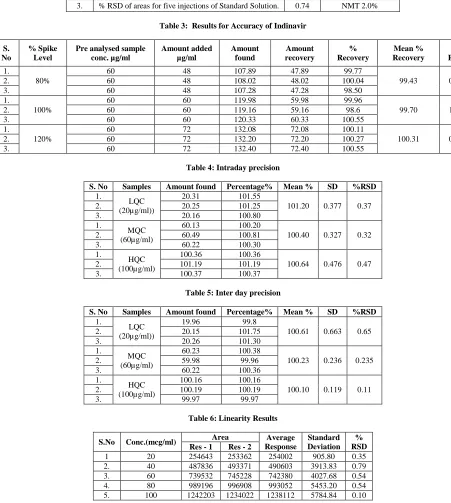
Table 3: Results for Accuracy of Indinavir
S. No
% Spike Level
Pre analysed sample conc. µg/ml Amount added µg/ml Amount found Amount recovery % Recovery Mean % Recovery % RSD 1. 80%
60 48 107.89 47.89 99.77
99.43 0.81
2. 60 48 108.02 48.02 100.04
3. 60 48 107.28 47.28 98.50
1.
100%
60 60 119.98 59.98 99.96
99.70 1.00
2. 60 60 119.16 59.16 98.6
3. 60 60 120.33 60.33 100.55
1.
120%
60 72 132.08 72.08 100.11
100.31 0.22
2. 60 72 132.20 72.20 100.27
[image:5.595.73.524.245.748.2]3. 60 72 132.40 72.40 100.55
Table 4: Intraday precision
S. No Samples Amount found Percentage% Mean % SD %RSD
1.
LQC (20µg/ml))
20.31 101.55
101.20 0.377 0.37 2. 20.25 101.25
3. 20.16 100.80 1.
MQC (60µg/ml)
60.13 100.20
100.40 0.327 0.32 2. 60.49 100.81
3. 60.22 100.30 1.
HQC (100µg/ml)
100.36 100.36
100.64 0.476 0.47 2. 101.19 101.19
3. 100.37 100.37
Table 5: Inter day precision
S. No Samples Amount found Percentage% Mean % SD %RSD
1.
LQC (20µg/ml))
19.96 99.8
100.61 0.663 0.65 2. 20.15 101.75
3. 20.26 101.30 1.
MQC (60µg/ml)
60.23 100.38
100.23 0.236 0.235
2. 59.98 99.96
3. 60.22 100.36 1.
HQC (100µg/ml)
100.16 100.16
100.10 0.119 0.11 2. 100.19 100.19
3. 99.97 99.97
Table 6: Linearity Results
S.No Conc.(mcg/ml) Area Average Response
Standard Deviation
% RSD Res - 1 Res - 2
Table 7: Assay of Formulation
S. No Formulation Label claim Amount Found(n=5) Assay %RSD
[image:6.595.169.446.87.251.2]1. Indivir 400mg 400.80 100.2% 0.62
Table 8: Robustness Results
Changes in chromatographic conditions
Parameter %RSD Tailing factor Theoretical plates count Change in flow rate (±0.2mL/min)
0.8 mL 0.9 1.6 5522 1.2ml 0.0 1.5 5537
Change in Column oven temperature(25oC±5oC)
20oC 0.1 1.3 5522
30oC 1.1 1.3 5548
Change in wavelength(285nm ±2nm)
256 0.7 1.5 5660 260 0.4 1.4 5556
Acknowledgement
The authors are sincerely thankful to the management of C.E.S College of Pharmacy, Chinnatekur, Kurnool, and Andhra Pradesh, India for providing the facilities to carry out this research work.
REFERENCES
[1] F Liu ; PI Boross; YF Wang; Tozser J; Louis JM; Harrison RW; Weber IT, Journal of Molecular Biology.,
2005, 354 (4),789–800.
[2] SS Shankar ; MP Dube ; JC Gorski; JE Klaunig; HO Steinberg ,Am Heart J., 2005, 150(5), 933.
[3] P Sunitha; S Priyanka; T Supriya, International journal of chemical and pharmaceutical analysis., 2015, 2(2), 108-110.
[4] T Malavika; N Kartheek; A Ashok Kumar, Int J Pharm Sci., 2015, 7 (2), 343-346.
[5] K Rajitha; N Lakshmi Prasanna; R Naveen; CH Ranjith; A Ashok Kumar, Int J Pharm Sci., 2014, 6(8), 46-49. [6] Davis Pereira de Santana; Talitamota Goncalves, Revista Brasileria de Ciencias Farmaceutica., 2007, 43 (4), 258-262.
[7] Poirier; Jean-Marie; Robidou; Pascal, Therapeutic Drug Monitoring., 2005, 27 (2), 186-192.
[8] J. A. H Droste; Verweij-van Wissen; C.P. Burger, Therapeutic Drug Monitoring., 2003, 25(3), 393-399.
[9] M Sarasa-Nacenta;Joseph Mallolas, Journal of Chromatography Biomedical Sciences and Applications., 2001, 757(2), 325–332.
[10] Bouley; Martine Briere; Corinne; Padoin; Christophe, Therapeutic Drug Monitoring., 2001, 23(1), 56-60. [11] R.P.G van Heeswijk; R.M.W Hotelman’s; R Harms, Journal of Pharmaceutical analysis and Quality control., 1998, 71(5), 159–168.