Journal of Chemical and Pharmaceutical Research, 2014, 6(7):1383-1389
Research Article
CODEN(USA) : JCPRC5
ISSN : 0975-7384
The application research of ARMA forecasting model in prediction
of medals and ranking for 2016 Olympic Games
Shibiao Dong
School of Physical Education, Xuchang University, Xuchang, Henan, China
_____________________________________________________________________________________________
ABSTRACT
The medal number and ranking of previous Olympic Game is the focus of people’s attention. By studying the time series method, this paper applies it in predicting the number of medals. It respectively predicts the medal numbers of China, the U.S. and Russia, arrives at the medal number and ranking of China in the 2016 Olympic, obtains that China will respectively win 40 gold medals, 25 silver medals and 27 bronze medals with a total of 92 medals at the 2016 Olympic Games by using the weighted moving average method, uses autoregressive( )AR model, moving
average( )AM model and autoregressive average ARMA model to respectively predict the medal condition of American and Russian in the 2016 Olympics, uses SAS software to test the stationary of the data, tests the autocorrelation coefficient model, and ultimately determines the predicted and estimated value. It is predicted that U.S. will get 44 gold medals, 36 silver medals and 23 bronze medals, a total of 103 medals; Russia will get 32 gold medals, 36 silver medals and 23 bronze medals, a total of 91 medals; thus China will be the second.
Key words: Medals amount, time series analysis, autoregressive model, ARMA prediction model, Olympic Games _____________________________________________________________________________________________
INTRODUCTION
The first modern Olympic Games in 1896 were organized in Athens by the Greek. Olympic takes solidarity, peace and friendship as the purpose for a long time [1-3]. The Olympic Games is the competition opportunity to show the comprehensive strength of the nation, it represents not only the sport development of a nation, but also represents the condition in all aspects of a country’s humanistic quality, political system, economic development and social harmony [4-6]. The performance of a country at the Olympics directly depends on the number of Olympic medals. Olympic medal not only represents the sports competition ability of individual, but also bears people’s love for sports, and anticipation of the masses [7-9]. The number of medals directly reflects whether a country’s sports, economy, policy is advanced or not. China’s performance at the Olympics is more prominent, which is a miniature of the rapid development after China's reform and opening up [10-12]. Especially in the 2008 Beijing Olympics, China ranked first in the world with the advantage of 51 gold medals; which effectively promotes the development of sports undertakings in China at the same time fulfills China’s Olympic dream, but also shows the Chinese powerful comprehensive national strength and the humanistic quality to the world [13].
of the three countries have their own characteristics. For the different characteristics of nine data sets, this article uses different methods of time series to predict, which is more targeted and more accurate.
THE APPLICATION AND RESULTS ANALYSIS OF ARMA FORECASTING MODEL IN THE OLYMPICS PERFORMANCE PREDICTION
Weighted moving average method
Suppose the time sequence is
y
1,
y
2,
L
,
y
t,
L
; the weighted moving average formula:N N t N t
t tw
w
w
w
y
w
y
w
y
w
M
+
+
+
+
+
+
=
− − +L
L
2 1
1 1
2 1
,
t
≥
N
(1)In the formula
M
twis at
period weighted moving average value;w
iis the weight ofy
t−i+1. The predictionformula:
tw
t
M
y
ˆ
+1=
(2) [image:2.595.126.487.323.455.2]That is to take the
t
period weighted moving average value as the predictive value of thet
+
1
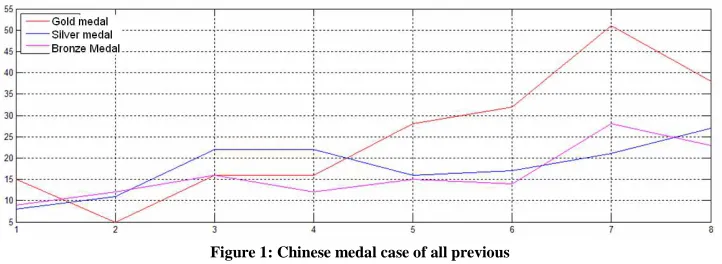
period.Figure 1: Chinese medal case of all previous
[image:2.595.84.523.513.697.2]Figure 1 shows that the 2008Olympic Game was organized in China, the number of medals obtained is obvious abnormal, so round the Chinese medal data in 2008.
Table 1: The medal ranking of China’s Olympic Games and the weighted moving average predicted value table
Years 1984 1988 1992 1996 2000 2004 2012
t 1 2 3 4 5 6 7
Gold 15 5 16 16 28 32 38
The weighted moving average predicted value of three years 16.1667 27.1667 31 32
Relative error (%) 0.01042 0.0298 0.03125 0.1579
Silver 8 11 22 22 16 17 27
16 20.1667 19 17.5
Relative error (%) 0.2727 0.2204 0.1176 0.3519
Copper 9 12 16 12 15 14 23
8.5 10 12.5 20
Relative error (%) 0.2917 0.3333 0.1071 0.3913
The total number of medals 33 30 57 54 64 69 96 44 61 69.5 91
Relative error (%) 0.1252 0.0341 0.0026 0.0179
Takew1=3, w2=2, w3=1, the prediction formula is: 3 2 1
2 2
ˆ 1 2
1 + +
+ +
= − −
+
y t t t
y y y y
According to the above equation, after the weighted average, the results of the calculated prediction value are shown in Table 1. The predictive value for the number of China winning the 2016 Olympic gold medal is (number):
3333 . 34 6
28 32 2 38 3
As the overall trend tends to rise, the predicted values lag. It is necessary to correct the predictive value, the method is: first calculate the relative error of the predicted value and the actual value of each session, such as the 1996
session: % 042 . 1 16 1667 . 16 16 = −
The relative error is shown in Table 1, and then calculates the total average error 0.932749122.
% 725 . 6 % 100 114 3334 . 106 1 % 100 ˆ
1 × =
− = × −
∑
∑
t t y yFrom the above the average of the total predicted value is lower than the actual value33.04%, thus the predicted value
in 2016 can be corrected as:
8084 . 39 % 725 . 6 1 333 . 34 = −
Similarly draw the number of silver and bronze, and fill it in Table 1. In the 2016 session it is predicted that China will win 40 gold medals, 25 silver medals, 27 bronze medals, totally 92 medals.
Stochastic time series models: (1) The auto-regression
( )
AR model;(2) The moving average
( )
AM model;(3) The auto-regressive moving average
(
ARMA model;)
Introduce backward operator B and difference operator
∇
:B
X
=
X
−,
B
C
=
C
,
k
=
0
,
1
,
L
;
kk n n k
C
is a constant. And denote it as:)
1
(
)
(
1 2 2 p pp
B
φ
B
φ
B
φ
B
φ
=
−
−
−
L
−
(3)First order difference:
1
−
−
=
∇
X
nX
nX
n (4)Sequence
AR
( )
p
: suppose{
Xt,t=0,±1,±2,L}
is a zero mean stationary series, which meets the following:t p t n t t
t
X
X
X
X
=
φ
1 −1+
φ
2 −2+
L
+
φ
−+
ε
(5)Parameter
ε
t is the stationary white noise with zero mean and2
ε
σ
variance. ThenX
tis the auto-regressionsequence of order
p
, which is denoted asAR
( )
p
sequence, whereas:(
)
Tp
φ
φ
φ
φ
=
1,
2,
L
,
(6)It is more convenient to describe the formula after the introduction of backward shift operator. Operator
B
is defined as follows:k t t k t
t
X
B
X
X
BX
≡
−1,
≡
−(7)
Computing sub-polynomial:
( )
pp
B
B
B
B
φ
φ
φ
The formula (8) can be rewritten as:
( )
B
X
tε
tφ
=
(9)Polynomial equation
φ
( )
λ
=
0
is called the characteristic equation ofAR
( )
p
model. The test of the model: itsp
rootsλ
1,
λ
2,
L
,
λ
p are called eigenvalues of the model. Eigenvalue may be real, and also could be plural. According to the conditions, if the eigenvaluesp
are outside the unit circle, namely:p
i
i
>
1
,
=
1
,
2
,
L
,
λ
(10)
Model
AR
( )
p
is called stable or stationary. The above formula is called the stable condition.SequenceMA
( )
q : suppose{
Xt,t=0,±1,±2,L}
is the zero mean stationary series, which meets the following model:q t q t
t t t
X
=
ε
−
θ
1ε
−1−
θ
2ε
−2−
L
−
θ
ε
−(11)
Parameter
ε
t is the stationary white noise with zero mean and2
ε
σ
variance, which is denoted as sequenceMA( )
p , whereas:(
)
Tq
θ
θ
θ
θ
=
1,
2,
L
,
(12)It is called the moving average parameter vector, whose components
θ
j,
j
=
1
,
2
,
L
,
q
is called average sliding coefficient. For the linear backward shift operatorB
, we have:k t t k t
t
B
B
ε
=
ε
−1,
ε
=
ε
− (13)Re-introduce the operator polynomials:
( )
qq
B
B
B
B
θ
θ
θ
θ
=
1
−
1−
2 2−
L
−
(14)The formula (14) can be written as:
( )
tt
B
X
=
θ
ε
(15)
Polynomial equation
θ
( )
λ
=
0
is called the characteristic equation ofMA
( )
q
models; itsq
roots are called the eigenvalue ofMA
( )
q
.The model test: If the eigenvalue of
MA
( )
q
are outside of the unit circle, then theMA
( )
q
model is reversible.Sequence
ARMA
( )
p
,
q
: the definition ofε
n ,φ
p( )
B
andθ
q( )
B
is the same with that of above, the widestationary sequence
X
n meets:EX
n=
0
,
X
t−
φ
1X
t−1−
L
−
φ
pX
t−p=
ε
t−
θ
1ε
t−1−
L
−
θ
qε
t−qThen
X
n Is called autoregressive moving average model of order( )
p,
q
, which is referred to as)
,
(
p
q
ARMA
can be written in the form of operators:n q n
p
B
X
θ
B
ε
φ
(
)
=
(
)
(16)
For
ARMA
(
p
,
q
)
model, we always assumeφ
p(B
)
andθ
q(B
)
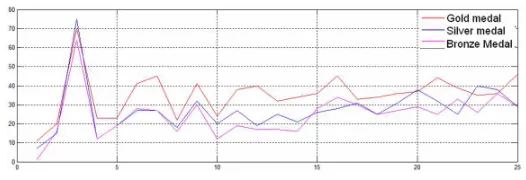
(as a polynomial of the variable B) have no common factor, and respectively satisfy stationary conditions and reversible condition. [image:5.595.172.435.200.290.2]Predict the gold medal number of U.S. in 2016 Olympic Game, as shown in Figure 2.
Figure 2: The U.S.’s medal condition of all previous
Use SAS software for data processing, and test stationary of the data:
Autocorrelations
Lag Covariance Correlation -1 9 8 7 6 5 4 3 2 1 0 1 2 3 4 5 6 7 8 9 1 Std Error 0 6.478225 1.00000 | |********************| 0 1 4.942171 0.76289 | |*************** | 0.277350 2 2.423277 0.37407 | . |******* . | 0.407997 3 0.353969 0.05464 | . |* . | 0.433576
The calculation results of autocorrelation coefficients are given, it can be seen that with the increasing of delay deployment, the autocorrelation coefficients shows a declining trend. Autocorrelation coefficient of the sequence quickly reduces to 0; it is known that the sequence is the stationary time series. As can be seen from the table the autocorrelation P is 1.
Conduct correlation analysis and partial correlation analysis of the data to determine the model order:
Partial Autocorrelations
Lag Correlation -1 9 8 7 6 5 4 3 2 1 0 1 2 3 4 5 6 7 8 9 1 1 0.76289 | |*************** | 2 -0.49745 | | . | 3 0.02166 | | . |
The calculation results of partial correlation coefficient are given, wherein the first column is the delayed deployment, the second column is the partial correlation coefficient, the third column uses an asterisk to express the partial correlation coefficients. It can be seen that after one step delay, the partial correlation coefficients are all between twice of the standard errors. And the value of correlation coefficient is much smaller. So we can say that the model ends after the one step delay.
Through the above analysis it can be considered that the hypothetical model is applicable. According to the identified order, estimate the coefficients that the model establishes. It uses the estimate statement to establish a first-order autoregressive model, first-order moving regression model, as well as a first-order autoregressive moving
averageARMA
( )
1,1 model.Model test:
The model that can make the function minimum is considered to be the best model. For criterion SBC, the smaller the better SBC is. By judging AIC and SBC, the third model is much better.
AR(1) MA(1) ARMA(1, 1)
AIC 53.71279 51.77924 48.82854
SBC 54.84269 52.90913 50.52339
Significant test:
Conditional Least Squares Estimation
Standard Approx Parameter Estimate Error t Value Pr > |t| Lag MU 69.33704 0.81936 84.62 <.0001 0 MA1, 1 -1.00000 0.28198 -3.55 0.0053 1 AR1, 1 0.65025 0.26055 2.50 0.0317 1
The value of P is less than 0.05, which meets the test requirements.
It is derived from SAS software that the development function of the gold medal that United States won is:
75
.
20
855
.
3
2985
.
0
007219
.
0
ˆ
=
x
3−
x
2+
x
+
y
It is obtained that U.S. in the 2016 Olympic Game will win 44 gold medals, based on this model the number of silver medal is 36, the number of bronze medal is 23, a total of 103 medals.
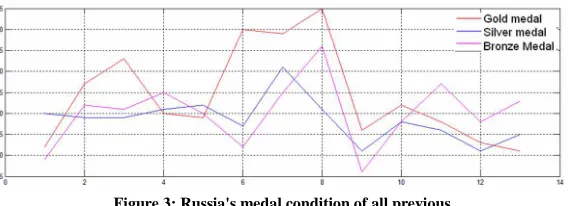
[image:6.595.165.449.381.484.2]Predict the number of gold medals for Russia at the 2016 Olympic Games, as shown in Figure 3.
Figure 3: Russia's medal condition of all previous
The method is the same with the prediction of the number of gold medals the United States, it is calculated that p is 1 and q is 1. The model checking is the same with the above model:
AR(1) MA(1) ARMA(1, 1)
AIC 63.88356 69.2892 64.03058
SBC 64.67935 70.08499 65.22426
By combining the value of AIC and SBC, it draws an optimal significant test of model one: Conditional Least Squares Estimation
Standard Approx Parameter Estimate Error t Value Pr > |t| Lag MU 85.35841 4.06892 20.98 <.0001 0 AR1, 1 1.00000 0.18187 5.50 0.0004 1
Value P is less than 0.05 and meets the test requirements.
It is derived from SAS software that the development function of the gold medal that the Russian won is:
8 . 15 688 . 9 9725 . 0 01865 . 0
ˆ= 3− 2+ +
x x
x y
CONCLUSION
Time series model is the common solution to solve the prediction problem that has a clear chronological order. In the previous Olympic Games, the strengths of China, the U.S. and Russia are nearly the same, which are all in the world top level. Aiming at the quantity of gold silver and bronze medals that the three countries got in the previous Olympic Games, according to the different characteristics of nine sets of data, this paper respectively selects the
auto-regression
( )
AR model, moving average( )
AM model, autoregressive average ARMA model to conduct prediction, obtains the number of Olympic medals obtained in 2016, and derives the ranking. Thus each set of the data is more targeted, and the results are more accurate. Time series model can be widely used to chronological prediction problems, in addition to sports medal predictions; it also can be used for a variety of data forecasting problems, such as population prediction.REFERENCES
[1]TU Chun-jing, DU He-ping, WANG-Wei. Journal of Jinggangshan University, 2011, 32(2). [2] WU Xin. Sports Culture Guide, 2011, (5).
[3] ZHANG Zheng-min. Journal of Physical Education, 2011, 18(4), 111-114.
[4] LIN Dehua. Journal of Capital College of Physical Education, 2011, 23(6), 540-542,549. [5] HE Jiang-hai. Journal of Wuhan Institute of Physical Education, 2007, 41(6), 63-65. [6] JIANG Yi-peng. Journal of Tianjin Institute of Physical Education, 2004, 19(2), 86-87 [7]WU Xi-lin,LI Jian-chen. Journal of Wuhan Institute of Physical Education, 2005, 39(6), 47-51.
[8]WANG Guo-fan, ZHAO Wu, LIU Xu-jun, FENG Shu-hui, XUE Er-jian, CHEN Lin, WANG Bo. China Sport Science and Technology, 2011, 47(1).
[9]FAN Wen jie, ZHOU Ai jie, LIU Jian min. Journal of Beijing Sport University, 2002, 25(6), 847-849. [10] Xiaomin Zhang. Journal of Chemical and Pharmaceutical Research, 2013, 5(12), 8-14.
[11] Wang Bo; Zhao Yulin. Journal of Chemical and Pharmaceutical Research, 2013, 5(12), 21-26. [12] Mingming Guo. Journal of Chemical and Pharmaceutical Research, 2013, 5(12), 64-69.