76:1 (2015) 207–220 | www.jurnalteknologi.utm.my | eISSN 2180–3722 |
Jurnal
Teknologi
Full Paper
G
RAPHICAL
U
SER
I
NTERFACE FOR
A
SSESSING
S
USTAINABILITY BY
U
SING
F
UZZY
L
OGIC
:
A
C
ASE
S
TUDY ON
H
OLLOW
F
IBER
M
EMBRANE
M
ODULE
Salwa Mahmood
a*, Abdul Rahman Hemdi
b, Muhamad Zameri
Mat Saman
a, Noordin Mohd Yusof
aa
Faculty of Mechanical Engineering, Universiti Teknologi
Malaysia, 81310 UTM Johor Bahru, Johor, Malaysia
b
Faculty of Mechanical Engineering, Universiti Teknologi Mara,
13500 Permatang Pauh, Pulau Pinang, Malaysia
Article history
Received
21 January 2015
Received in revised form
24 March 2015
Accepted
1 August 2015
*Corresponding author
[email protected]
Graphical abstract
Abstract
An important consideration during product development is the sustainability level of a product. Thus, several tools and methods have been developed to assess product sustainability. However, most of current tools focus only on the environmental element without considering two important sustainability elements such economic and social elements. Other tools are limited to the cradle-to-gate system boundary, which covers two phases of the product life cycle from raw material extraction to the end of the manufacturing stage. Users need to understand the mathematical calculations and tools needed to achieve this purpose. Hence, this paper developed a comprehensive method for assessing the sustainability of product development considering all sustainability elements from cradle-to-grave. A graphical user interface (GUI) was developed for ease of use from the structured methodology. The developed GUI was embedded with the fuzzy logic calculation under the Matlab GUI platform with codes and callback functions by using fuzzy linguistics. The GUI presented is a user friendly assessment since users no need to understand the mathematical equation embedded. A product was selected as a case study to demonstrate the use of the GUI. The sustainability level of a product can be monitored via the GUI to enable further product sustainability improvement.
Keywords: Graphical user interface, artificial intelligence, sustainability assessment, fuzzy logic, hollow fiber membrane
Abstrak
untuk demonstrasi penggunaan GUI ini. Daripada penggunaan GUI ini, tahap kemampanan boleh dipantau bagi menjana peningkatan tahap kemampanan sesebuah produk.
Kata kunci: Graphical user interface, artificial intelligence, penilaian kemampanan, fuzzy logic, membran berongga
© 2015 Penerbit UTM Press. All rights reserved
1.0 INTRODUCTION
Sustainability assessment has become an important indicator for the level of sustainability of a product. Over the years, research on sustainability assessment has grown rapidly both at the national and international levels. The purpose of sustainability assessment is to evaluate the product and assist decision makers to form decisions for a sustainable society [1]. Sustainability assessment is related closely with the methodology for identifying sustainability parameters on the basis of sustainability context and coverage. The proper identification of sustainability parameters is necessary to evaluate the product performance and monitor improvements at three levels, namely, environmental, economic, and social.
Sustainability assessment involves the evaluation of quantitative and qualitative data. For quantitative evaluation, the determined parameter becomes the main feature and serves as an important indicator of life cycle performance. Quantitative data will be collected for the next evaluation process. On the other hand, qualitative indexes depend heavily on the knowledge and experience of field experts. Therefore, the parameters involved are frequently indicated as subjective perspective and interpretation. The qualitative evaluation concept may differ with another assessment because it involves human
interpretation, knowledge, and experiences [2, 3]. Several examples of tools for sustainability assessments have been developed. However, some of these tools focus only on several sustainability dimensions. Several tools do not consider the balance between all sustainability elements involved. Furthermore, several tools have limited system boundary. This paper presents a graphical user interface (GUI) for assessing sustainability by the fuzzy logic approach via Matlab. The GUI provides application guidelines and a case study for methodology validation. Life cycle assessment (LCA) was applied to determine the parameters at every phase of the product lifecycle for the case study on hollow fiber membrane module [4].
User interface design has become an important tool for expert systems for the past 10 years. The user interface of an expert system is usually introduced in a complicated or fuzzy real application [5]. Several examples of tools developed by using different calculation methods can be found in literature. The developed tools varied depending on the case study selected. Table 1 provides a summary of the various published assessment methods. However, several tools had vague details on their guidelines, whereas some tools were unsuitable for application to other case studies.
[image:2.612.78.537.501.740.2]
Table 1 Summary of sustainability assessment web-tool developed
Author/s Sustainability assessment web-tool developed
[6] This study developed multi-criteria decision analysis (MCDA) methodology software for determining product end-of-life (EOL) treatment options. EOL options that need to be chosen include reuse, remanufacture, recycling, incinerated, landfill, or special handling. This study focused on the EOL product lifecycle stage to reduce environmental impact by using MCDA and analytic hierarchy process (AHP), which is a software used to determine product EOL option on the basis of Visual Basic software and aid in the decision-making process. [7] This study proposed a new approach for applying the Product Sustainability Index (ProdSI) to
select the best possible configuration design. The use of ProdSI can enable the improvement of the initial product design and increase the sustainable options before the selection of the final design. An armchair was selected as a case study to illustrate the proposed approach. This study focused on the initial design phase for product design. However, the software for this method is still in the development phase.
[8] This study presented a GUI for assessing sustainability by using Matlab–fuzzy software to alleviate the mathematical operation in fuzzy logic. This study presented the three dimensions for sustainability: environmental, economic, and social elements. This GUI also considered the cradle-to-gate system boundary. An automotive component case study was selected to validate the developed GUI.
Author/s Sustainability assessment web-tool developed
[10] This study presented a software tool that applies a scoring system to guide the most efficient solutions for responsible authorities. The data inputs need to be collected and the outcome is the ranking of alternative scenarios that need to be selected. This software was developed specifically for the urban wastewater treatment process.
[11] This study developed a systematic approach for decision analysis by using Java and AHP. The software applied the AHP methodology for MCDA. This software was deployed on the World Wide Web and can be accessed globally. This program focused on natural resources and environmental management.
[12] This study developed a computer simulation model for sustainability and applied the Visual Basic software for the simulation. The model focused on environmental and social elements related to human population growth, pollution, waste treatment, and ozone levels.
2.0 GUI METHODOLOGY
A fabrication product-related assessment tool was created by developing a GUI that evaluated the resources consumed and the potential environmental impact during the product chain in the product life cycle. To balance sustainability, the developed GUI integrates three pillar of sustainability, considering three dimensions or element of environmental, social and economical. For environmental aspect, the potential environmental impacts should be reduced, the price should be optimized for economical aspects while reduce fatalities and improve the human health, safety and ergonomic for social aspect. All three aspects were considered from the cradle to the grave, and accounts for the raw material extraction, fabrication, transportation, usage, and EOL phases. Four potential environmental impacts were considered for the environmental element (global warming
potential (GWP), acidification potential (AP),
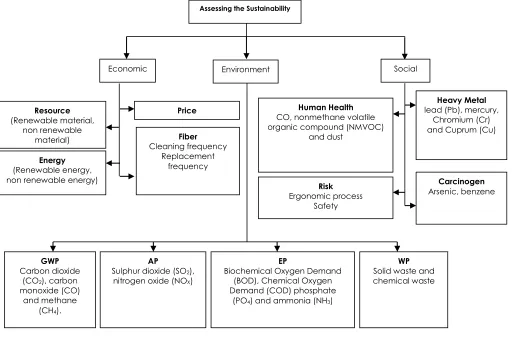
euthrophication potential (EP), and waste potential (WP)). Four potential impacts on the economic element, including material potential, energy potential, price potential, and maintenance potential, were also considered. In terms of the social element, four impacts were considered human health potential, heavy metal potentail, carcinogen potential, and risk potential. Figure 1 shows the potential impacts considered with the parameter determination by [13] whereas Table 2 shows the fuzzy sustainability of the GUI evaluation for the diagram definition, including inputs, processing, and outputs for GUI development. Expert opinions were used to validate the selected parameters before developing the GUI by using Matlab [14].
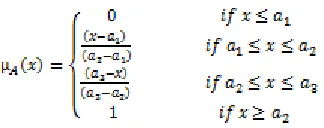
Fuzzy logic was applied in the development of the GUI to assess product sustainability. Fuzzy logic was used in instances of uncertain and incomplete relationships among parameters [15]. A fuzzy inference system (FIS) refers to the process of formulating the mapping from a given input to an output by using a fuzzy logic process. The FIS was applied in this GUI. The fuzzy logic process consists all of membership functions, logical operation, and fuzzy rules. The output from the developed GUI developed will be determined in terms of the sustainability index. The index value range is from zero to one by Eq. (1). “Zero”
indicates the lowest sustainability level of product, whereas “one” indicates the highest sustainability level [16]. The framework developed can be applied for another product lifecycle. However, this paper focused on the product lifecycle of a hollow fiber
membrane (Mahmood et al., 2014).
(1)
where A = (a1, a2, a3), a1 = minimum value, a3 =
maximum value, and a2 = (a1 + a3)/2 for the symmetric triangle.
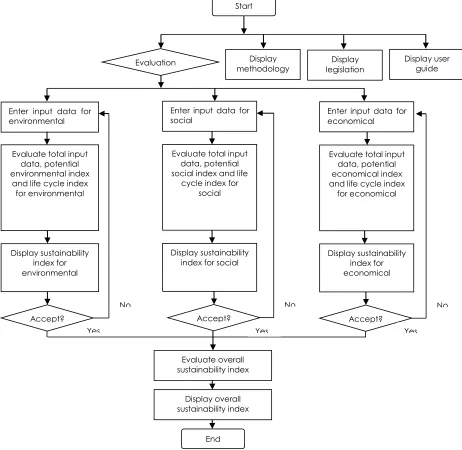
Figure 2 shows the general flow chart of the GUI when used to assess sustainability. The flow chart describes the evaluation process of the developed GUI in assessing three elements of sustainability. During the evaluation, users need to enter the parameter input data for each sustainability element. After data have been entered, the total input data, potential
sustainability index I, and lifecycle index for each
element will be evaluated. Hence, the sustainability index for each element will be displayed for users. Users can also view the methodology, legislation, and user guide to aid in further understanding the methodology developed, legislation requirements, and user guidance.
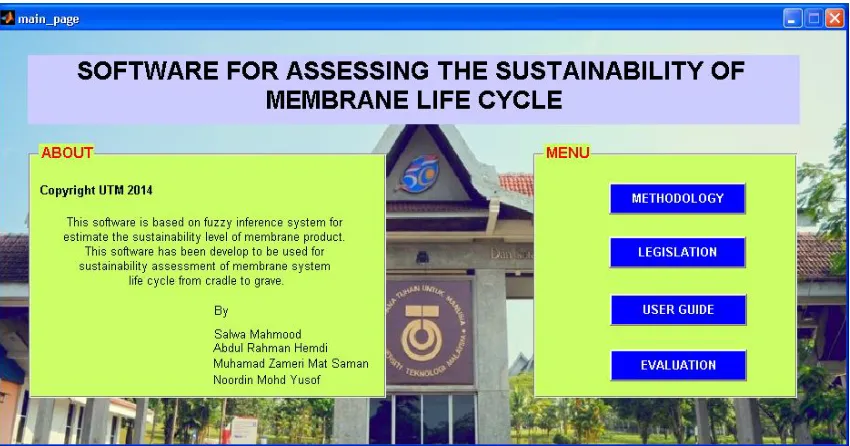
Figure 3 shows the main menu of the GUI. At the main page, users can select options before starting the evaluation. Four pushbuttons were developed, including METHODOLOGY, LEGISLATION, USER GUIDE, and EVALUATION. The METHODOLOGY pushbutton allows users to understand the methodology developed according to parameters involved. The LEGISLATION pushbutton is used to provide information regarding the legislation requirement on sustainability issues. The USER GUIDE pushbutton explains the steps for using the proposed GUI. Finally, the EVALUATION pushbutton will proceed to the sustainability assessment page and will initiate the environmental,
social, economic, and overall sustainability
[image:3.612.318.480.281.345.2]Figure 1 Potential impacts considered with parameter determination
Table 2 Input, processing and outputs of GUI
Inputs Parameters/ potential impacts considered
1. Environmental aspect
-CO2, CO and CH4
-SO2 and NOX
-BOD, COD, PO4 and NH3
-Solid waste and Chemical waste
2. Social aspect
-CO, NMVOC and dust -Pb, Hg, Cr and Cu -Arsenic and Benzene
-Ergonomic process and safety
3. Economical aspect
-Renewable material and non-renewable material -Renewable energy and non-renewable energy -Price
-Fiber cleaning frequency and fiber replacement frequency
Processing 1. Computation of total inputs/parameters 2. Computation of potential index -Environmental index
-Economical index -Social index
3. Computation of life cycle index for environmental, economical and social aspects. 4. Computation of overall sustainability index
Outputs 1. Total amount of inputs/ parameters
2. Sustainability indices for each product life cycle 3. Overall sustainability index
Carcinogen
Arsenic, benzene
Heavy Metal
lead (Pb), mercury, Chromium (Cr) and Cuprum (Cu)
Human Health
CO, nonmethane volatile organic compound (NMVOC)
and dust
Risk
Ergonomic process Safety
Energy
(Renewable energy, non renewable energy)
Resource
(Renewable material, non renewable
material)
Price
Fiber
Cleaning frequency Replacement
frequency
Social
Assessing the Sustainability
Economic Environment
GWP
Carbon dioxide (CO2), carbon
monoxide (CO) and methane
(CH4).
AP
Sulphur dioxide (SO2),
nitrogen oxide (NOX)
EP
Biochemical Oxygen Demand (BOD), Chemical Oxygen Demand (COD) phosphate
(PO4) and ammonia (NH3)
WP
[image:4.612.107.516.438.704.2]Figure 2General flow chart of fuzzy based sustainability assessment evaluation
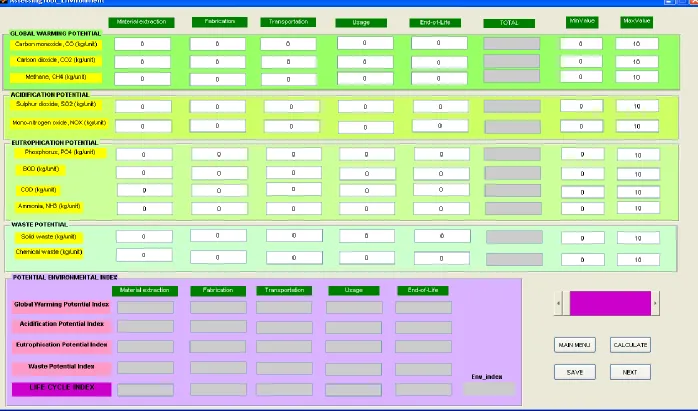
The sustainability assessment starts after the EVALUATION pushbutton is clicked. The assessment tool GUI for the environmental page will then appear as shown in Figure 4. Thereafter, users will have to enter the amount of the input parameters: CO2, CO, and CH4 for GWP; SO2 and NOx for AP; PO4, BOD, COD, and NH3 for EP; solid waste and chemical waste for WP. The reference values that will be used at every phase of the lifecycle will originate from material extraction, fabrication, transportation, usage, and EOL. The reference value is an important factor in fuzzy calculation for obtaining the sustainability indices. After loading all input data, the environmental sustainability indices (IGWP, IAP, IEP and IWP) for every phase of the lifecycle will be calculated by pressing the CALCULATE pushbutton. Finally, the user can either SAVE the results, return to the main menu by clicking the MAIN MENU pushbutton or proceed to the next
evaluation (social element) by clicking the NEXT pushbutton.
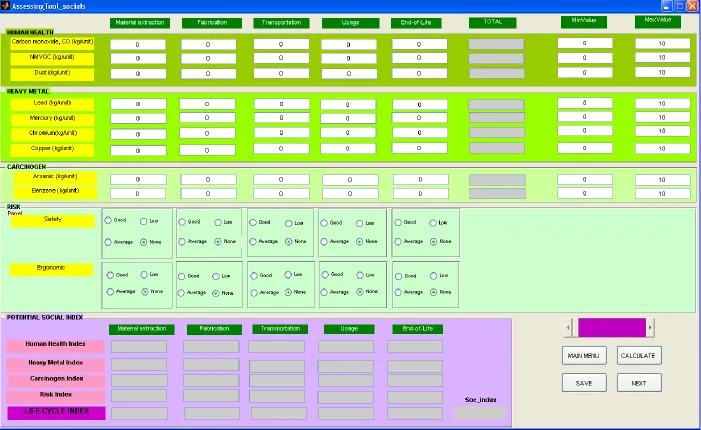
The GUI for assessing the social element is shown in Figure 5. To assess the social sustainability, users need to enter the amounts and reference values of CO, NMVOC, and NH4 for human health potential, Pb, Hg, Cr and Cu for heavy metal potential, and arsenic and benzene for carcinogens potential. For the risk, users need to select the level of safety and ergonomics on the basis of their knowledge and experience. The social sustainability indices (Ihuman health, Iheavy metal,
Icarcinogen, and Irisk) for every phase in the lifecycle will
be measured by pressing the CALCULATE pushbutton. The user can record the results or return to the main menu if they are not satisfied with the results. The user can either SAVE the results, return to the main menu by clicking the MAIN MENU pushbutton, or proceed to the next evaluation of the sustainability element (economic element) by clicking the NEXT pushbutton.
Enter input data for environmental
Evaluate total input data, potential environmental index
and life cycle index for environmental
Display sustainability index for environmental
Accept?
Yes No
Enter input data for economical
Evaluate total input data, potential economical index and life cycle index
for economical
Display sustainability index for economical
Accept?
Yes No Enter input data for
social
Evaluate total input data, potential social index and life
cycle index for social
Display sustainability index for social
Accept?
Yes No Display
methodology legislation Display
Display user guide Start
Evaluation
Evaluate overall sustainability index
Display overall sustainability index
Figure 3Main menu of GUI
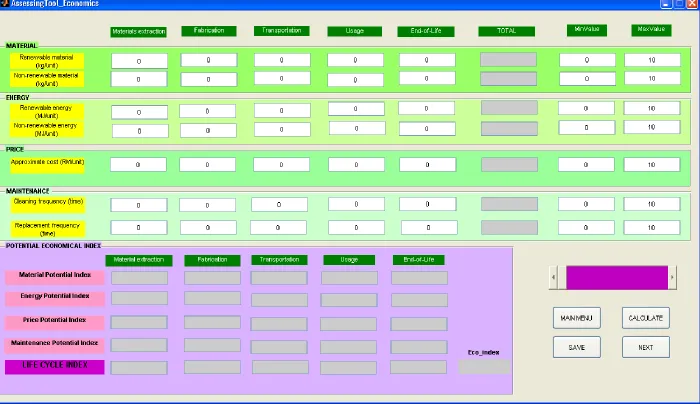
The measurement of the economic element can be obtained through the GUI shown in Figure 6. Users need to enter the amounts and reference values of renewable and non-renewable materials, renewable and non-renewable energy at each life cycle stage to obtain the economic sustainability indices(Imaterial, Ienergy
Iprice, andImaintenance) for every life cycle phase. In this
study, the input data for environmental, social, and economic elements are gathered from several certified databases such as the European Life Cycle Database and PE by using the GaBi 6 Software System and the Databases for Life Cycle Engineering [17]. Similar to the process in the previous pages, users can either SAVE the results, return to the main menu by clicking the MAIN MENU pushbutton, or proceed to the
next overall sustainability evaluation of the
sustainability element by clicking the NEXT pushbutton. The lifecycle index (LCI_index) will be referred to as the average index for every life cycle phase to obtain the environmental index Ienv by Eq. (2). The calculation is similar for the social index Isoc by Eq. (3) and economic index Ieco by Eq. (4).
The equal weightage value for each sustainability element is applied because the goal of the study is to
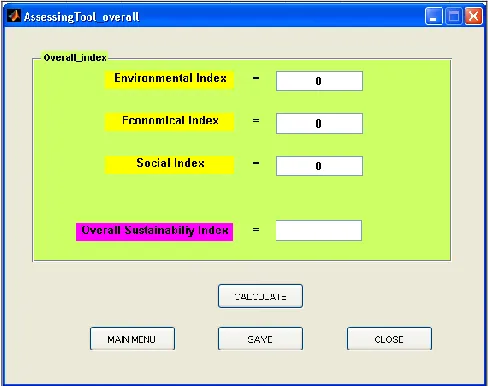
balance all elements toward sustainability. The user will be able view the overall sustainability assessment by pressing the NEXT button in the economic assessment page as shown in Figure 7. The overall sustainability index is the average of all sustainability elements measured in the previous assessment. The values of the environmental, social, and economic indexes will be used to obtain the overall sustainability index. The value of the environmental index Ienv, social index Isoc, and economic index Ieco can be obtained at the bottom of every assessment elements page.
Users need to load the index for each element (i.e., Ienv, Isoc and Ieco) and click the CALCULATE pushbutton to obtain the overall sustainability index by referring Eq. (5). The index value determines the level of product sustainability by considering all sustainability elements from the cradle-to-grave process. Hence, users can monitor the sustainability level at every lifecycle stage and plan for improvement toward sustainability. Users can either save the work by clicking the SAVE pushbutton or close the assessment by clicking the CLOSE pushbutton.
(2)
(3)
(4)
Figure 7Page for assessing overall sustainability
3.0 CASE STUDY OF HOLLOW FIBER
MEMBRANE MODULE
A product was selected for the case study to customize the developed GUI. The hollow fiber membrane module was selected as the product to be assessed. This case study was conducted on the membrane fabrication phase at the laboratory scale. The selection of the hollow fiber membrane module was based on high customer demand and the availability of required data. The hollow fiber membrane module have gained wide acceptance against competing technology in many areas because of its flexibility, performance reliability, environmental aspects, competitive cost, and increasing demand. The boundary analysis for this case study was conducted from the cradle to the grave.
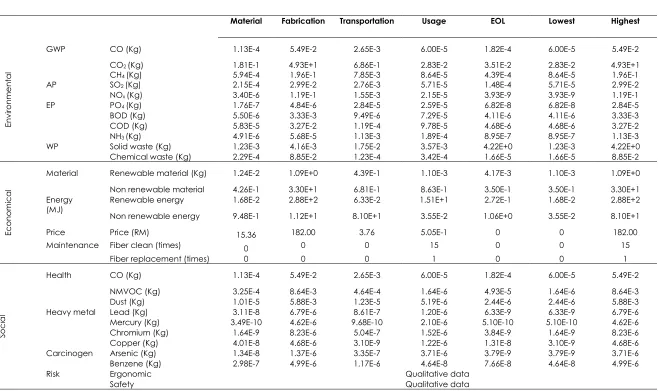
After selecting a product, the required parameters were identified on the basis of the potential impact for each sustainability element, as mentioned in the previous section. The data were obtained from a number of sources. Primary data were obtained from laboratory experiments and initial findings, and data from previous studies were used if data could not be obtained from primary sources. For this case study, expert opinions were used to validate the selected parameters before developing the GUI. Table 3 shows the input parameters for the hollow fiber membrane module including the reference value for the fuzzy evaluation. For each sustainability aspect, the values of the data were collected from several available life cycle databases, such as the GaBi Database. The values of each parameter were calculated on the basis of the lifecycle time at each life cycle phase.
Take the fabrication process as an example for data collection, the energy from electricity will be taken into consideration. Three processes are involved in the fabrication process of a hollow fiber
membrane module, including the mixing process, phase inversion process, and potting process. The power required for the fabrication process is assumed 30 W [18, 19]. Given that the stirring process of the polymer resin and solvent take one day (equal to 86400 s) for the completion of the dope solution, the required energy will be 2.592 MJ. For the phase inversion process, energy from electricity was calculated from the power consumptions of the gear pump, refrigeration unit, and wind-up drum. The amount of power at 30 W was measured for all electrical units during the phase inversion process. Thousands of threads (bundles) of hollow fibers were needed to produce one unit of a hollow fiber membrane module [18]. A hollow fiber membrane module contains an estimated 2500 threads. According to the data collected from the laboratory, a 250 mL dope solution requires 120 min (7200 s) to produce 1200 m hollow fibers.
Figure 8 shows that the U-length of one hollow fiber is 110 cm and that 2750 m of hollow fiber is necessary to produce one unit of hollow fiber membrane module. This amount requires a 573 mL dope solution at 275 min (16500 s). The time required for both refrigeration unit and wind-up drum is 16500 s. One thread of hollow fiber (U-length) requires 110 cm fiber; hence, 2500 hollow fiber threads requires 275000 cm. Hence, the calculation of the required electricity for the gear pump, refrigeration unit, and wind drum are shown. From the measurement, 30 L (30 kg) of water will be consumed at the water bath during the fabrication phase. Approximately 10 L of methanol will be used for fiber treatment during the fabrication process. Table 4 shows the ratio of the dope solution, time, and length of hollow fiber membrane module.
No electrical energy was required for the potting process. However, at this stage of the fabrication process, data for the epoxy resin and stainless steel of the module were considered. The measurements indicate that 1.05 kg of epoxy was needed for the potted fiber and 3.4970 kg for the stainless steel of the module. By using the GaBi database, the parameters necessary to produce 1 MJ of heat, 1 MJ of electricity, 1 kg of epoxy, 1kg of stainless steel, and 1 kg of water could be obtained. The parameter values for the fabrication phase are as follows: 2.592 MJ for the stirring process, 0.495 MJ for the gear pump, 0.495 MJ for the refrigeration unit, 0.495 MJ for the wind-up drum, 1.05 kg for the epoxy resin, 3.5 kg for the stainless steel, 30 kg for the tap water, and 10 L for the methanol.
Table 3 Input parameters of hollow fiber membrane module
Element Midpoints Parameters Life Cycle Phase Normalization Limit value
Material Fabrication Transportation Usage EOL Lowest Highest
En
vi
ronm
e
nt
a
l
GWP CO (Kg) 1.13E-4 5.49E-2 2.65E-3 6.00E-5 1.82E-4 6.00E-5 5.49E-2 CO2 (Kg) 1.81E-1 4.93E+1 6.86E-1 2.83E-2 3.51E-2 2.83E-2 4.93E+1
CH4 (Kg) 5.94E-4 1.96E-1 7.85E-3 8.64E-5 4.39E-4 8.64E-5 1.96E-1
AP SO2 (Kg) 2.15E-4 2.99E-2 2.76E-3 5.71E-5 1.48E-4 5.71E-5 2.99E-2
NOx (Kg) 3.40E-6 1.19E-1 1.55E-3 2.15E-5 3.93E-9 3.93E-9 1.19E-1
EP PO4 (Kg) 1.76E-7 4.84E-6 2.84E-5 2.59E-5 6.82E-8 6.82E-8 2.84E-5
BOD (Kg) 5.50E-6 3.33E-3 9.49E-6 7.29E-5 4.11E-6 4.11E-6 3.33E-3 COD (Kg) 5.83E-5 3.27E-2 1.19E-4 9.78E-5 4.68E-6 4.68E-6 3.27E-2 NH3 (Kg) 4.91E-6 5.68E-5 1.13E-3 1.89E-4 8.95E-7 8.95E-7 1.13E-3
WP Solid waste (Kg) 1.23E-3 4.16E-3 1.75E-2 3.57E-3 4.22E+0 1.23E-3 4.22E+0 Chemical waste (Kg) 2.29E-4 8.85E-2 1.23E-4 3.42E-4 1.66E-5 1.66E-5 8.85E-2
Ec
o
no
mi
c
a
l
Material Renewable material (Kg) 1.24E-2 1.09E+0 4.39E-1 1.10E-3 4.17E-3 1.10E-3 1.09E+0 Non renewable material 4.26E-1 3.30E+1 6.81E-1 8.63E-1 3.50E-1 3.50E-1 3.30E+1 Energy
(MJ) Renewable energy 1.68E-2 2.88E+2 6.33E-2 1.51E+1 2.72E-1 1.68E-2 2.88E+2 Non renewable energy 9.48E-1 1.12E+1 8.10E+1 3.55E-2 1.06E+0 3.55E-2 8.10E+1 Price Price (RM) 15.36 182.00 3.76 5.05E-1 0 0 182.00 Maintenance Fiber clean (times) 0 0 0 15 0 0 15
Fiber replacement (times) 0 0 0 1 0 0 1
Soc
ia
l
Health CO (Kg) 1.13E-4 5.49E-2 2.65E-3 6.00E-5 1.82E-4 6.00E-5 5.49E-2 NMVOC (Kg) 3.25E-4 8.64E-3 4.64E-4 1.64E-6 4.93E-5 1.64E-6 8.64E-3 Dust (Kg) 1.01E-5 5.88E-3 1.23E-5 5.19E-6 2.44E-6 2.44E-6 5.88E-3 Heavy metal Lead (Kg) 3.11E-8 6.79E-6 8.61E-7 1.20E-6 6.33E-9 6.33E-9 6.79E-6 Mercury (Kg) 3.49E-10 4.62E-6 9.68E-10 2.10E-6 5.10E-10 5.10E-10 4.62E-6 Chromium (Kg) 1.64E-9 8.23E-6 5.04E-7 1.52E-6 3.84E-9 1.64E-9 8.23E-6 Copper (Kg) 4.01E-8 4.68E-6 3.10E-9 1.22E-6 1.31E-8 3.10E-9 4.68E-6 Carcinogen Arsenic (Kg) 1.34E-8 1.37E-6 3.35E-7 3.71E-6 3.79E-9 3.79E-9 3.71E-6 Benzene (Kg) 2.98E-7 4.99E-6 1.17E-6 4.64E-8 7.66E-8 4.64E-8 4.99E-6 Risk Ergonomic Qualitative data
72:1 (2015) 1–6 | www.jurnalteknologi.utm.my | eISSN 2180–3722 |
[image:12.612.60.281.271.353.2]Figure 8 U-length diagram of hollow fiber membrane
Table 4 Input parameters of hollow fiber membrane module
Scenario Hollow fibers (cm)
Dope solution
(ml)
Time
(s)
Data collected (ideal)
120000 250 7200
For producing
1 unit of hfmm 275000 275 16500
4.0 RESULT AND DISCUSSION
When a user enters data on the input parameters with reference values (refer Table 3), the index results for each sustainability aspect will be calculated by using the fuzzy logic approach. The results from the sustainability assessment for the environmental, social, and economical indexes for the hollow fiber membrane module are presented in the graphs in Figure 9, Figure 10 and Figure 11. The LCI_index will be referred to as the average index value of a certain phase in the lifecycle.
Figure 9 reveals that the fabrication process has the lowest index for the environmental aspect with and LCI_index of 0.2669 compared with another
phase of the lifecycle. This result can be attributed to the significant use of methanol during the treatment, electrification, and preparation of the hollow fiber membrane, thus resulting in the production of
excessive amounts of CO2 and SO2. This process
contributes to GWP and AP.
For the social fuzzy assessment shown in Figure 10, the fabrication process phase has the lowest sustainability performance with an LCI_index of 0.3512. This result is due to the significant use of electricity and the preparation of epoxy, which produces CO and NMVOC, thus causing harm to human health. Furthermore, the materials and chemicals used in the processes also release heavy metals and carcinogens. The value of these chemicals and carcinogens depend on the scale of the system boundary. In this case study, the fabrication process releases small amounts of heavy metals such as lead, mercury, chromium, and copper. Small amounts of carcinogens in the form of arsenic and benzene are also released.
The fabrication phase also has the lowest sustainability performance for the economic aspects with an LCI_index of 0.581. This result can be attributed to the high consumption of non-renewable materials and energy compared with the result of other lifecycle phases. When direct price was considered, the fabrication phase also has the highest price when compared with the price of other phases. Other phases contribute minimally to both material and energy potential impacts under the economic criteria.
In determining the overall sustainability
[image:12.612.128.485.558.693.2]performance, users can obtain the overall sustainability index for the hollow fiber membrane module by entering each sustainability index value. Figure 12 shows an overall index of 0.733 is obtained by averaging Ienv, Isoc, and Ieco. The results obtained will enable the user to identify the weakness of the sustainability performance during each life cycle phase and determine the areas that require improvement.
Figure 10 Result of social indices
Figure 11 Result of economical indices
Figure 12 Result of overall indices
The results indicate that the sustainability of a hollow fiber membrane module is at an average level. Hence, improvements are needed for the weak areas of the sustainability level. The analysis of the results indicates that fabrication processes need to be monitored because these areas display the lowest level of sustainability compared to another phases. Improvements can be achieved by monitoring the resources used during the fabrication process. Electricity and water consumption during the fabrication phase should also be monitored and improved without reducing membrane performance. Utilizing the space during transportation can also reduce costs during the transportation phase. The
suggestions and implementations related to improving the sustainability level are important to attain a sustainable product lifecycle.
data understandable and easy to interpret. A case study has been successfully conducted by using the developed GUI. The developed GUI was able to assess the sustainability and lifecycle of the hollow fiber membrane module.
The data of the input parameters and reference values (minimum and maximum values) need to be identified to assess the sustainability of the
membrane lifecycle. The developed GUI
methodology does not provide a complete database. All input parameters and reference values need to be inserted by the user. Users need to gather the values through the databases before they can use the GUI fuzzy developed methodology, thereby allowing the sustainability of the product lifecycle to be determined for further improvements.
5.0 CONCLUSION
The sustainability performance index can be assessed by using the proposed fuzzy logic-based GUI. In this approach, all fuzzy calculations are embedded in the GUI with the codes and callback functions by using fuzzy linguistics. The developed GUI is more user friendly than conventional calculations using formulas or mathematical approaches. This proposed GUI provides a computer-based tool to support the decision-making process of designers and manufacturers and enable them to monitor the level of sustainability of product development. Hence, improvements can be achieved by considering weak areas as areas for improvement.
The fuzzy-based approach will continue to play an important role in the future. As an excellent tool for research, particularly for monitoring the process for further improvement toward sustainability, the developed fuzzy-based GUI can be extended by future works to assess the sustainability level of all products.
Acknowledgement
The authors thank the Ministry of Higher Education, Universiti Teknologi Malaysia, and the Research Management Center for providing financial support through the Long Term Research Grant Scheme (Grant No.4L804) and Research University Grant (Grant No.06H88).
References
[1] Ness, B., E. Urbel-Piirsalu, S. Anderberg. and L. Olsson. 2007.
Categorising Tools for Sustainability Assessment. Ecological
Economics. 60(3): 498-508.
DOI:10.1016/j.ecolecon.2006.07.023.
[2] Hemdi, A. R., M.Z. Mat Saman, and S. Sharif. 2011.
Sustainability Evaluation using Fuzzy Inference Methods.
International Journal of Sustainable Energy. 2011: 1-17.
[3] Srivastava, P., A. Burande, and N. Sharma. 2013. Fuzzy
Environmental Model for Evaluating Water Quality of
Sangam Zone during Maha Kumb 2013. Applied
Computational Intelligence and Soft Computing. 2013:
1-7.
[4] Mahmood, S., N. S. Jiran, M. Z. Mat Saman, and N. M.
Yusof. 2014. Determination of Parameters for Sustainability Assessment of Hollow Fiber Membrane Module Life Cycle.
Advanced Material Research. 845: 724-729.
[5] Avouris, N.M. and S. Finotti.1993. User Interface Design to
Expert Systems Based on Hierarchical Spatial
Representations. Expert Systems with Applications. 6(2):
109-118.
[6] Ullah, A., M. Z. Mat Saman and S. Mahmood. 2014.
Development of Multi-criteria Analysis Methodology to
Determine Product End-of-life Treatment Option.
Advanced Material Research. 845: 852-856.
[7] Hassan, M. F., M. Z. Mat Saman, S. Sharif, and B. Omar.
2013. Selection of Product Design Configuration for Improves Sustainability using The Product Sustainability
Index (ProdSI) Scoring Method. Applied Mechanics and
Material. 315: 51-56.
[8] Ghadimi, P., N. M. Yusof, and M. Z. Mat Saman. 2011. A
Graphical User Interface for Assessing the Sustainability Level of Manufactured Products: An Automotive
Component Case Study. Perintis e-Journal, Special Issues
on Science for Sustainability. 1: 10-16.
[9] Hai, L. T., P. H. Hai, and C L., Thai. 2011. Software for
Sustainability Assessment: A case study in Quang Tri
Province, Vietnam. Environmental Modelling &
Assessment. 16(6): 541-550.
[10] Hidalgo, D., R. Irusta, et al. 2007. Development of A
Multi-function Software Decision Support Tool for the Promotion of the Safe Reuse of Treated Urban Wastewater.
Desalination. 215(1-3): 90-103.
[11] Zhu, X., and A. P. Dale. 2001. JavaAHP: A Web-based
Decision Analysis Tool for Natural Resource and
Environmental Management. Environmental Modelling &
Software. 16(3): 251-262.
[12] Chi, H. 2000. Computer Simulation Models for
Sustainability. International Journal of Sustainability in
Higher Education. 1(2): 154-167.
[13] Mahmood, S., A. R. Hemdi, M. Z. Mat Saman, and N. M.
Yusof. 2014. Fuzzy Logic Approach for Assessing Sustainability: Methodology Development for Hollow Fiber
Membrane Module. Advanced Material Research. 845:
579-583.
[14] Matlab Software version 8.2.0.701. Accessed January
2014. Mathwork Licence No 648116.
[15] Rajaram, T., and A. Das. 2010. Modeling of Interactions
among Sustainability Components of An Agro-Ecosystem using Local Knowledge through Cognitive Mapping and
Fuzzy Inference System. Expert Systems with Applications.
37: 1734-1744.
[16] Phillis, Y.A., and L. A. Andriantiatsaholiniaina. 2001.
Sustainability: An Ill-defined Concept and its Assessment
using Fuzzy logic. Ecological Economics. 37(3): 435-456.
[17] PE: GaBi 6 Software-System and Databases for Life Cycle
Engineering. Copyright, TM. Stuttgart, Echterdingen 1992-2013. Accessed May 1992-2013.
[18] Khayet, M., C.Y. Feng, K.C. Khulbe, and T. Matsuura. 2002.
Preparation and Characterization of Polyvinyldene Fluoride Hollow Fiber Membranes for Ultrafiltration.
Polymer. 43: 3879-3890.
[19] Idris, A., A.F. Ismail, N.M. Yusof, and S.J. Shilton. 2002.
Optimization of Cellulose Acetate Hollow Fiber Reverse Osmosis Membrane Production using Taguchi Method.