Journal of Chemical and Pharmaceutical Research, 2015, 7(2):292-297
Research Article
CODEN(USA) : JCPRC5
ISSN : 0975-7384
Detection of architectural distortion using multilayer back
propagation neural network
Anne Frank Joe A.
Department of EIE, Sathyabama University, Chennai
_____________________________________________________________________________________________
ABSTRACT
Mammograms taken at prescribed intervals fail to curtail the vast occurrence of breast cancers. One foremost cause is that at the initial stages where there are only minor symptoms visible in a mammogram chances are that it could be overlooked during perusal. There are many signs of breast cancer like Calcification, Masses, Bilateral Asymmetry and Architectural Distortion. Architectural Distortion may be associated with early diagnosis of breast cancer because even before there is a visible mass, cancer growth can disrupt parenchyma structure. Double reading of screening mammograms could provide higher sensitivity over single reading, but the limitation on time and trained professionals makes it a not so possible approach. Algorithms are developed to assist radiologists in detecting abnormalities in mammograms. In this paper, a system is developed to classify Architectural Distortion abnormality from normal mammogram samples. Gabor features along with Law’s Texture Energy measures derived from geometrically transformed regions of interests are used to detect architectural distortion. The method has a good potential in detecting architectural distortion in mammograms of interval cancer cases.
Key words: Architectural distortion, Gabor filters, phase-portrait analysis, Laws’ texture energy measures, CAD.
_____________________________________________________________________________________________
INTRODUCTION
Cancer is one of the diseases where success of the treatment primarily depends on the early detection of the disease. The abnormal growth in the breast caused by cancer is a type of cancer where cells in the breast divide and grow out of control. This could be benign (which is not potentially dangerous to health) or malignant (which could be potentially dangerous).Architectural distortion unlike the formation of masses is often due to a desmoplastic reaction in which there is focal disruption of the normal breast tissue pattern.
Mammography is a medical imaging procedure used to screen for breast cancer. Mammography is useful in discovering tumors too small to be felt. A general wellness mammogram checkup once every 2 years for all women aged above 35 is advised by the government for early diagnosis and detection of an occurrence. Earlier the detection better are the chances of a successful and effective treatment. The procedure is to obtain an X-ray of the breast with a very low radiation dose. Mammography is simple, low cost and non-penetrative. Very subtle signs of breast cancer in the form of Architectural distortion of the breast tissues is often missed by radiologists, thereby causing deep rooted cancer growth and diagnosis pushed to the farther end[6]. To help radiologists’ computer aided systems are developed, similar to a second opinion and may be used in the first stage of examination. The final decision is left to the radiologists. A regular mammogram is an intensity x-ray image with gray levels showing levels of contrast inside the breast which characterize normal tissue and different masses and calcification. To name a few important signs of breast cancer that radiologists look for are clusters of micro calcifications, bounded masses, spiculated masses and architectural distortions.
but the required number of expert radiologists and the time constraint makes such an approach impractical, wherein the subtle amount of early stage signs is overlooked. A study released by British researchers revealed that using CAD in combination with a single reading by a radiologist or physician may be as favorable as a second perusal by a professional expert. This would help in increasing the sensitivity and accuracy of detection.
When a mammogram image is viewed, breast tissue appears white and dense and the fatty tissue appears darker and lucent. Unlike a solid growth like masses and calcifications, the architectural distortion appears as an area of breast tissue that is distorted with no definable vital mass. Here the initial stages of formation of a breast tumor may closely resemble the appearance of normal breast tissue overlapped in the projected mammogram. Due to its very close similarity to normal tissues and no specific visibility in presentation, architectural distortion is reported to be the most commonly missed abnormality in false-negative cases. There are many successful CAD techniques developed that have been effective enough in identifying masses and micro calcifications with acceptable performance, and not so effective in detecting architectural distortion with a high level of correctness. Work devoted to improve the sensitivity and accuracy in the detection of architectural distortion could help in efficiently improving the diagnosis of breast cancer.
A. GENERAL PATTERN OF ARCHITECTURAL DISTORTION
The development of CAD systems designed for the detection of subtle or hard-to-spot signs, particularly, in prior mammograms, is important, this could be improved by simultaneous analysis of current and previously obtained (prior) mammograms thereby facilitating the detection of breast diseases at their early stages. Here, methods are presented for the detection of sites of architectural distortion in prior mammograms of interval-cancer cases in a screening program.
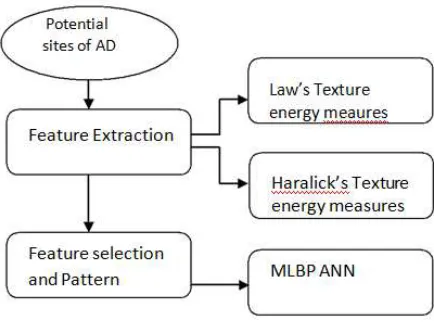
It is hypothesized that screening mammograms obtained prior to the detection of breast cancer could contain subtle signs of early stages of breast cancer such as architectural distortion in specific. The methods are based upon Gabor filters, phase portrait analysis, Laws’ texture energy measures and Haralick’s texture features [5]. Finally the classification performance of the individual features (such as Node Value, Laws Texture and Haralick’s features) from several combinations of feature sets using Multilayer Back Propagation Neural Network as a classifier is presented.
II. EXPERIMENTAL SECTION: DETECTION OF ARCHITECTURAL DISTORTION
A biological image is a challenge in image processing techniques; a mammogram is one such challenge. Due to the presence of several piecewise linear structures, such as fibrous tissues, duct, and blood vessels can be considered as an image with oriented texture. The regular texture pattern, which converges toward the nipple, is faint in the presence of architectural distortion with no visible mass.
[image:2.595.218.390.577.752.2]Figure 2: Obtaining Fine-tuned ROIs
The flow of methodology to identify ROI is shown in figure 1 and figure 2 shows the narrowing down of ROIs that are possible True positives. The most probable sites of architectural distortion in mammograms were analyzed by the following methods.
(1) The given image was filtered and down sampled to 200 µ m/pixel and 8 bits/pixel. Otsu’s threshold method was employed to obtain the segmentation of the portion of interest (breast) from the entire mammographic image (i.e., the patient id, left/right etc. indication are omitted[1]. The smoothening of edges was also performed.
(2) Oriented features were detected by using Gabor filters, the filter kernel oriented at the angle of -π/2 is given as g(x,y)={exp[-0.5*((x2/σx2)+(y2/ σy2))]*cos(2πfx)}/(2πσxσy)
For applying the filter at many different angles, the above kernel is rotated to desire. The parameters namely, σx, σy
and f were derived using the design rules proposed by Rangayyan and Ayres. A total of 180 Gabor kernels with evenly spaced angles in the range [-π/2, π/2] was employed. The figure 3 shows the input image and orientation fields obtained. The orientation field is derived from the angle of the applied filter with the highest response at each pixel.
(3) Thus obtained orientation field was filtered by applying a Gaussian filter and further down sampled by a factor of four, to an effective resolution of 800 µm/pixel. This helps in reducing noise and also aids in the following computational requirements.
(4) The type of the phase portrait which closely resembles the orientation field helps in describing the field. A mammogram could show signs of several patterns, a sliding analysis window of size 10 *10 pixels (at 800 µ m/pixel) and sliding stepwise by one pixel. For each location of the window, a vote was given at the node position given by the corresponding fixed point to form the node map. Several votes at very close proximity will appear like a bright spot in the node map and should be an indication of potential sites of architectural distortion. Figure 4 shows the node map of the input image.
(5) The peaks are given ranks (numbers) and are ordered in the node map. By this method a number of false positive sites (wrongly identified as AD) are also detected. The center of the peak in the node map was considered as the center of the region of interest(ROI) , a square of size 128* 128 pixels at 200 µ m/pixel (except at the edges of the images) was drawn[1]. Figure 5 show the rank ordered ROIs. This marked region represents the region of possible Architectural Distortion.
Figure 3: The image on the right shows a possible orientation field for the image on the left Each segment of line corresponds to a respective pixel in the original image
Figure 4: Binary image Figure 5: Shows all the auto of Node map matically detected ROIs
[image:4.595.155.426.307.581.2]Figure 6: The Automatically detected ROIs and the Final output of the classifier
Figure 6 shows the finally classified ROIs that are most possible Architectural distortion. Out of the 3 detected ROIs, 2 ROIs capture the region marked by the radiologist thus counting as True Positive. The remaining 2 ROIs are considered as FP, False Positive. There are 19 correctly rejected ROIs called the True Negatives and in this case there is no region left behind that was not detected thereby making the False Negative a 0.
Table1: Images processed and the obtained results
No of Images
AD marked by Experts(total)
ROIs per image(average) True Positives(TP) False Positive(FP) True Negative(TN) False Negative(FN)
24 36 60 29 12 7 -
RESULTS AND DISCUSSION
On analyzing a total of 24 mammograms, a total of 1448 ROIs (60 ROIs on an average) were automatically detected. The total count of True positives in the original image was 29. Out of the 36 areas marked as potential AD by the radiologist 29 True positive(correctly identified) sites were detected by the MLBP classifier and about 12 sites were wrongly marked as AD by the classifier. A total of 1419 ROIs were correctly rejected (True Negatives TN). There was not a single image which was left with unidentified AD spot (i.e., False Negative, FN=0).
However, none of the individual features has adequate discriminate power to classify the TP and FP ROIs efficiently; the results indicate the need for combinations of features and the application of feature selection. Regardless, node analysis serves as an important initial step to select candidate ROIs for further analysis.
Detection of sites of architectural distortion at higher sensitivity and lower false-positive rates is the primary objective. The proposed method can be further extended with various feature extraction methods like multifractal analysis etc and competitive feature selection methods.
REFERENCES
[1]R M Rangayyan; S Banik; J E L Desautels, J. Digital Image., Feb. 2010.
[2] S Banik; R M Rangayyan; J E L Desautels; J M Fitzpatrick; M Sonka, “Detection of architectural distortion in prior mammograms using fractal analysis and angular spread of power,” in Proc. SPIE Med. Imag. 2010: Computer Aided Diagnosis, San Diego, CA, Feb. 2010,762408-1–762408-9.
[3]S Banik; R M Rangayyan; J E L Desautels, “Detection of architectural distortion in prior mammograms of interval cancer using Laws’ texture energy measures,” in Proc. 24th Int. Congress Exhibition: Comput. Assist. Radiol. Surg., Geneva, Switzerland, Jun. 2010, 5, S200–S201.
[4] N Karssemeijer; G M te Brake, IEEE Trans. Med. Imag., Oct. 1996, 15( 5) 611–619. [5]G D Tourassi; D M Delong; C E Floyd Jr., Phys. Med. Biol., 2006, 51( 5), 1299–1312,.
[image:5.595.69.546.395.445.2]