Civil Engineering and Architecture 7(6A): 7-18, 2019 http://www.hrpub.org DOI: 10.13189/cea.2019.071402
Sub-surface Profiling Using Electrical Resistivity
Tomography (ERT) with Complement from
Peat Sampler
Kasbi Basri
1,2,*, Norhaliza Wahab
1,2, Mohd Khaidir Abu Talib
1,2, Adnan Zainorabidin
1,21
Faculty of Civil Engineering and Environmental, Universiti Tun Hussein Onn Malaysia, Malaysia
2
Research Centre for Soft Soil (RECESS), Universiti Tun Hussein Onn Malaysia, Malaysia
Received July 30, 2019; Revised September 23, 2019; Accepted December 10, 2019
Copyright©2019 by authors, all rights reserved. Authors agree that this article remains permanently open access under the terms of the Creative Commons Attribution License 4.0 International License
Abstract
The pre-construction works include the geotechnical investigation which comprises the surface and subsurface exploration. Sub-surface exploration often causes several difficulties such as high cost, time consuming, localized investigation and intrusive. Furthermore, investigation on soft soil such as peat often raises several additional problems such as high risk of sample disturbance, difficult access for heavy equipment and inconsistent data due to the heterogeneity of peat. The advancement of geophysical method such as Electrical Resistivity Tomography (ERT) allows the determination of soil profile in time-efficient manner, economic, larger volume of investigation and non-intrusive. This study focused on the determination of soil profile, particularly peat layer using ERT method with complement from peat sampler data. The study was conducted at Parit Nipah, Johor. The results revealed a high accuracy profile delineated by the ERT method with only less than 8% percentage of error as compared to peat sampler profile. The comparison between Schlumberger and Wenner array showed that; the Schlumberger showed superior depth of penetration, with almost 3 times deeper penetration relative to Wenner. The Schlumberger array is also able to delineate lateral variation within the peat layer. Finally, the resistivity value of peat obtained ranged from 100.8 to 139.5 ohm.m with both arrays having consistent results.Keywords
ERT, Peat, Peat Sampler1. Introduction
The determination of soil profile is very critical in geotechnical investigation. To adequately design the geotechnical structure for any construction, it is necessary
to accumulate sufficient data regarding the soil profile. Conventional method such as boring is proven to be efficient to provide sufficient data needed. However, the method is expensive, time consuming and intrusive. Large-scale project such as highway and railway usually required high number of boreholes to provide sufficient data for detail interpretation. Causing the construction time and cost to increase drastically.
In recent years, geophysical methods have gained much attention as it is a non-intrusive investigation, and involves larger volume of investigation and rapid data interpretation. The advancement of the geophysical method such as Electrical Resistivity Tomography (ERT) allowed the mapping of the electrical resistivity distribution in the Earth, thus, allowing the estimation of the subsurface heterogeneity [1]. The measurement of the ground surface (layers of materials with different individual resistivity) when current is injected into the ground through two current electrodes allows the determination of the subsurface resistivity distribution [2, 3]. The critical part in ERT is computing the resistivity pseudosection. Everett [4] mentioned that, ERT imaging is performed by matching the measured apparent resistivity pseudosection to a computed pseudosection. The ERT measurement can be interpreted into 1-D, 2-D and 3-D high resolution resistivity images. Compared to other electrical methods, ERT is considered as superior, because quantitative results are obtained by using controlled source of specific dimensions [5]. Also, the electrical properties are greatly affected by the geological parameters such as mineral, fluid content, porosity and degree of water saturation [3, 6, 7]. Therefore, it is possible to separate different soil layer by mapping the soil electrical resistivity distribution.
also well known to have high natural water content, high compressibility, high organic content, low shear strength and low bearing capacity [8]. According to Huat [10], organic content has significant effect on the resistivity value. The critical aspect of peat was the ability to store very high-water content. The ability of holding considerable amount of water was governed by the soil structure characterized by organic coarse particles (fibers) which is characterized as very loose and hollow [11]. The high amount of water stored within peat allows the current flow smoothly which allows subsurface resistivity mapping. Very often, underneath the peat layer is sensitive soil such as soft clay. The presence of clay minerals increases the conductivity through the ion exchange process [6]. Therefore, high contrast of resistivity distribution is expected to distinguish between peat and soft clay layer as peat has higher resistivity value compared to soft clay.
This study focused on delineating the soil stratigraphy by using geophysical method known as ERT method. This method is expected to replace or complement the conventional borehole method for rapid and sustainable soil profile investigation. However, due to only few prior
studies reported involving the geophysical methods with the conventional method especially on soft soil, the level of uncertainty regarding the data obtained using the geophysical methods is still high. Therefore, extensive study to relate geophysical data with conventional method is critical. Integration between geophysical and conventional method would provide rapid, larger volume, and more economic method of investigation.
2. Site Description
Civil Engineering and Architecture 7(6A): 7-18, 2019 9
Figure 1. Geological map of Parit Raja [12]
3. Field Investigation
The field study comprises geo-electrical investigations using Electrical Resistivity Tomography (ERT) and peat profile using peat sampler. The study focused on the determination of the depth of peat by means of non-destructive test (NDT) and was verified by the conventional intrusive test.
3.1. Electrical Resistivity Tomography (ERT)
[image:3.595.71.516.80.589.2]Figure 2. Array arrangement and pseudosection example for Schlumberger and Wenner arrays [3]
Both arrays were chosen as the study only focused on the shallow profile and involved heterogeneous material. According to Morris et al. [13], Schlumberger array is superior in detecting lateral resistivity inhomogeneity. While, Wenner array is capable in detecting vertical changes [14]. The presence of clay layer also provides high cation exchange capacity (CEC) to the soil particles which suggests that low resistivity values are expected which makes Schlumberger and Wenner array superior compared to other types of array. As mentioned by Moreira et al. [15], Schlumberger and Wenner arrays are recommended for low resistivity with emphasis on schlumberger array. Therefore, Schlumberger and Wenner arrays were chosen for this study as the method had the advantages in term of the suitability of the method on the target materials and the simplicity of the configurations.
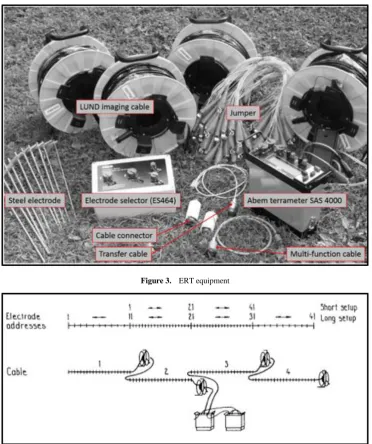
The main equipment involved in the test includes ABEM Terrameter SAS 4000, Lund imaging cable, jumper, electrode selector and steel electrodes. Figure 3 shows some of the equipment involved in ERT test. A total of 41 steel electrodes (maximum number of
[image:4.595.101.500.75.459.2]Civil Engineering and Architecture 7(6A): 7-18, 2019 11
Figure 3. ERT equipment
Figure 4. ERT field arrangement
3.2. Peat Sampler
The peat sampler was used to obtain the semi-disturbed samples. The procedures follow the guideline provided by Eijkelkamp Agrisearch Equipment [18]. The peat sampler tests were conducted to verify the soil stratigraphy obtained by the ERT method. Peat sampler was used as an alternative to expensive and complicated borehole. Three investigation points located along the array lines were investigated. The profiles were determined for every 0.5 meter until the depth of 5 meters.
4. Results Discussion
4.1. Soil Resistivity Profile
The results for the 2-D stratigraphy profiles obtained
were as shown Figure 5 and Figure 6. The image obtained shows good contrast between different soil layers allowing determination of peat thickness. The profiles obtained by Schlumberger array show superiority in depth of investigation compared to Wenner array with similar electrode spacing. The finding is in good agreement with Apostolopoulos [19] that mentioned Schlumberger array provided great sensitivity to depth and good penetration of depth through a conductive surface layer. The profile depth obtained using Schlumberger array using 1 meter and 1.5 meters electrode spacing was 7.8 and 11.8 meters respectively. While, using Wenner array the profile depth was only 2.5 and 3.7 meters.
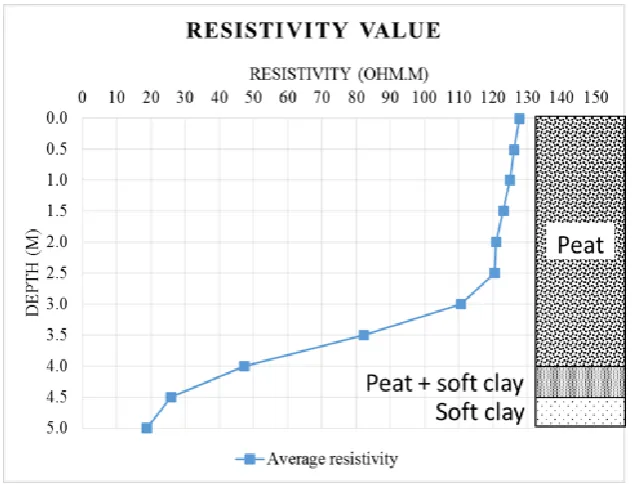
[image:5.595.112.485.75.520.2]obtained for peat ranged from 100.8 to 139.5 ohm.m. The resistivity value started to drop drastically at the depth between 3.9 to 4.8 meters and 3.7 to 4.7 meters for 1 meter and 1.5 meters electrode spacing respectively showing the
transition layer between peat and soft clay. The resistivity value obtained for soft clay ranged from 5.4 to 22.3 ohm.m.
(a)
(b)
(c)
(d)
[image:6.595.66.527.130.701.2]Civil Engineering and Architecture 7(6A): 7-18, 2019 13
(a)
(b)
(c)
(d)
[image:7.595.67.530.75.638.2]The soil stratigraphy obtained using Wenner array was as shown in Figure 6. As mentioned earlier, the depth of penetration using Wenner array was less as compared to Schlumberger array. Therefore, the results obtained covered only the profile for peat layer. The resistivity value obtained ranged from 110.9 to 130.6 ohm.m. The results were in good agreement with the Schlumberger array.
The high resistivity value of peat was governed by the low degree of humification on the study area. According to Mansor and Zainorabidin [20], the Parit Nipah peat was hemic peat with 88% of organic content. High organic content and low decomposition rate cause the resistivity to increase [10]. The electrical conductivity response of peat also depends mainly on the conductivity of the fluid saturating the sample [21]. This suggested that, the conductivity of fluid saturating the peat on the study area was low. While, the drastic drop in resistivity value in soft clay layer was due to high cation exchange capacity (CEC) provided by the clay fraction [10, 22]. According to Ling et al. [23], the CEC value for Parit Nipah peat was only in the range of 6.79 to 8.5 meq/100 g. Thus, lower CEC and high organic content contributed to high resistivity value of peat.
The investigation using Schlumberger array had also revealed a significant variation of resistivity value laterally within the peat layer. Apostolopoulos [19] mentioned that, Schlumberger array provide high resolution of horizontal variation. This suggests that, Schlumberger array could map the resistivity variation due to heterogeneity of peat. As for the soft clay layer, the resistivity value was consistent as the soil was homogeneous. However, the variations of resistivity value were not obtained using Wenner array configurations suggesting Schlumberger array superiority in delineating lateral variations. The finding agreed well with Morris et al. [13], which stated that the Schlumberger array is superior compared to Wenner array in detecting lateral resistivity inhomogeneity. Loke [14] also mentioned that Wenner array is incapable in detecting horizontal changes. From the 2-D stratigraphy, 1-D resistivity value was extracted from the center of the array line to obtain the resistivity value of soil. Figure 7 shows the resistivity value of soil with depth for different configurations and Figure 8 shows the resistivity value obtained for the top 5 meters. From Figure 7, the graph shows a slight variation
occurred mainly on the top 3 meters suggesting the effect of lateral heterogeneity of peat and the different electrode spacing. A shorter spacing generates denser data compared to a longer spacing. According to Okpoli [24], the sensitivity of geo-electrical resistivity increases with the increase in data density and decreases with the increase in depth of investigation (longer electrode spacing). For the depth below 3 meters, the results with different configurations agreed well with minimum variations. From Figure 8, the resistivity value of peat generally decreased slightly with depth. According to Ling et al. [23], the organic content of peat at Parit Nipah decreases with depth. The resistivity value decreases as the organic content decreases [10].
Further, El-galladi et al. [25] mentioned that the conductivity of peat pore water increases with depth. This suggests the conductivity of peat pore water at Parit Nipah increases with depth. As mentioned by Kim et al. [26], the conductivity of pore fluid affects the resistivity of soil. At the transition layer between peat and soft clay the resistivity value decreased drastically due to the presence of clay fraction. As mentioned previously, the presence of clay fraction provides high CEC, thus, causing a lower resistivity value [10]. Also, at the soft clay layer, the resistivity value was very low. This was governed by high CEC and presence of saturated clay [10, 22].
4.2. Soil Profile
Civil Engineering and Architecture 7(6A): 7-18, 2019 15
Figure 7. Peat resistivity value with different configuration
[image:9.595.116.482.79.358.2] [image:9.595.140.458.391.633.2]Table 1. Soil profile obtained using peat sampler
Soil Profile Depth (m) Remarks
0 – 0.5 Peat
0.5 – 1.0 Peat
1.0 – 1.5 Peat
1.5 – 2.0 Peat
2.0 – 2.5 Peat
2.5 – 3.0 Peat
3.0 – 3.5 Peat
3.5 – 4.0 Peat
4.0 – 4.5 Peat + soft clay
4.5 – 5.0 Soft clay
5. Comparison between ERT Method
and Peat Sampler
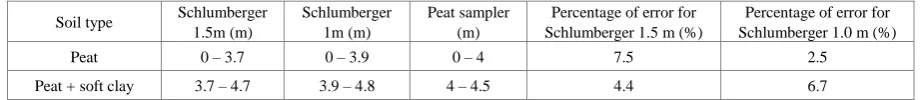
The soil stratigraphy obtained using the electrical resistivity method and the soil profile from the peat sampler was compared. The percentage of error for the observed and exact value was calculated using the standard equation for percent of error [(observed value – exact value)/exact value x 100]. Table 2 summarizes the comparison between the soil profiles obtained using ERT method and peat sampler. The results obtained using Wenner array were not included due to insufficient depth of penetration. The percentage of error for peat layer determined using Schlumberger array with 1 meter and 1.5 meters electrode spacing was 2.5 % and 7.5 %
Civil Engineering and Architecture 7(6A): 7-18, 2019 17
Table 2. Summary of comparison between ERT and peat sampler method
Soil type Schlumberger 1.5m (m)
Schlumberger 1m (m)
Peat sampler (m)
Percentage of error for Schlumberger 1.5 m (%)
Percentage of error for Schlumberger 1.0 m (%)
Peat 0 – 3.7 0 – 3.9 0 – 4 7.5 2.5
Peat + soft clay 3.7 – 4.7 3.9 – 4.8 4 – 4.5 4.4 6.7
6. Conclusions
The application of ERT method on the determination of soil profile shows promising results. The soil profile obtained using the ERT method agreed well with the peat sampler data. The overall percentage of difference was only less than 8%. Comparison between Schlumberger and Wenner array shows superiority of Schlumberger in terms of depth of penetration and lateral variation detection. As the Schlumberger array was able to delineate the lateral variations caused by the heterogeneity of peat. Overall, the average resistivity value of peat obtained ranged from 100.8 to 139.5 ohm.m. The high value of resistivity was governed by high organic content and low CEC value. The results concluded that the ERT method was able to delineate the soil profile with high accuracy in timely efficient manner, lower cost, larger volume of investigation and non-intrusive. To further improve the application of ERT method, the author recommends that special attention on peat organic content, moisture content, CEC and degree of humification should be needed to better understand the peat resistivity value changes.
Acknowledgements
The authors would like to thank the University of Tun Hussein Onn Malaysia, and Ministry of Education Malaysia for their generous grant of this research, TIER 1 research grant, GPPS grant vot number H009 and H011. The authors also would like to extend their gratitude to Research Centre for Soft Soil (RECESS) for allowing the use of research equipment and facilities.
REFERENCES
[1] Slob, E., Optimal acquisition and synthetic electrode arrays, in SEG Technical Program Expanded Abstracts 2004. 2004, Society of Exploration Geophysicists. p. 1389-1392.
[2] Herman, R., An introduction to electrical resistivity in geophysics. American Journal of Physics, 2001. 69(9): p. 943-952.
[3] Loke, M., Electrical imaging surveys for environmental and engineering studies. A practical guide to, 1999. 2.
[4] Everett, M.E., Near-surface applied geophysics. 2013: Cambridge University Press.
[5] Telford, W.M., et al., Applied geophysics. Vol. 1. 1990: Cambridge university press.
[6] Aizebeokhai, A.P., K.D. Oyeyemi, and O.T. Kayode. Multiple-gradient array for near-surface electrical resistivity tomography. in Near-Surface Asia Pacific Conference, Waikoloa, Hawaii, 7-10 July 2015. 2015. Society of Exploration Geophysicists, Australian Society of Exploration.
[7] Miele, M., et al. Rectangular Schlumberger resistivity arrays for delineating vadose zone clay-lined fractures in shallow tuff. in Symposium on the Application of Geophysics to Engineering and Environmental Problems 1996. 1996. Society of Exploration Geophysicists.
[8] Zainorabidin, A. and D.C. Wijeyesekera, Geotechnical challenges with Malaysian peat. Advances in Computing and Technology, 2007: p. 252-261.
[9] Zainorabidin, A. and H.M. Mohamad, Engineering Properties of Integrated Tropical Peat Soil in Malaysia. Electronic Journal of Geotechnical Engineering, 2017. 22(02): p. 457-466.
[10] Huat, B.B., et al., Geotechnics of organic soils and peat. 2014: CRC Press.
[11] Kazemian, S., Organic Soils and Peats, in Encyclopedia of Engineering Geology. 2017, Springer. p. 1-5.
[12] Construction Research Institute of Malaysia, Guidelines for Construction on Peat and Organic Soils in Malaysia. 2015.
[13] Morris, M., J.S. Rønning, and O.B. Lile, Detecting lateral resistivity inhomogeneities with the Schlumberger array. Geophysical Prospecting, 1997. 45(3): p. 435-448.
[14] Loke, M., Tutorial: 2-D and 3-D electrical imaging surveys. 2004.
[15] Moreira, C.A., M. Montenegro Lapola, and A. Carrara, Comparative analyzes among electrical resistivity tomography arrays in the characterization of flow structure in free aquifer. Geofísica internacional, 2016. 55(2): p. 119-129.
[16] Baines, D., et al., Electrical resistivity ground imaging (ERGI): a new tool for mapping the lithology and geometry of channel‐belts and valley‐fills. Sedimentology, 2002. 49(3): p. 441-449.
[17] Griffiths, D. and R. Barker, Two-dimensional resistivity imaging and modelling in areas of complex geology. Journal of applied Geophysics, 1993. 29(3-4): p. 211-226.
[18] Equipment, E.A., Peat Sampler Operating Instruction. Netherlands: Eijkelkamp Agrisearch Equipment, 2014.
[image:11.595.67.528.92.142.2][20] Mansor, S.H.B. and A.B. Zainorabidin, Stress-Strain Behavior of Parit Nipah Peat, in InCIEC 2014. 2015, Springer. p. 515-523.
[21] Ponziani, M., et al., Influence of water content on the electrical conductivity of peat. Int Water Technol J (IWTJ), 2011. 1(1): p. 14-21.
[22] Jakalia, I., et al., Implications Of Soil Resistivity Measurements Using The Electrical Resistivity Method: A Case Study Of A Maize Farm Under Different Soil Preparation Modes At KNUST Agricultural Research Station, Kumasi. 2015.
[23] Ling, F.N., et al. Geochemistry properties of southern Malaysian organic soil. in Applied Mechanics and Materials. 2013. Trans Tech Publ.
[24] Okpoli, C.C., Sensitivity and resolution capacity of electrode configurations. International Journal of Geophysics, 2013.
[25] El-Galladi, A., et al., Mapping Peat Layer Using Surface Geoelectrical Methods At Mansoura Environs, Nile Delta, Egypt. Mansoura Journal of Geology and Geophysics, 2007. 34(1): p. 59-78.
![Figure 1. Geological map of Parit Raja [12]](https://thumb-us.123doks.com/thumbv2/123dok_us/8748459.891355/3.595.71.516.80.589/figure-geological-map-of-parit-raja.webp)
![Figure 2. Array arrangement and pseudosection example for Schlumberger and Wenner arrays [3]](https://thumb-us.123doks.com/thumbv2/123dok_us/8748459.891355/4.595.101.500.75.459/figure-array-arrangement-pseudosection-example-schlumberger-wenner-arrays.webp)