International Journal of Emerging Technology and Advanced Engineering
Website: www.ijetae.com (ISSN 2250-2459, ISO 9001:2008 Certified Journal, Volume 3, Issue 5, May 2013)
67
Effectiveness of Knowledge Management Implementation
Enabler’s in the Indian Engineering Industries: An Integrated
Approach of ISM
Asif Ahmad
1, Dr. M. D. Singh
21Research Scholar, 2Prof. Dept. of Mechanical Engg. MNNIT Allahabad (U.P.) - India
Abstract—In the era of knowledge-based economy system,
there is only one way to achieve survival, stability and growth of the organizations. This is through knowledge management implementation. To ensure successful knowledge management Implementation, role of various enabler’s is critical. To analyze the crucial role that enablers play in carrying out knowledge management within the Indian Engineering Industries. Through a successful knowledge management Implementation Enabler’s (KMIEs) organizations improve their effectiveness and gain competitive advantage. The development of KM has led to the need of identifying its critical success factors. This study identifies and discusses the critical success factors or enablers that determine the KM effectiveness within organizations, which in turn influence the total performance of the Indian Engineering Industries. Based on existing frameworks and models, this study outlines the Twenty four most important factors that are believed to be critical for an effective KM implementation. The results of the study will help organizations to understand the impact that different enablers have on the KM successful implementation and how the effectiveness of KM affect Indian Engineering Industries.
Keywords— Knowledge Management, Knowledge Management Implementation Enabler, Interpretive Structural Modelling, dependence power, driving power.
I. INTRODUCTION
Knowledge is widely recognized as a key economic resource, and it is increasingly becoming obvious that organizations should have the right knowledge in the desired form and content under all circumstances to be successful.
In this research work, the relationships among the identified enablers using interpretive structural modeling (ISM) and classify theses enablers depending upon their driving and dependence power. ISM is a well established methodology for identifying relationships among specific enablers. Interpretive Structural Modelling (ISM) technique has been applied to develop the hierarchy of identified
Knowledge management implementation Enabler’s
(KMIEs).
The main purpose of this study was to identify and model enablers of KM for its successful implementation. Using this study, it is possible to address the complexity associated with KM initiatives by identifying enablers that are unique to every organization.
II. LITERATURE REVIEW OF KMIES
International Journal of Emerging Technology and Advanced Engineering
Website: www.ijetae.com (ISSN 2250-2459, ISO 9001:2008 Certified Journal, Volume 3, Issue 5, May 2013)
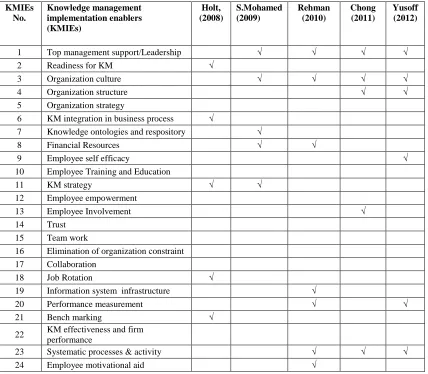
[image:2.612.95.523.158.532.2]68 TABLE I
KNOWLEDGE MANAGEMENT ENABLERS (KMIEs)
KMIEs No.
Knowledge management implementation enablers (KMIEs)
Holt, (2008)
S.Mohamed (2009)
Rehman (2010)
Chong (2011)
Yusoff (2012)
1 Top management support/Leadership √ √ √ √
2 Readiness for KM √
3 Organization culture √ √ √ √
4 Organization structure √ √
5 Organization strategy
6 KM integration in business process √
7 Knowledge ontologies and respository √
8 Financial Resources √ √
9 Employee self efficacy √
10 Employee Training and Education
11 KM strategy √ √
12 Employee empowerment
13 Employee Involvement √
14 Trust 15 Team work
16 Elimination of organization constraint 17 Collaboration
18 Job Rotation √
19 Information system infrastructure √
20 Performance measurement √ √
21 Bench marking √
22 KM effectiveness and firm performance
23 Systematic processes & activity √ √ √
24 Employee motivational aid √
III. ISM METHODOLOGY
To accomplish research goals, interpretive structural modeling (ISM) developed by Warfield (1973) was employed. In general, this method involves structuring of goals and objectives into a hierarchical framework. ISM was selected to overcome the limits that human brains in coping with complex problems of significant number of elements and relations among elements (Waller, 1975). In addition, ISM uses interactive discussion method to collect data, which forces the participant in the research study to carefully analyze links between these factors.
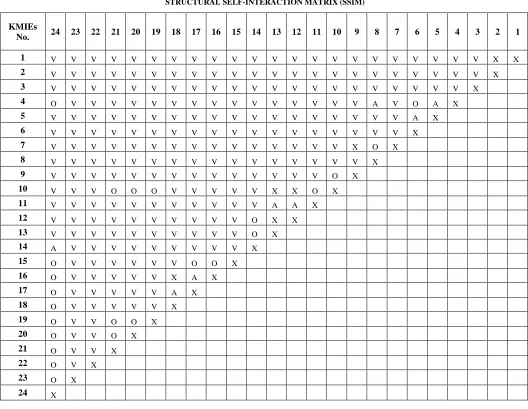
A. Structural self-interaction matrix (SSIM)
ISM methodology suggests the use of expert opinions based on management techniques such as brainstorming or nominal group discussion in developing the contextual relationships among the KMIEs. Four symbols have been used to denote the direction of relationship between the parameter i and j. Where, ‘i’ is shown on the vertical axis ‘j’ is shown on the horizontal.
International Journal of Emerging Technology and Advanced Engineering
Website: www.ijetae.com (ISSN 2250-2459, ISO 9001:2008 Certified Journal, Volume 3, Issue 5, May 2013)
[image:3.612.42.570.176.585.2]69 Taking opinion of experts SSIM has been developed as shown in Table II
TABLE II
STRUCTURAL SELF-INTERACTION MATRIX (SSIM)
KMIEs
No. 24 23 22 21 20 19 18 17 16 15 14 13 12 11 10 9 8 7 6 5 4 3 2 1
1 V V V V V V V V V V V V V V V V V V V V V V X X
2 V V V V V V V V V V V V V V V V V V V V V V X
3 V V V V V V V V V V V V V V V V V V V V V X
4 O V V V V V V V V V V V V V V V A V O A X
5 V V V V V V V V V V V V V V V V V V A X
6 V V V V V V V V V V V V V V V V V V X
7 V V V V V V V V V V V V V V V X O X
8 V V V V V V V V V V V V V V V V X
9 V V V V V V V V V V V V V V O X
10 V V V O O O V V V V V X X O X
11 V V V V V V V V V V V A A X
12 V V V V V V V V V V O X X
13 V V V V V V V V V V O X
14 A V V V V V V V V V X
15 O V V V V V V O O X
16 O V V V V V X A X
17 O V V V V V A X
18 O V V V V V X
19 O V V O O X
20 O V V O X
21 O V V X
22 O V X
23 O X
24 X
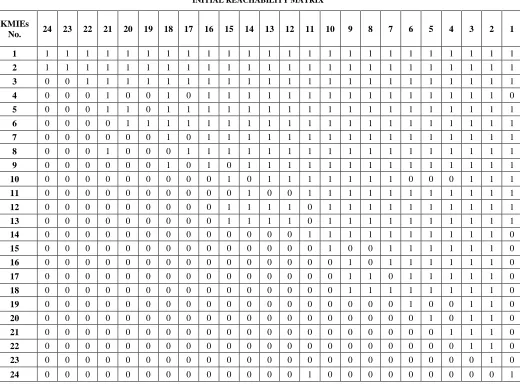
B. Development of the Initial Reachability Matrix
In this step SSIM is converted into the initial reachability matrix by transforming the information of each cell of SSIM into binary digits (i.e. ones or zeros). This transformation as shown in Table III has been done with the following rules:
1. If the cell (i, j) is assigned with symbol ‘V’ in the
SSIM, cell (i, j) entry becomes 1 and the cell (j, i) entry becomes 0 in the initial reachability matrix.
If the cell (i, j) is assigned with symbol ‘A’ in the SSIM, cell (i, j) entry becomes 0 and the cell (j, i) entry becomes 1 in the initial reachability matrix.
2. If the cell (i, j) is assigned with symbol ‘X’ in the
SSIM, cell (i, j) entry becomes 1 and the cell (j, i) entry also becomes 1 in the initial reachability matrix.
3. If the cell (i, j) is assigned with symbol ‘O’ in the
International Journal of Emerging Technology and Advanced Engineering
Website: www.ijetae.com (ISSN 2250-2459, ISO 9001:2008 Certified Journal, Volume 3, Issue 5, May 2013)
[image:4.612.49.569.149.535.2]70 TABLE III
INITIAL REACHABILITY MATRIX
KMIEs
No. 24 23 22 21 20 19 18 17 16 15 14 13 12 11 10 9 8 7 6 5 4 3 2 1
1 1 1 1 1 1 1 1 1 1 1 1 1 1 1 1 1 1 1 1 1 1 1 1 1
2 1 1 1 1 1 1 1 1 1 1 1 1 1 1 1 1 1 1 1 1 1 1 1 1
3 0 0 1 1 1 1 1 1 1 1 1 1 1 1 1 1 1 1 1 1 1 1 1 1
4 0 0 0 1 0 0 1 0 1 1 1 1 1 1 1 1 1 1 1 1 1 1 1 0
5 0 0 0 1 1 0 1 1 1 1 1 1 1 1 1 1 1 1 1 1 1 1 1 1
6 0 0 0 0 1 1 1 1 1 1 1 1 1 1 1 1 1 1 1 1 1 1 1 1
7 0 0 0 0 0 0 1 0 1 1 1 1 1 1 1 1 1 1 1 1 1 1 1 1
8 0 0 0 1 0 0 0 1 1 1 1 1 1 1 1 1 1 1 1 1 1 1 1 1
9 0 0 0 0 0 0 1 0 1 0 1 1 1 1 1 1 1 1 1 1 1 1 1 1 10 0 0 0 0 0 0 0 0 0 1 0 1 1 1 1 1 1 1 0 0 0 1 1 1
11 0 0 0 0 0 0 0 0 0 0 1 0 0 1 1 1 1 1 1 1 1 1 1 1
12 0 0 0 0 0 0 0 0 0 1 1 1 1 0 1 1 1 1 1 1 1 1 1 1
13 0 0 0 0 0 0 0 0 0 1 1 1 1 0 1 1 1 1 1 1 1 1 1 1 14 0 0 0 0 0 0 0 0 0 0 0 0 0 1 1 1 1 1 1 1 1 1 1 0
15 0 0 0 0 0 0 0 0 0 0 0 0 0 0 1 0 0 1 1 1 1 1 1 0
16 0 0 0 0 0 0 0 0 0 0 0 0 0 0 0 1 0 1 1 1 1 1 1 0
17 0 0 0 0 0 0 0 0 0 0 0 0 0 0 0 1 1 0 1 1 1 1 1 0
18 0 0 0 0 0 0 0 0 0 0 0 0 0 0 0 1 1 1 1 1 1 1 1 0
19 0 0 0 0 0 0 0 0 0 0 0 0 0 0 0 0 0 0 1 0 0 1 1 0
20 0 0 0 0 0 0 0 0 0 0 0 0 0 0 0 0 0 0 0 1 0 1 1 0
21 0 0 0 0 0 0 0 0 0 0 0 0 0 0 0 0 0 0 0 0 1 1 1 0
22 0 0 0 0 0 0 0 0 0 0 0 0 0 0 0 0 0 0 0 0 0 1 1 0
23 0 0 0 0 0 0 0 0 0 0 0 0 0 0 0 0 0 0 0 0 0 0 1 0
24 0 0 0 0 0 0 0 0 0 0 0 0 0 1 0 0 0 0 0 0 0 0 0 1
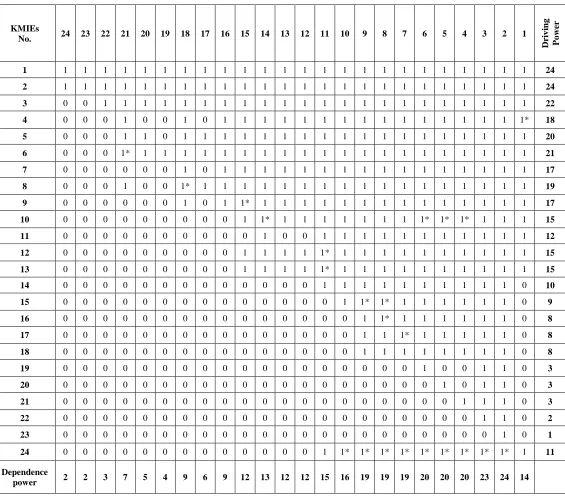
C. Development of the Final Reachability matrix
To understand the ISM methodology termed as the concept of transitivity. Transitivity can be explained with the following example. As shown in figure 1, if element ‘x’ relates to element ‘y’ (i.e. xRy) and element ‘y’ relates to element ‘z’ (yRz), then transitivity implies element ‘x’ relates to element ‘z’ (xRz). Similarly, element ‘x’ relates to element ‘w’ (xRw) then element ‘y’ shall relate to element ‘w’ (yRw).
Since, the ISM approach is based on expert opinion about these complex relationships, the literature only deals with the qualitative way to detect conceptual inconsistency.
Thus, after imposing the transitivity relationships by 1* final reachability matrix has been developed as shown in Table IV.
[image:4.612.331.558.590.659.2]International Journal of Emerging Technology and Advanced Engineering
Website: www.ijetae.com (ISSN 2250-2459, ISO 9001:2008 Certified Journal, Volume 3, Issue 5, May 2013)
[image:5.612.26.591.155.656.2]71 TABLE IV
INITIAL REACHABILITY MATRIX
KMIEs
No. 24 23 22 21 20 19 18 17 16 15 14 13 12 11 10 9 8 7 6 5 4 3 2 1
Dr
iv
in
g
Po
we
r
1 1 1 1 1 1 1 1 1 1 1 1 1 1 1 1 1 1 1 1 1 1 1 1 1 24
2 1 1 1 1 1 1 1 1 1 1 1 1 1 1 1 1 1 1 1 1 1 1 1 1 24
3 0 0 1 1 1 1 1 1 1 1 1 1 1 1 1 1 1 1 1 1 1 1 1 1 22
4 0 0 0 1 0 0 1 0 1 1 1 1 1 1 1 1 1 1 1 1 1 1 1 1* 18
5 0 0 0 1 1 0 1 1 1 1 1 1 1 1 1 1 1 1 1 1 1 1 1 1 20
6 0 0 0 1* 1 1 1 1 1 1 1 1 1 1 1 1 1 1 1 1 1 1 1 1 21
7 0 0 0 0 0 0 1 0 1 1 1 1 1 1 1 1 1 1 1 1 1 1 1 1 17
8 0 0 0 1 0 0 1* 1 1 1 1 1 1 1 1 1 1 1 1 1 1 1 1 1 19
9 0 0 0 0 0 0 1 0 1 1* 1 1 1 1 1 1 1 1 1 1 1 1 1 1 17
10 0 0 0 0 0 0 0 0 0 1 1* 1 1 1 1 1 1 1 1* 1* 1* 1 1 1 15
11 0 0 0 0 0 0 0 0 0 0 1 0 0 1 1 1 1 1 1 1 1 1 1 1 12
12 0 0 0 0 0 0 0 0 0 1 1 1 1 1* 1 1 1 1 1 1 1 1 1 1 15
13 0 0 0 0 0 0 0 0 0 1 1 1 1 1* 1 1 1 1 1 1 1 1 1 1 15
14 0 0 0 0 0 0 0 0 0 0 0 0 0 1 1 1 1 1 1 1 1 1 1 0 10
15 0 0 0 0 0 0 0 0 0 0 0 0 0 0 1 1* 1* 1 1 1 1 1 1 0 9
16 0 0 0 0 0 0 0 0 0 0 0 0 0 0 0 1 1* 1 1 1 1 1 1 0 8
17 0 0 0 0 0 0 0 0 0 0 0 0 0 0 0 1 1 1* 1 1 1 1 1 0 8
18 0 0 0 0 0 0 0 0 0 0 0 0 0 0 0 1 1 1 1 1 1 1 1 0 8
19 0 0 0 0 0 0 0 0 0 0 0 0 0 0 0 0 0 0 1 0 0 1 1 0 3
20 0 0 0 0 0 0 0 0 0 0 0 0 0 0 0 0 0 0 0 1 0 1 1 0 3
21 0 0 0 0 0 0 0 0 0 0 0 0 0 0 0 0 0 0 0 0 1 1 1 0 3
22 0 0 0 0 0 0 0 0 0 0 0 0 0 0 0 0 0 0 0 0 0 1 1 0 2
23 0 0 0 0 0 0 0 0 0 0 0 0 0 0 0 0 0 0 0 0 0 0 1 0 1
24 0 0 0 0 0 0 0 0 0 0 0 0 0 1 1* 1* 1* 1* 1* 1* 1* 1* 1* 1 11
Dependence
power 2 2 3 7 5 4 9 6 9 12 13 12 12 15 16 19 19 19 20 20 20 23 24 14
D. Partitioning of the reachability matrix
After the development of final reachability matrix
the structural model has been developed.
International Journal of Emerging Technology and Advanced Engineering
Website: www.ijetae.com (ISSN 2250-2459, ISO 9001:2008 Certified Journal, Volume 3, Issue 5, May 2013)
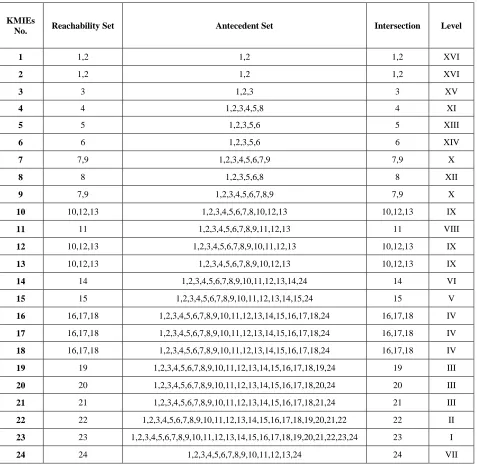
[image:6.612.70.547.157.625.2]72 TABLE V
INITIAL REACHABILITY MATRIX
KMIEs
No. Reachability Set Antecedent Set Intersection Level
1 1,2 1,2 1,2 XVI
2 1,2 1,2 1,2 XVI
3 3 1,2,3 3 XV
4 4 1,2,3,4,5,8 4 XI
5 5 1,2,3,5,6 5 XIII
6 6 1,2,3,5,6 6 XIV
7 7,9 1,2,3,4,5,6,7,9 7,9 X
8 8 1,2,3,5,6,8 8 XII
9 7,9 1,2,3,4,5,6,7,8,9 7,9 X
10 10,12,13 1,2,3,4,5,6,7,8,10,12,13 10,12,13 IX
11 11 1,2,3,4,5,6,7,8,9,11,12,13 11 VIII
12 10,12,13 1,2,3,4,5,6,7,8,9,10,11,12,13 10,12,13 IX
13 10,12,13 1,2,3,4,5,6,7,8,9,10,12,13 10,12,13 IX
14 14 1,2,3,4,5,6,7,8,9,10,11,12,13,14,24 14 VI
15 15 1,2,3,4,5,6,7,8,9,10,11,12,13,14,15,24 15 V
16 16,17,18 1,2,3,4,5,6,7,8,9,10,11,12,13,14,15,16,17,18,24 16,17,18 IV
17 16,17,18 1,2,3,4,5,6,7,8,9,10,11,12,13,14,15,16,17,18,24 16,17,18 IV
18 16,17,18 1,2,3,4,5,6,7,8,9,10,11,12,13,14,15,16,17,18,24 16,17,18 IV
19 19 1,2,3,4,5,6,7,8,9,10,11,12,13,14,15,16,17,18,19,24 19 III
20 20 1,2,3,4,5,6,7,8,9,10,11,12,13,14,15,16,17,18,20,24 20 III
21 21 1,2,3,4,5,6,7,8,9,10,11,12,13,14,15,16,17,18,21,24 21 III
22 22 1,2,3,4,5,6,7,8,9,10,11,12,13,14,15,16,17,18,19,20,21,22 22 II
23 23 1,2,3,4,5,6,7,8,9,10,11,12,13,14,15,16,17,18,19,20,21,22,23,24 23 I
24 24 1,2,3,4,5,6,7,8,9,10,11,12,13,24 24 VII
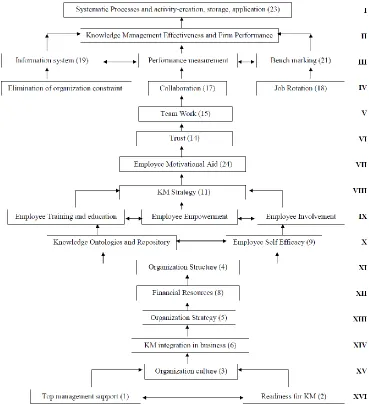
IV. DEVELOPMENT OF THE ISM MODEL
From twenty four KMIEs sixteen hierarchy levels has been tabulated.
International Journal of Emerging Technology and Advanced Engineering
Website: www.ijetae.com (ISSN 2250-2459, ISO 9001:2008 Certified Journal, Volume 3, Issue 5, May 2013)
[image:7.612.126.495.140.548.2]73
Fig. 2. ISM model showing the levels of knowledge Management Implementation Enablers (KMIEs)
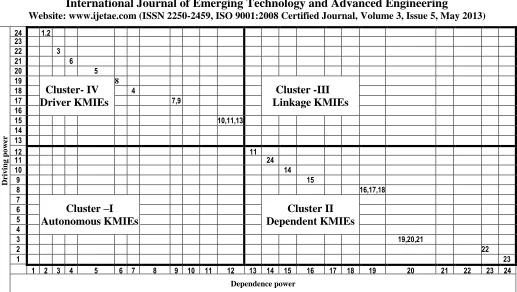
V. MICMAC ANALYSIS
Matrice d’Impacts Croises-Multiplication Applique an Classment (Cross impact matrix multiplication applied to classification) is abbreviated as MICMAC. The MICMAC principle is based on multiplication properties of matrices (Sharma et al, 1995) .The aim of MICMAC analysis is to analyze the driving power and dependence power of KMIEs. This is done to identify the key KMIEs that drive the system in various categories.
Based on their driving power and dependence power, the KMIEs, in the present case, have been classified into four categories: autonomous, linkage, dependent and driver KMIEs. Autonomous KMIEs have weak drive power and weak dependence.
International Journal of Emerging Technology and Advanced Engineering
Website: www.ijetae.com (ISSN 2250-2459, ISO 9001:2008 Certified Journal, Volume 3, Issue 5, May 2013)
74
D
ri
v
in
g
p
o
w
er
24 1,2 23
22 3
21 6
20 5
19
Cluster- IV
Driver KMIEs
8
Cluster -III
Linkage KMIEs
18 4
17 7,9
16
15 10,11,13
14 13
12 11
11 24
10 14
9 15
8 16,17,18
7
Cluster –I
Autonomous KMIEs
Cluster II
Dependent KMIEs
6 5
4
3 19,20,21
2 22
1 23
1 2 3 4 5 6 7 8 9 10 11 12 13 14 15 16 17 18 19 20 21 22 23 24
[image:8.612.49.566.109.401.2]Dependence power
Fig. 3. Cluster Formation by MICMAC Analysis
VI. RESULT AND DISCUSSION
The levels of enablers are important in understanding of
successful KM implementation. Top management
support/Leadership is the most important barrier due to its high driving power and low dependence among all the identified KM enablers. This quantified hierarchy of the KMIEs obtained from the integrated approach will provide assistance to the managers for overcoming them according to their driving power and effectiveness in the Indian
engineering industries
.
This enabler is placed at the lowestlevel in the hierarchy of the ISM-based model.An Enaler, Systematic Processes, is at the highest level in the ISM-based model due to its high dependence power and low driving power. The driving power and dependence diagram (Fig. 2) indicates that there is no autonomous enblers in the process of successful KM implementation.The absence of autonomous enablers in this study indicates that all the identified enabler influence the process of successful knowledge management.
VII. CONCLUSION &FUTURE SCOPE
In this research paper only twenty four KM enablers
have been used to develop the ISM model, but more KM
International Journal of Emerging Technology and Advanced Engineering
Website: www.ijetae.com (ISSN 2250-2459, ISO 9001:2008 Certified Journal, Volume 3, Issue 5, May 2013)
75 Thus, this approach can be applied in the future research
to test the validity of this model. ISM is a tool which can
be helpful to develop an initial model whereas AHP has the capability of statistically testing an already developed theoretical mode. Hence, it has been suggested that future research may be targeted to develop the initial model through ISM and then testing it using AHP Approach.. Analytical hierarchy process (AHP) technique has been applied to quantify the hierarchy obtained from ISM model. This quantified hierarchy of the KMIEs obtained from the integrated approach will provide assistance to the managers for overcoming them according to their driving power and effectiveness in the Indian engineering industries.
REFERENCES
[1] Safar Fazli, Ayden Alishahi (2012). Investigating the Relationships
between Organizational Factors (Culture, Structure, Strategy) and Performance through Knowledge Management.American Journal of Scientific ResearchISSN 1450-223X Issue 44 (2012), pp. 116-130(km13)
[2] Rahmatollah Gholipour,Gholamreza Jandaghi and Seyed Ali Akbar
Hosseinzadeh(2010).Explanation of knowledge management enabler as a latent variable: A case study of SMEs in Iran. African Journal of Business Management Vol. 4(9), pp. 1863-1872, 4 August, 2010.
[3] Ying-Jung Yeh, Sun-Quae Lai, Chin-Tsang Ho.(2006).Knowledge
management enablers: a case study. Industrial Management & Data Systems Vol. 106 No. 6, 2006 pp. 793-810 q Emerald Group Publishing Limited 0263-5577 DOI 10.1108/02635570610671489.
[4] Sandra Moffett,Rodney McAdam and Stephen Parkinson(2003).An
empirical analysis of knowledge management application.Jorunal of knowledge management.Vol.7 NO.3 2003,pp.6-26,ISSN 1367-3270
[5] Kuan Yew Wong(2005), Critical success factors for implementing
knowledge management in small and medium enterprises. Industrial Management & Data Systems Vol. 105 No. 3, 2005 pp. 261-279 q
Emerald Group Publishing Limited 0263-5577 DOI
10.1108/02635570510590101.
[6] Nikolaos Theriou,Dimitrios Maditinos,Georgios Theriou.
Knowledge Management Enabler Factors and Firm Performance: An empirical research of the Greek medium and large firms. Kavala Institute of Technology, School of Business & Economics, Department of Business Administration, Agios Loukas, 65404 Kavala, Tel.:0030-2510-462371.
[7] Alex Antonio Ferraresi, Carlos Olavo Quandt, Silvio Aparecido dos
Santos, José Roberto Frega, (2012),"Knowledge Management and Strategic Orientation: Leveraging Innovativeness and Performance", Journal of Knowledge Management, Vol. 16 Iss: 5 (Date online 7/8/2012).
[8] Faisal, M. N., Banwet, D. K. & Shankar, R. Supply chain risk
mitigation: modeling the enablers. Business Process Management Journal, 2006, 12(4), 535-52.
[9] Faisal, M. N., Banwet, D. K. & Shankar, R. Supply chain risk
mitigation: modeling the enablers. Business Process Management Journal, 2006, 12(4), 535-52.
[10] CHONG Siong Choy,CHOI Yong Suk.(2005). Critical Factors In
The Successful Implementation Of Knowledge Management. Journal of Knowledge Management Practice, June 2005.
[11] Alavi, M. and Leidner, D.E. (2001), ‘‘Knowledge management and
knowledge management systems:conceptual foundations and research issues’’, MIS Quarterly, Vol. 25 No. 1, pp. 107-36.
[12] Vittal S. Anantatmula, Shivraj Kanungo, (2010),"Modeling enablers
for successful KM implementation", Journal of Knowledge Management, Vol. 14 Iss: 1 pp. 100 – 113.
[13] MIAN AJMAL. Critical Factors for Successful KM Initiatives in
Project Background.Communications of the IBIMA Volume 8, 2009 ISSN: 1943-7765.
[14] Sander Moffett,Rodney McAdam and Stephen Parkinson.An
empirical analysis of Knowledge management application.Journal of knowledge management.VOL 7 NO.3 2003,pp.6-26,ISSN 1367.
[15] Susana Perez Lopez , Jose Manuel Montes Peon , and Camilo Jose
Vazquez Ordas(2009). Information Technology as an Enabler of Knowledge Management: An Empirical Analysis. W.R. King (ed.),Knowledge Management and Organizational Learning, 111 Annals of Information Systems 4,DOI 10.1007/978-1-4419-0011-1_8, © Springer Science+Business Media, LLC 2009.
[16] Safar Fazli, Ayden Alishahi(2012). Investigating the Relationships
between Organizational Factors (Culture, Structure, Strategy) and
Performance through Knowledge Management.EuroJournals
Publishing, Inc. 2012.
[17] Laith Ali Yousif AL-Hakim Shahizan Hassan. The Role of Middle
Managers in Knowledge Management Implementation to Improve Organizational Performance in the Iraqi Mobile Telecommunication Sector. Interdisciplinary Journal of Contemparary Research in business.VOL 3,NO 5.
[18] B. P. Sharma, M. D. Singh and Alok Kumar(2012). Knowledge
Sharing Barriers: An Integrated Approach of ISM and AHP.
International Conference on Information and Knowledge