Munich Personal RePEc Archive
Occupational Diversification, Offshoring
and Labor Market Volatility
Bardhan, Ashok and Tang, John
University of California, Berkeley - Haas School of Business
1 October 2006
Online at
https://mpra.ub.uni-muenchen.de/3168/
Fisher Center for Real Estate &
Urban Economics
(University of California, Berkeley)
Year Paper
Fisher Center Working Papers
Occupational Diversification, Offshoring
and Labor Market Volatility
Ashok Bardhan
∗John Tang
†∗Haas School of Business, University of California, Berkeley †Department of Economics, University of California, Berkeley
This paper is posted at the eScholarship Repository, University of California. http://repositories.cdlib.org/iber/fcreue/fcwp/299
Occupational Diversification, Offshoring
and Labor Market Volatility
Abstract
Occupational Diversification, Offshoring and Labor Market Volatility1
Ashok Bardhan and John Tang
Introduction and Motivation:
An open economy is susceptible to external shocks, and most shocks to the US economy
for instance, whether they are positive demand shocks, brought about by increasing
preference abroad for goods produced by the US, or negative supply shocks, caused by
increasing energy prices, impact the economy along sectoral lines. These are shocks to
output and to product markets, and affect the verticals or sectors of an economy, each of
which is populated by people working in a range of occupations. Manufacturing
offshoring also belongs to this category of shocks to the economy; specifically,
manufacturing offshoring impacts similar sectors, which are often parts of a cluster, e.g.
as has happened in the case of the automotive components cluster and the computer
hardware/peripherals cluster. Since the labor market matrix of an economy consists of
occupations (horizontal rows) and sectors (vertical columns), one would expect that an
occupation that is well diversified across sectors would be less susceptible and vulnerable
to these shocks, and that greater diversification of an occupation across sectors would
result in a lesser impact on the number of people employed in it.
On the other hand, in recent years a new category of external shocks has appeared which
seems to impact along occupational lines. The burgeoning literature on the phenomenon
of services offshoring has brought the occupational structure of the US labor market into
sharp focus. A number of papers on services offshoring, such as Forrester (2003),
Bardhan and Kroll (2003), Garner (2004), Jensen and Kletzer (2005) and Van Welsum
and Reif (2005) have studied the labor market impact of services offshoring from an
occupational point of view. The underlying intuition, as expressed by Garner, and
Bardhan and Kroll, is that services offshoring, unlike offshoring of manufacturing
activity, impacts the labor market along occupational lines, rather than along sectoral
lines or “verticals.” The initial premise of many of these papers, which attempted to
1
estimate the potential impact of white-collar offshoring on jobs, was that if a certain job
in an occupation, say a payroll job could be performed offshore in one sector, then other
jobs in the same payroll occupation but in other sectors were sufficiently similar to be
also shipped abroad.
These initial efforts, however, did not take into account a key issue. Assuming a
homogeneous occupation within and across sectors ignores the aspect of skill specificity.
Skill specificity is conceptually somewhat similar to asset specificity, which is a reflection of “the degree to which an asset can be redeployed to alternative uses” (Williamson, 1981). It refers to specific know-how or skills, particularly tacit skills, subsumed know-how, and inbuilt routines that have been accumulated during the work
process, as well as through learning-by-interacting and social networking at the work
place. Jobs, which are broadly in the same occupation, therefore, embody different skills
and knowledge, and vary widely depending on what is being produced by the firm, its
sectoral context, the broader business environment in which it operates, as well as on the
specific structure of the firm, its business culture, work practices and organizational
setup. An occupation that is diversified across many sectors is therefore less at-risk to
services offshoring shocks. In other words, the greater the industry-specific skill
specificity of an occupation, the lower will be the impact on it.
The US economy is vulnerable to both kinds of shocks. In the case of an output shock
therefore, including manufacturing offshoring, the impact on individual occupations in
the labor market will be mitigated by how well-diversified that occupation is across
sectors.2 Shocks from services offshoring, although channeled along occupational lines
(but not necessarily along similar, correlated occupations), are also mitigated and
qualified by the spread of an occupation across the sectors of an economy. A measure of
diversification of an occupation across the sectors of an economy would therefore serve
to proxy both the skill range, diversity and variability within an occupation, thus
2
qualifying the horizontal occupational impact, as well as mitigating the impact of vertical
shocks.
To summarize, the labor market impact on occupational employment in the case of both
i) manufacturing offshoring or other output/product shocks, and ii) services offshoring, is
mitigated by skill specificity, range and variability across sectors, which can be proxied
by some measure of occupational diversification across sectors. The basic hypotheses that
we test in this paper can therefore be expressed as: are occupations that are more
diversified across sectors less volatile in employment and hence less susceptible to shocks
(or equivalently, are more concentrated occupations more susceptible), both vertical, i.e.
manufacturing offshoring, external output shocks etc., and horizontal, i.e. services
offshoring?3 Connected to this basic question, which to our knowledge is the first such
attempt to tackle this issue, are some other related questions that we pose, such as: how is
the relationship between volatility and occupational diversification or concentration
affected by wage spread or wage inequality within an occupation, as another proxy, or
revealed expression of skill range and specificity of jobs within the same occupation but
across all sectors in an economy? How does the extent of self-employment impact
occupational employment volatility? Do the various lists of at-risk occupations, i.e.
occupations vulnerable to offshoring, compiled by Jensen and Kletzer, Bardhan and Kroll
and others behave differently than others after accounting for diversification, etc.?
Literature Review
The importance of diversification in mitigating risk in any undertaking is well-captured
by the homily “don’t put all your eggs in one basket.” In the context of finance, industrial
organization and business practice, this wisdom translates to investing in different
financial assets or sectors so as to spread the risk of failure in any one venture across
many independent ones, in effect spreading out idiosyncratic volatility. Literature on
corporate diversification across industry and product lines emphasizes multiple
motivations: besides stability of returns, which accrue from operating in independent
3
sectors that cover the entire business cycle, other theories include production synergies,
scale economies, network externalities, and strategy management.4
The idea that diversification reduces risk also appears in models of portfolio investment
and asset pricing.5 Finance literature provides a wealth of theory on the benefits of
diversification, starting with the pioneering studies by Markowitz (1952) and Tobin
(1965) on the modern portfolio theory (MPT), and Sharpe (1964) and Lintner (1965) on
the capital-asset pricing model (CAPM).
The absence of a unified theoretical basis for corporate diversification has not precluded
economists from conducting a substantial number of empirical studies that run the gamut
of the industrial spectrum. In particular, research on the positive relationship between risk
reduction and diversification includes sectors like banking6, manufacturing7, real estate8,
as well as firm-level studies on multinational expansion9 and conglomerates.10 Many
studies that have attempted to quantify the degree of corporate diversification,
specifically in the context of growth, have utilized two common measures, namely the
Herfindahl11 and entropy12 indices. Both indices measure concentration based on the
share of individual sector sales relative to overall revenues.13
4
Other terms with overlapping definitions are economic and personal rationality. For a comprehensive review of empirical studies on corporate diversification, see Ramanujam and Varadarajan (1989).
5
Alternatives to these models based on the risk-versus-return paradigm appear as arbitrage pricing and rational expectations models; for early work, see Ross (1976) and Merton (1973), respectively.
6
Demsetz and Strahan (1997).
7
Grant et al (1988).
8
Liu and Mei (1998).
9
Agmon and Lessard (1977).
10
Amihud and Lev (1981).
11
Berry (1971).
12
Jacquemin and Berry (1979).
13 The Herfindahl index is typically used to measure the concentration of a firm (or an industry); ie, the
relative proportion of sales of a firm in different industries (or the market dominance of a single
firm/oligopoly within an industry). It is calculated as the sum of squares of sales by segment (firm) over total sales (number of firms), where a single-product (firm) firm (industry) has a Herfindahl measure of one, and a highly diversified firm (industry) with a measure approaching zero: ∑i(x i /X), where i is an
index for different sectors (firms), x is the sales (market share) of given sector (firm), and X is total firm sales (number of firms).
The entropy index is similar, except it includes an inverse weighting of the segment proportion to overall sales (firms); this increases the sensitivity of the index to smaller sales (firms): ∑i[ln(X/x i)(x i /X)]. See
Surprisingly, little research has been carried out on the role of diversification or
concentration relating to a fundamental factor of production, labor. As mentioned earlier,
given that occupations differ in skill content and industry applicability, it is reasonable to
think that an occupation present in a large number of industries would reap the benefit of
diversification in the form of lower employment volatility. An occupation that is
diversified across multiple industries (eg, administrative assistants are employed in
banks, hospitals, factories, indeed in most sectors) is likely to be less susceptible to
industry shocks, e.g. as in shocks due to offshoring of manufacturing, since the risks of
job instability are spread across multiple sectors, whereas a more concentrated occupation
is more vulnerable. Of course, diversification in this sense works if most shocks are not
economy-wide and if an occupation is spread out across unrelated industries. This general
premise of the trade-off between occupational diversification and occupational
vulnerability has wide-ranging implications given the globalization of (labor) markets
and the debate on international outsourcing.
Studies that have used the occupational structure of the labor market, in addition to those
mentioned earlier dealing with the offshoring phenomenon, have done so in contexts like
urban planning, regional economics and skill intensity. Markusen (2004) advocates the
use of occupational targeting in addition to policies targeting industries in order to
ameliorate developmental differences between regions and to deal with employment
insecurity. Magnusson and Alasia (2004) discuss the differences in concentrations of
unskilled occupations between rural and urban Canada, with rural areas gaining unskilled
labor relative to urban areas in the 1990s. Autor et al (2003) find that the
computerization of occupations has decreased demand for unskilled labor, and Michaels
(2005) reports that industries with a more complex division of labor employ relatively
more clerks, with production processes and industries being defined as complex when
they require a wide range of different occupations. Michaels proxies the complexity of a
manufacturing industry as one minus the Herfindahl index of the occupations of its
employees, excluding managers, clerks, accountants, and auditors. In other words, the
Michaels paper looks at different occupations across individual sectors, or how
occupations across different sectors, or how diversified an occupation is in terms of
sectors.
Data and Results:
Our data source is the Bureau of Labor Statistics and its Occupational Employment
Statistics program, as well as its publication, the BLS Occupational Projections and
Training Data, 2006-07 edition. While the data on employment figures by occupation,
wages and wage distribution in percentiles are available from the former, the latter
provides us with data by occupational categories on the proportion of workers that are
self-employed or have at least a college degree. The BLS resorts to the Standard
Occupational Classification system for reporting occupational data, which consists of 821
detailed occupations, grouped into 23 major groups. An occupation is defined on the
basis of a common, essentially the same set of activities, functions or tasks that are
performed, regardless of the industry, as well as knowledge, specific skills and abilities
required. The SOC lists individual occupations which may have many different job titles.
It does not attempt to list all job titles in the real world, and includes workers having
different job titles, but similar job duties in the same occupation. The idea is to be
exhaustive, so that the entire labor force is covered, keep the occupations and their tasks
and duties distinctive, while retaining a reasonable number of occupations. The
classification system therefore recognizes firm and industry specific skills and functions
that individual jobs in the same occupation but in different sectors might acquire and
require.14
For our measure of diversification, we experiment with three different metrics as follows:
1) A Gini Coefficient, defined as follows:
(
)
i X i
X
j i j
Y j i
Y σ σ σ
σ − −
∑ ⎟ ⎠ ⎞ ⎜ ⎝ ⎛ + − − 1 , , 1 1
where σYi is the cumulative employment share of occupation i in industry j, and
σXi is the cumulative share of occupation i in total employment.
14
2) A Herfindahl Index:
∑
j j i
n
, 2where n is the employment share of occupation i in industry j. and,
3) An additional Metric, defined as:
2 , , ,
∑
∑
∑ ∑
∑
⎥ ⎥ ⎥ ⎦ ⎤ ⎢ ⎢ ⎢ ⎣ ⎡ − j i j j i j j i j j j i n n n nwhere n is the employment of occupation i in industry j.
All the three measures above are defined so that they lie between zero and one, with the
least diversified or most concentrated occupations (i.e. those that are present in a few
sectors) yielding measures close to one, and the well-diversified ones yielding measures
closer to zero. These measures are therefore more accurately known as measures of
concentration. The 2005 BLS matrix of 800 odd occupations and around 300 NAICS
sectors was used to calculate these measures of occupational concentration. We also
define a measure of wage spread in an occupation as the difference in wage between the
90th percentile and 10th percentile of the occupation across industries. This difference is
then normalized (i.e. divided by) using either the 10th percentile (1st version) or the 90th
percentile (2nd version) to yield two different measures; for ease of exposition, we show
results only with the first version. Our measure of employment volatility of an occupation
is defined as the standard deviation of the annual percentage change in the employment
over the period 1999 to 2005. All the other variables are for the year 2005, unless
specified otherwise.
Some of the least diversified occupations/jobs in the US are locomotive firers, animal
breeders, railroad conductors and yardmasters, motion picture projectionists, slaughterers
and meat packers, choreographers, tax preparers, and a number of occupations in the
general sphere of personal services. Among the most diversified are occupations in
management and business support, including switchboard operators, office managers and
sales managers, many back office clerical occupations, such as accounting and payroll
clerks, as well as network computer systems administrators and other information
In terms of the wage spread, or inequality measure, occupations with a very high range of
range of wages include jobs in the entertainment world such as artists, television and
radio announcers, musicians and fashion designers, plus many occupations in the world
of finance and business, such as financial advisors, real estate agents, CEOs and
professional athletes. At the low end of the wage spread are some white-collar
occupations like postal clerks, many fast food-related occupations, some mining jobs, as
well as pharmacists and laundry workers. The middle range is occupied by occupations
such as physicists and software engineers.
The self-employment variable also reveals some interesting information. While the
lowest proportion of self-employment is in some obvious occupations, e.g. legislators,
natural sciences managers and postmasters (zero percent self-employment in all of them),
jobs with a high percentage of self-employment include personal services occupations
like barbers (71 percent) and massage therapists (64 percent), some creative occupations
like writers (68 percent) and painters/sculptors (62 percent) as well as real estate brokers
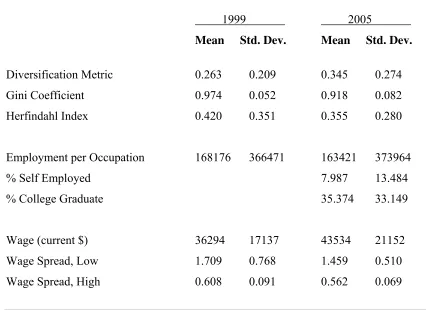
Table I: Descriptive Statistics
1999 2005
Mean Std. Dev. Mean Std. Dev.
Diversification Metric 0.263 0.209 0.345 0.274
Gini Coefficient 0.974 0.052 0.918 0.082
Herfindahl Index 0.420 0.351 0.355 0.280
Employment per Occupation 168176 366471 163421 373964
% Self Employed 7.987 13.484
% College Graduate 35.374 33.149
Wage (current $) 36294 17137 43534 21152
Wage Spread, Low 1.709 0.768 1.459 0.510
Wage Spread, High 0.608 0.091 0.562 0.069
Source: BLS; Both the numbers for Self-Employed and College Graduate are for 2004, the most recent year
available; see BLS Occupational Projections and Training Data, 2006-07 edition.
The descriptive statistics in Table 1 show that two of the three measures of
occupational concentration15 decreased between 1999 and 2005. This suggests that
across sectors all occupations on average became somewhat more diversified. At the
same time, two of the measures show increased variance, indicating that while on average
occupations became more diversified, there were also greater differences in
diversification among occupations as a whole. In addition, while the average number of
jobs per occupation decreased, the average wage of occupations increased, which
suggests a disproportionate loss of low-wage jobs.
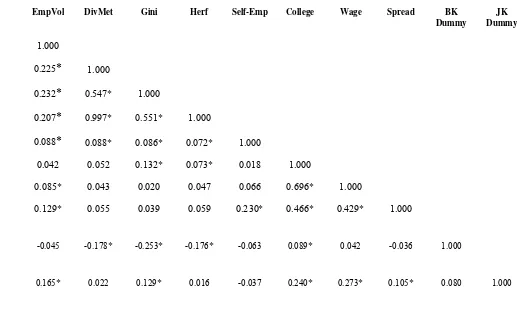
Table 2 shows the correlation matrix, and includes all the key variables including
the dummy variables for those occupations identified as tradable/offshoreable by various
15
[image:12.612.89.504.111.413.2]researchers. Bardhan and Kroll (BK) compile a list of offshoreable occupations by
matching the task descriptions of all the occupations in the US labor market to a set of
job offshoreability attributes and criteria developed by them, such as no face-to-face
contact, low social networking requirement and telecommutability. Jensen and Kletzer’s
(JK) list comprises occupations that are geographically concentrated domestically, and
hence more tradable, since clustering reflects a propensity to be mobile, and hence
exportable; theirs is an attempt to overcome the heuristic-judgement approach of Bardhan
and Kroll (BK), and settle on some objective criteria.16 We also tried to develop a
dummy based on Blinder’s (2005) classification of personal (non-tradable) and
impersonal (tradable) services. Unfortunately, his industrial sectors based approach is
difficult to translate into an occupational one.
The results from the correlation analysis show significant positive relationships
between the three concentration measures and employment volatility. This is consistent
with the interpretation that the greater the concentration of an occupation among
industries, the higher the volatility in the occupation’s employment across industries,
which gives an early hint of support for our hypothesis that diversification dampens
volatility and promotes job stability for an occupation.
A couple of other things may be noted about the correlation table. The education
variable is correlated both with the BK dummy as well as the JK dummy, suggesting that
their vision of offshoreable occupations are those embodying higher skills and
educational qualifications. The concentration variables are all negatively correlated with
the BK dummy, which is reasonable considering that their list of at-risk occupations
includes mostly very well diversified occupations like computer programmers, business
support and back office jobs. Intriguingly, this finding may partially explain the hitherto
limited impact of offshoring on these jobs. On the other hand, there is no clear
relationship between the concentration measures and the JK dummy variable. The latter,
however, is significantly correlated with employment volatility, suggesting these
occupations are vulnerable to external shocks. Another interesting piece of information
that can be gleaned from the table is that occupational concentration is positively
16
correlated with both the self-employment and college graduate variables, which may
indicate specialized skills suitable for a smaller pool of industries. College graduates
have a greater spread in wages, earn a higher average wage compared to non-graduates,
and are geographically more mobile, as indicated by the positive correlation with the JK
dummy variable. It seems that for college grads, the gain in terms of education and skills
is counteracted by a loss of diversification in terms of employment opportunities in some
sectors. The significant positive relationship between the wage spread and average wage,
indicating higher within-occupation inequality for some of the better paying careers (e.g.
musicians, professional athletes), seems to point to the winner-take-all markets that some
of these occupations operate in.
Table 3 shows the OLS regression results with employment volatility, measured
as the standard deviation of the annual occupational employment change between 1999
and 2005, as the dependent variable. As mentioned earlier, we use employment volatility
as a general proxy for the vulnerability of an occupation. The period from 1999 to 2005
provides us with a consistent dataset for all the relevant variables, with over 700
occupations, and covers those years when external shocks in the form of both
manufacturing and services offshoring had become widespread. We find that all three
measures of occupational concentration have a significant positive impact on volatility;
that is, an occupation that is more concentrated among industries is also subject to greater
job insecurity. This is demonstrated by the positive coefficient on the Herfindahl
concentration variable.17 Moreover, these results are robust to different model
specifications, like the inclusion of occupational dummy variables and interaction terms
between the control variables. Furthermore, we check the results from our diversification
measures against another variable that counts the number of “zeroes” in an occupation,
i.e. the number of sectors where there is no employment of that occupation in a particular
industry. This additional proxy for occupational concentration also corroborates our
earlier regression results. It should be noted however that the more diversified
occupations are also those employing larger numbers of people, and the more
17
concentrated ones being generally those with lesser numbers, although exceptions
abound.18
Other variables that we control for include the average wage, the wage spread (as
an auxiliary measure of skill specificity uncorrelated with diversification), and both the
proportion of self-employed workers and college graduates within an occupation across
different industries. None of these variables seem to have a consistent, significant
relationship with volatility, although high-wage occupations and self-employment do
show some vulnerability during this period in some specifications. To control for
inter-industry variation, we relax the assumption that random shocks to the labor market have
identical effects across different categories of jobs and include 22 clustered categories of
occupations as dummy variables.
Even well-diversified occupations can be susceptible to services offshoring
shocks, if those occupations fit into the Bardhan-Kroll offshoreability attributes list, i.e.
these jobs are information-based, telecommutable, and there is no personal presence
requirement. Indeed, as mentioned earlier, quite a few of the occupations listed as
vulnerable by BK are indeed well diversified across sectors. We therefore refine our
earlier regressions by controlling for the “offshoreability” criteria, using a BK dummy,
and a “geographic concentration” criterion, using the JK dummy. The BK variable (not
shown) is not significant in any specification, whereas the coefficient on the JK variable
is positive and significant, suggesting that the “tradable” occupations identified by Jensen
and Kletzer are susceptible to shocks even after controlling for diversification, perhaps an
indication that shocks impact agglomerative regions disproportionately.
We carry out a limited robustness check using the University of California, San Diego’s
National Industry-Occupation Employment Matrix: 1983-1998 Time Series database.
Although certain variables are missing for this older dataset, like wage distribution data
18
by occupation, self-employment and college education, and only occupational
employment by sector is available, we can still construct a Herfindahl concentration
measure and analyze its relationship with employment volatility between 1983 and
1998.19 The correlation between occupational concentration and volatility is positive
(0.14) and statistically significant, albeit somewhat less in magnitude when compared
with the corresponding figure for our 1999-2005 dataset from Table 2, which is 0.207.
The justification for using a “self-employment” measure is the increasing trend to insure
oneself against the vagaries of the labor market by taking refuge in a self-employed
capacity. Some specifications in Table 3 give a marginally significant positive
relationship between self-employment and volatility, but there is no consistent pattern.
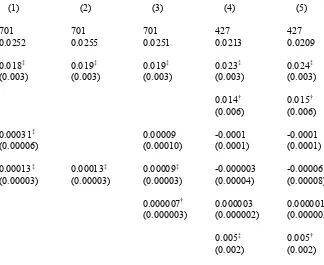
We also check for another kind of labor market adjustment, i.e. price adjustment. In other
words, we investigate the impact of diversification on the volatility of occupational
wages. Occupational diversification does appear to have a similar, significant impact on
wage volatility, as shown in Table 4. The greater the concentration of an occupation in a
few sectors, the more volatile the average wage. The only other variable with significance
is again the JK dummy, for perhaps the same reasons as before. The college education
variable is significant in some model specifications, unlike in Table 3, perhaps tentatively
hinting at easier price than quantity adjustment for some skilled jobs, particularly the
self-employed ones.
Concluding Remarks: Our analysis provides some tentative evidence that occupational
concentration is fairly well correlated with labor market volatility, and greater
diversification across industries and sectors appears to increase job security. We use a
number of other variables to qualify the result, such as a measure of wage inequality and
spread within an occupation, which proxies for skill specificity and is not correlated to
diversification, as well as self-employment and college education. Our results support the
hypothesis that workers in more diversified occupations will be less sensitive to
industry-specific shocks. We argue that this is due to their higher probability of finding similar
19
employment in a different industry. Since well-diversified jobs can also be vulnerable to
offshoring if they satisfy the “offshoreability” criteria, we control for the latter, using
dummy variables. Furthermore, the horizontal occupation-specific shocks that Bardhan
and Kroll, Garner and others have described can also be mitigated by diversification since
the latter measure proxies for skill specificity and range of know-how within an
occupation. The vulnerability of geographically concentrated tradable occupations listed
by Jensen-Kletzer, even after accounting for sectoral diversification, suggests some initial
evidence in favor of the disproportionate impact of offshoring and external shocks on
agglomerations and clusters. Of course, there are many caveats to these results. As
mentioned earlier, it might be “strength in numbers”, or a large numbers argument, since
the more diversified occupations employ larger numbers (there is no correlation with
average wages however), although it does not completely explain the results and in turn
begs further questions. Also, we have a limited time-span available for calculating
volatility (1999-2005), since data from earlier years is not compatible. On the other hand,
we do carry out a partial robustness check with data from 1983-1998. Additional data and
Table II: Correlations
EmpVol DivMet Gini Herf Self-Emp College Wage Spread BK
Dummy
JK Dummy
Employment Volatility99-05 1.000
.000
Diversification Metric20 0.225* 1
Gini Coefficient 0.232* 0.547* 1.000
Herfindahl index 0.207* 0.997* 0.551* 1.000
Self-Employed 0.088* 0.088* 0.086* 0.072* 1.000
College Graduate 0.042 0.052 0.132* 0.073* 0.018 1.000
Average Wage 0.085* 0.043 0.020 0.047 0.066 0.696* 1.000
Wage Spread 0.129* 0.055 0.039 0.059 0.230* 0.466* 0.429* 1.000
Bardhan-Kroll Dummy -0.045 -0.178* -0.253* -0.176* -0.063 0.089* 0.042 -0.036 1.000
Jensen-Kletzer Dummy 0.165* 0.022 0.129* 0.016 -0.037 0.240* 0.273* 0.105* 0.080 1.000
(Source: BLS)
20
Table III: Regression Results
Dependent Variable: Employment Volatility 1999-2005
(1) (2) (3) (4) (5) (6) (7) (8)
Observations 700 694 694 703 692 692 427 427
R-squared 0.0541 0.0610 0.0630 0.0487 0.0593 0.0637 0.1831 0.2715
Herfindahl Index21 0.0473‡ 0.0462‡ 0.0468‡ 0.0450‡ 0.0463‡ 0.0459‡ 0.0823‡ 0.0928† (0.009) (0.009) (0.009) (0.009) (0.009) (0.0087) (0.0139) (0.0163)
Average Wage 0.0000002* 0.0000002 0.0000002*
(0.0000001) (0.0000002) (0.0000001)
Wage Spread22 0.0137* 0.0110 0.0139* 0.0107 0.0203* (0.0070) (0.007) (0.0078) (0.0081) (0.0115)
Self-Employed 0.0004† 0.0003* 0.0002 -0.0003 -0.0004 (0.0002) (0.00017) (0.0002) (0.0004) (0.0004)
College Graduate -0.00005 -0.00003 -0.000009
(0.00008) (0.0001) (0.0002)
Interaction (Self-Employed 0.00001 0.00001
*College Graduate) (0.000007) (0.000008)
Jensen-Kletzer Dummy 0.0154‡ 0.0103*
(0.0052) (0.006)
Occupation Dummies23 included
21
Unless otherwise noted, all independent variables are for the year 2005.
22
This is normalized by dividing the difference between the 90th and 10th percentile wages with the 10th percentile wage.
23
These include 22 occupations at the 2-digit SOC level: management, business operations, computing/math, architecture/engineering, science, social services, legal services, education, arts/entertainment, health provision, health support services, security/protection, food services, building maintenance, personal care services, sales, administrative support services, construction, installation, manufacturing, transport services, and military.
Table IV: Regression Results
Dependent Variable: Wage Volatility, 2005
(1) (2) (3) (4) (5)
Observations 701 701 701 427 427
R-squared 0.0252 0.0255 0.0251 0.0213 0.0209
Herfindahl Index24 0.018‡ 0.019‡ 0.019‡ 0.023‡ 0.024‡
(0.003) (0.003) (0.003) (0.003) (0.003)
Wage Spread25 0.014† 0.015†
(0.006) (0.006)
Self-Employed 0.00031‡ 0.00009 -0.0001 -0.0001
(0.00006) (0.00010) (0.0001) (0.0001)
College Graduate 0.00013‡ 0.00013‡ 0.00009‡ -0.000003 -0.00006
(0.00003) (0.00003) (0.00003) (0.00004) (0.00008)
Interaction (Self-Employed*College Graduate) 0.000007† 0.000003 0.000001
(0.000003) (0.000002) (0.000003)
Jensen-Kletzer Dummy 0.005‡ 0.005†
(0.002) (0.002)
Occupation Dummies26 included
24
Unless otherwise noted, all independent variables are for the year 2005.
25
This is normalized by dividing the difference between the 90th and 10th percentile wages with the 10th percentile wage.
26
These include 22 occupations at the 2-digit SOC level: management, business operations, computing/math, architecture/engineering, science, social services, legal services, education, arts/entertainment, health provision, health support services, security/protection, food services, building maintenance, personal care services, sales, administrative support services, construction, installation, manufacturing, transport services, and military.
References
Agmon, Tamir and Donald Lessard, “Investor Recognition of Corporate International Diversification,” Journal of Finance, vol. 32, no. 4, pp. 1049-1055, September 1977.
Amihud, Yakov and Baruch Lev, “Risk Reduction as a Managerial Motive for
Conglomerate Mergers,” Bell Journal of Economics, vol. 12, no. 2, pp. 605-617, 1981.
Autor, David, Frank Levy, and Richard Murnane, “The Skill Content of Recent
Technological Change: An Empirical Exploration,” Quarterly Journal of Economics, vol. 118, no. 4, November 2003.
Bardhan, Ashok and Cynthia Kroll, “The New Wave of Outsourcing,” Haas School of Business, UC Berkeley;
www.haas.berkeley.edu/news/Research_Report_Fall_2003.pdf
Berry, Charles, “Corporate Growth and Diversification,” Journal of Law and Economics, vol. 14, pp. 371-383, October 1971.
Blinder, Alan, “Fear of Offshoring,” CEPS Working Paper No. 119, Princeton University, December 2005.
Demsetz, Rebecca and Philip Strahan, “Diversification, Size and Risk at Bank Holding Companies,” Journal of Money, Credit & Banking, vol. 29, no. 3, pp. 300-313, August 1997.
Garner, Alan, “Offshoring in the Service Sector: Economic Impact and Policy Issues,”
EconomicReview, Third Quarter 2004, pp. 5-37.
Grant, Robert, Azar Jammine, and Howard Thomas, “Diversity, Diversification, and Profitability among British Manufacturing Companies, 1972-84,” Academy of Management Journal, vol. 31, no. 4, pp. 771-801, December 1988.
Jacquemin, Alexis and Charles Berry, “Entropy Measure of Diversification and
Economic Growth,” Journal of Industrial Economics, vol. 27, no. 4, pp. 359-369, June 1979.
Jaffee, Dwight, "Globalization, Offshoring, and Economic Convergence: A Synthesis" (December 1, 2005). Fisher Center for Real Estate & Urban Economics.Fisher Center Working Papers: Paper 297; http://repositories.cdlib.org/iber/fcreue/fcwp/297
Jensen, J. Bradford and Kletzer, Lori G., "Tradable Services: Understanding the Scope and Impact of Services Outsourcing" (September 2005). Institute for International Economics Working Paper No. 05-9. Available at SSRN:
Lintner, John, “The Valuation of Risk Assets and the Selection of Risky Investments in Stock Portfolios and Capital Budgets,” Review of Economics and Statistics, vol. 47, pp 13-37, February 1965.
Liu, Crocker and Jianping Mei, “The Predictability of International Real Estate Markets, Exchange Rate Risks and Diversification Consequences,” Real Estate Economics, vol. 26, no. 1, pp. 3-39, 1998.
Magnusson, Erik and Alessandro Alasia, “Occupation Patterns Within Industry Groups: A Rural-Urban Comparison,” Rural and Small Town Canada Analysis Bulletin, vol. 5, no. 6, November 2004.
Markowitz, Harry, “Portfolio Selection,” Journal of Finance, vol. 7, no. 1, pp. 77-91, March 1952.
Markusen, Anne, “Targeting Occupations in Regional and Community Economics Development,” Journal of the American Planning Association, vol. 70, no. 3, pp 253-268, 2004.
Merton, Robert, “An Intertemporal Capital Asset Pricing Model,” Econometrica, vol. 41, no. 5, pp. 867-887, September 1973.
Michaels, Guy, “Technology, Complexity and Information: The Evolution of the Demand for Office Workers,” unpublished paper, 2005.
Ramanujam, Vasudevan and P. Varadarajan, “Research on Corporate Diversification: A Synthesis,” Strategic Management Journal, vol. 10, pp. 523-551, 1989.
Reif, Xavier and D. Van Welsum, “Potential Offshoring: Evidence from Selected OECD Countries,” Brookings Trade Forum 2005, pp165-194.
Ross, Stephen, “The Arbitrage Theory of Capital Asset Pricing,” Journal of Economic Theory, vol. 13, pp. 341-360, December 1976.
Sharpe, William, “Capital Asset Prices: A Theory of Market Equilibrium under Conditions of Risk,” Journal of Finance, vol. 19, pp. 435-442, September 1964.
Tobin, James, “Money and Economic Growth,” Econometrica, vol. 33, no. 4, pp. 671-684, October 1965.
Wallace, Nancy and Donald Walls, "Agglomeration Economies and the High-Tech Computer" (July 25, 2004). Fisher Center for Real Estate & Urban Economics.Fisher Center Working Papers: Paper 292. http://repositories.cdlib.org/iber/fcreue/fcwp/292.
Williamson, Oliver, “The Economics of Organization: The Transaction Cost Approach,”
Appendix 1
Least Concentrated Occupations or Occupations Most Diversified Across Sectors NAME OF OCCUPATION AND NUMBER EMPLOYED IN 2005
General and operations managers 1663810
Production, planning, and expediting clerks 287980
Bookkeeping, accounting, and auditing clerks 1815340
Chief executives 321300
Shipping, receiving, and traffic clerks 759910
Industrial production managers 153950
Sales managers 317970
Inspectors, testers, sorters, samplers, and weighers 506160
Maintenance workers, machinery 83220
Industrial machinery mechanics 234650
First-line supervisors/managers of non-retail sales workers 294010
First-line supervisors/managers of office and administrative support
workers 1352130
Executive secretaries and administrative assistants 1442040
Payroll and timekeeping clerks 205600
Customer service representatives 2067700
First-line supervisors/managers of helpers, laborers, and material
movers, hand 176030
Purchasing agents, except wholesale, retail, and farm products 267410
Administrative services managers 239410
Appendix 2
Most Concentrated Occupations or Occupations Least Diversified Across Sectors NAME OF OCCUPATION AND NUMBER EMPLOYED IN 2005
Funeral directors 21960
Postmasters and mail superintendents 26120
Forestry and conservation science teachers, postsecondary 2990
Prosthodontists 560
Embalmers 9840
Funeral attendants 30220
Shampooers 16040
Postal service clerks 78710
Postal service mail carriers 347180
Postal service mail sorters, processors, and processing machine
operators 208600
Animal breeders 1860
Locomotive firers 540
Subway and streetcar operators 7430
Vocational education teachers, middle school 15380
Bicycle repairers 7980
Air traffic controllers 21590
Railroad conductors and yardmasters 38330
Secondary school teachers, except special and vocational education 1015740
Middle school teachers, except special and vocational education 637340
Special education teachers, middle school 103480
Elementary school teachers, except special education 1486650
Barbers 13630
Criminal justice and law enforcement teachers, postsecondary 9880