Disk I/O Performance-per-Watt Analysis for Cloud
Computing
Joseph Issa
Department of Electrical & Computer Engineering Notre Dame University
Zouk Mosbeh, Lebanon
Abdallah Kassem
Department of Electrical & Computer Engineering Notre Dame University
Zouk Mosbeh, Lebanon
ABSTRACT
Assessing disk I/O performance and power consumption associated with a given cloud workload is important especially for workloads that are bounded by disk I/O. Disk performance becomes a bottleneck for achieving higher performance and lower power consumption especially when memory size is not enough to process large blocks of data. This will lead to a negative impact on the Quality-of-Service (QoS). In this paper, we analyze disk I/O performance by assessing the disk bandwidth and latency for different reads and writes configurations for sequential and random patterns. The systems used are based on ATOM D525 and Xeon X5660 processors. We analyze power consumption for both systems and provide a performance-per-watt optimum operation point. We also propose an estimation method which estimates disk latency at different disk queue depth settings. The estimation method is verified to estimate disk latency with < 5% error margin.
Keywords
Disk I/O performance, performance-per-watt analysis, cloud computing
1.
INTRODUCTION
[image:1.595.53.281.694.764.2]Given the rapid growth in cloud computing, more servers and hardware are added to data centers to keep up with the growing demand to process large blocks of data. This will enable data centers achieve high performance and minimum latency possible for a given request over a cloud network. In cloud computing, there are different workloads based on Hadoop[1] framework that are bound by input-output performance referred to as I/O-Bound. In other words, the performance for such workloads is bounded by disk latency (time) and throughput (operations/ second). Hadoop is based on Google's map-reduce [2][3] in which a given workload task is broken into small tasks and these tasks are distributed to be processed on different nodes in a cloud cluster. The resource utilization for these benchmarks is categorized into three categories as shown in Table 1. These three categories are as follows: I/O-bound, CPU-bound, or a combination of both I/O-bound and CPU-bound. Other workloads are memory-bound which are not discussed in this paper.
Table 1: Hadoop framework based benchmarks system resource utilization
Workload System Resource
Sort I/O-bound in both map and reduce phases
Word Count CPU-bound in both map and reduce phases
TeraSort CPU bound in map phase and I/O bound
in reduce phase
NutchIndexing I/O bound with high CPU utilizations in map stage.
Kmeans CPU-bound in iteration phase and I/O bound in clustering phase.
The throughput for any I/O-bound workload is limited by the disk latency and throughput. When more disks are added to a cloud cluster, the I/O performance will improve. On the other hand, some workloads are bounded by memory such as memcached and Terasort. When more memory is added to the server, the capacity of memory buffer will increase which in turn will reduce the data being off-loaded to the hard disks for processing.
A Hadoop cluster works using a master-slave configuration as discussed in [5] . It consists of a master node and several slave nodes, all the slave nodes are controlled by the master node. When the master node receives a task job, it will in turn assign it to a different slave node based on its availability or pending processing request. The performance metric used for these workloads is the time it takes to complete a specific job which is referred to as latency. Several factors can affect the execution time between clients and servers. In general, I/O latency can be categorized as network latency and disk latency. Both latencies are caused by moving data within a given cluster or moving data between different clusters in a cloud network. In this paper, the focus is on analyzing disk IO performance and power by presenting a disk I/O performance-per-watt analysis for different read and write patterns. This is equivalent to simulating an actual behavior in a cloud cluster using ATOM and Xeon processor based systems as described in heterogeneous cloud clusters [4].
The remaining sections of the paper are organized as follows: In Section II, we start with related work in which we compare our evaluation method to other published papers. In Section III, we discuss the disk I/O measurement methodology. In section IV we present a estimation method that estimates disk latency with respect to queue depth (QD) and conclude in section V.
2.
RELATED WORK
24 many cases, improving performance comes at the cost of
power which is not discussed in [7][8]. It is important to determine the highest performance-per-watt operating point possible for optimum operation.
The Disk I/O Performance white paper published in [9] describes a similar approach for disk I/O measurement which includes the usages of FIO tool. The paper is based on assigning different weights for different benchmarks to generate a performance score. In this paper, we used FIO to have control on the type of data traffic being generated and measure different performance metric. Our measurements and analysis are based on Xeon and ATOM systems which are mainly used in cloud clusters as servers (Xeon) and micro-servers (ATOM).
Hoste [11] determines a set of micro-architecture independent characteristics and weights these independent characteristics, resulting in locating the application of interest in the benchmark space. Performance is then predicted by weighting the performance number of a benchmark in the neighborhood of the application of interest. The approach is to use the estimation method proposed in this paper which is based on Amdahl’s law method.
3.
DISK I/O MEASURMENT
METHODOLOGY
[image:2.595.312.539.324.640.2]Several Hadoop framework based cloud workloads are bounded by disk I/O. Given the limitation in RAM size, the data being processed will have to be off-loaded to disk in order to complete the operation especially for specific servers with a small amount of memory, so the disk performance and latency becomes an important factor. Ignoring this issue will negatively affect the Quality-of-Service (QoS) for any cloud provider given the increase in the amount of time it will take to complete a specific task. A disk traffic generator FIO[10] is used to simulate the actual traffic and drive traffic load with different I/O parameters such as different read and write patterns. FIO is an I/O tool meant to be used both for benchmark and stress/hardware verification. For power measurements, a power meter is used to measure the total AC system power consumption. This is the power being consumed by the system from the wall power outlet for different load cases. System idle power is measured and subtracted from total system power consumption to measure the power differences with respect to changes in disk I/O configurations. Figure 1 shows the lab setup for power and performance measurements used for this experiment. For CPU utilization measurement, a performance monitor tool is used. A power meter (Yokogawa WT210) is used to collect power consumption in idle and load cases as shown in Figure 1. The system platform configuration for both ATOM and Xeon is summarized in Table 2.
Figure 1: Disk I/O power and power measurement setup
Table 2: Platform Configuration and Setup
Processor 1 Socket
ATOM-D525
2 Socket Xeon-WSM X5660
Socket/Core/Thread 2S/2C/2T 2S/12C/24T
Frequency 1.80GHz 2.80GHz
Last Level Cache size
1MB 24MB
Memory Size 4GB 48GB
Memory Model
DDR3-800MHz
DDR3-800MHz
IO controller 82801I/ICH9 82801JI/ICH10
Disk Drive WDC 500GB
7200 rpm
WDC 500GB 7200 rpm
Operating System RedHat
enterprise Linux 6
RedHat enterprise Linux 6
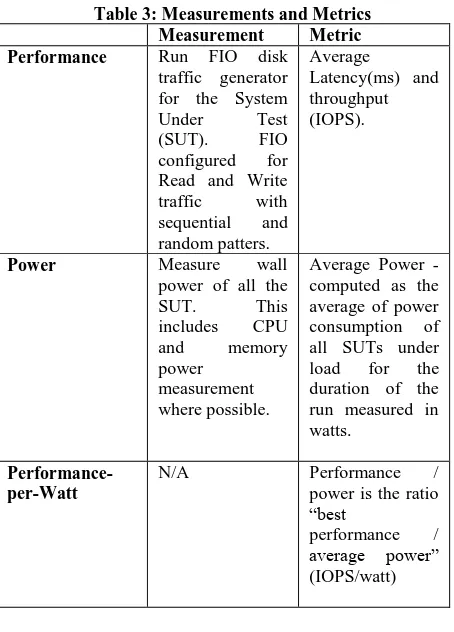
The running methodology used for this experiment is based on using one individual disk which is mounted in raw as the disk under test. The target disk is purged before each test suite. Before each run, the buffer cache is cleared and the write cache is enabled by default. The measurement metrics used for this experiment are defined in Table 3.
Table 3: Measurements and Metrics
Measurement Metric
Performance Run FIO disk
traffic generator for the System Under Test (SUT). FIO configured for Read and Write traffic with sequential and random patters.
Average
Latency(ms) and throughput (IOPS).
Power Measure wall
power of all the
SUT. This
includes CPU and memory power
measurement where possible.
Average Power - computed as the average of power consumption of all SUTs under load for the duration of the run measured in watts.
Performance-per-Watt
N/A Performance /
power is the ratio “best
performance / average power” (IOPS/watt)
3.1.
Disk Performance
[image:2.595.56.298.625.748.2]as the number of outstanding I/O on the fly. We used two different performance parameters to measure I/O performance: for random pattern, I/O operations per second (IOPS) and for sequential patterns throughput parameter which is I/O data transfer bandwidth per second (I/OBW (KB/sec)). Additional to bandwidth, disk latency is analyzed which is referred to as the round-trip response time of an I/O request.
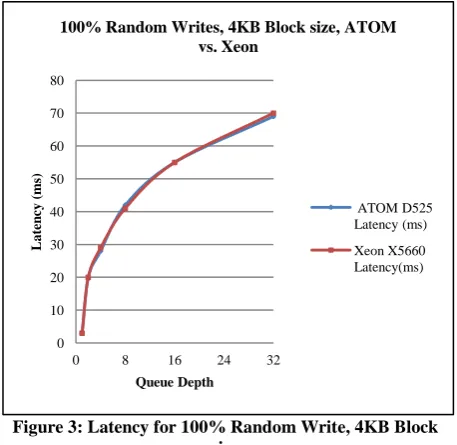
[image:3.595.314.545.133.517.2]In the first experiment, random read and write patterns are configured with 4KB data size. In Figure 2 and Figure 3, the measured data shows that the performance and latency are well correlated between both systems with slightly better performance and slightly lower latency at queue depth of 1 in random write pattern. In summary , both IO performance and latency are well matched on ATOM D525 and Xeon X5660 platform, beside 3% better performance and 3% lower latency at QD=1 in random write pattern. The latencies are proportional to QD for both read and write patterns as shown in Figure 2 and Figure 3.
[image:3.595.54.281.294.452.2]Figure 2: IOPS for 100% Random Read, 4KB Block Size
Figure 3: Latency for 100% Random Write, 4KB Block size
For the next experiment, we used 100% sequential reads for 32KB block size and measured IO bandwidth (IOBW) and latency for both systems. Both measurements are shown in Figure 4 and Figure 5. In conclusion, both IO performance
and latency are well matched on ATOM D525 and Xeon X5660 platform, beside 9% worse performance and 2% higher latency at QD=1 in sequential write pattern as shown in Figure 5. The latencies is also proportional to QD for both patterns as seen before for random pattern.
Figure 4: IOBW(KB/s) for 100% Sequential Read, 32KB Block size
Figure 5: IOBW(KB/s) and Latency for 100% Sequential Write, 32KB block size.
3.2.
Disk Power
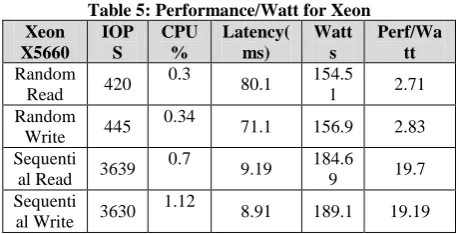
[image:3.595.54.283.486.708.2]The performance-per-watt is defined by the amount of performance (i.e. IOPS) delivered for a given system under test for every watt of power consumed. In other words, the performance-per-watt is calculated by taking the performance metric (IOPS) and dividing it by the average system power consumed. The disk I/O performance-per-watt measured on both Xeon and ATOM systems is shown in Table 4 and Table 5 for different read and write patterns.
Table 4: Performance/Watt for ATOM ATOM
D525 IOP
S
CPU %
Latency(m s)
Wat t
Perf/Wa tt
Random Read 398
1.3
78.2 32.7 12.17 Random
Write 442
1.54
71.1 32.5 13.6 Sequenti
al Read 3690 11.2
9.3 33.4 118.5 Sequenti
al Write 3690 17.3
8.8 34.9 105.7 0
50 100 150 200 250 300 350 400 450
0 8 16 24 32
IOP
S
Queue Depth
100% Random Reads, 4KB Block size, ATOM vs. Xeon
IOPS ATOM D525 IOPS Xeon X5660
0 10 20 30 40 50 60 70 80
0 8 16 24 32
L
at
en
cy
(m
s)
Queue Depth
100% Random Writes, 4KB Block size, ATOM vs. Xeon
ATOM D525 Latency (ms)
Xeon X5660 Latency(ms)
0 20000 40000 60000 80000 100000 120000 140000
0 8 16 24 32
IOB
W(
KB
/s
)
Queue Depth
100% Sequential Reads, 32KB Block size, ATOM vs. Xeon
IOBW ATOM D525
IOPS Xeon X5660
0 20000 40000 60000 80000 100000 120000 140000
0 8 16 24 32
IOB
W(
KB
/s
)
Queue Depth
100% Sequential Writes, 32KB Block size, ATOM vs. Xeon
IOBW ATOM D525
[image:3.595.311.550.652.767.2]26
Table 5: Performance/Watt for Xeon Xeon
X5660 IOP
S
CPU %
Latency( ms)
Watt s
Perf/Wa tt
Random Read 420
0.3
80.1 154.5
1 2.71
Random Write 445
0.34
71.1 156.9 2.83 Sequenti
al Read 3639 0.7
9.19 184.6
9 19.7
Sequenti al Write 3630
1.12
8.91 189.1 19.19
The objective is to determine the optimized operating point for both ATOM and Xeon systems. This means, the objective is to determine the highest performance-per-watt possible. At QD=32, the performance is well matched for both systems using random and sequential reads and writes. However ATOM shows a better performance-per-watt given the lower power consumption relative to its performance. In summary, at peak performance (QD=32), IOPS is unified performance indicator for both random and sequential patterns. The ATOM D525 shows better performance-per-watt advantages compared to Xeon X5660 for all patterns. Sequential patterns show better performance-per-watt than random patterns on both platforms.
4.
PERFORMANCE ESTIMATION
METHOD
Amdahl’s law is a simple and elegant formulation of the law of diminishing return. It states that increasing the number of processors does not lead to a proportional increase in performance. Amdahl’s law states that the performance improvement to be gained from using some faster mode of execution is limited by the fraction of the time the faster mode can be used. This means that the system’s overall performance increase is limited by the fraction of the system that cannot take advantage of the enhanced performance. Therefore, the performance of a system can be split into two distinct categories: The part which improves with the performance enhancement and is said to scale (variable a), and the part which does not improve due to the performance enhancement and is said to not scale or to be non-scaling (variable b). Based on the above definition, Amdahl’s law can be written in the form of
10 1 0
,
Q
T
T
T
T
Q
(1)where T1 is the measured execution performance at disk Queue Depth Q1 and T0 is the non-scale performance. T0 can be written in terms of a second measurement T2 at Q2:
2 2 1 1
, 0
2 1
Q Q
Q
T T
T
Q
(2)
When substituting Equation (2) for T0, we obtain Amdahl’s law in terms of two specific measurements without reference to T0:
1
,
T
a
b
Q
(3)were
2 2 1 1
2 1
,
Q T
Q T
a
Q
Q
(4)and
1 2
1 2
2 1
.
T
T
b
Q Q
Q
Q
(5)
The variables a and b can be transformed to a performance metric (P) using P = 1/T . The best estimates for a and b are those that minimize the sum of the squares of these errors:
2
1
n i i
E
e
(6) [image:4.595.316.544.403.578.2]The estimates for a and b are those at which the values of the partial derivatives E/a and E/b are simultaneously zero. By computing these derivatives explicitly, we obtain equations satisfied by the best choices for a and b, which is the best functional fit to the measured data. Amdahl's law regression method is applied for disk I/O performance parameter against disk queue depth. The parameters used for this experiment are latency and IOPS to correlate with measurements in previous section. Figure 6 shows the ATOM latency estimation curve for 100 % random Read patterns with respect to higher queue depth settings using the Amdahl’s Law regression method. The error margin between measured and predicted is ~3%.
Figure 6: Estimated vs. Measured disk latency at different queue depth settings
The Amdahl’s law regression estimation method enables the estimation of disk latency for ATOM at much higher queue depth values. A similar approach can be implemented for Xeon based system.
The second step for applying this method is to determine the maximum disk latency (ms) can be achieved at higher queue depth. We derive the values for a and b and construct a linear line in the form of a straight line equation y = ax +b. If we take the latency in Figure 6, the a and b derived values are the estimation line intercept and slope values which are calculated as 0.08571 and 0.01, respectively (y=0.08571x+0.01) for 100% Random Writes. Solving this equation at x=0, we get y=0.01 , taking the inverse of y, we get 1/y=100 which is a close approach that the latency will never go above of 100ms as queue depth increases to much high values.
0.0 10.0 20.0 30.0 40.0 50.0 60.0 70.0 80.0 90.0 100.0
0 50 100 150
L
at
en
cy
(m
s)
Queue Depth
Latency (ms) 4KB Block Size- 100% Random Reads - Estimated vs. Measured (ATOM)
Estimated(100% Random Reads)
5.
CONCLUSION AND FUTURE WORK
In this paper, we presented a performance and power analysis for sequential and random read/write patterns using ATOM and Xeon processors. The performance-per-watt analysis is implemented using two different processor architectures, Xeon and ATOM. For workloads that are I/O intensive, CPU utilization measured is relatively low (<2%). It is recommended to enable AHCI disk mode to improve disk performance. In conclusion, there is similar disk I/O performance between ATOM D525 and XEON X5660. Moreover, performance-per-watt is an advantage on ATOM compared to Xeon. For both system IOPS data are very close with about <2% difference. We also proposed an estimation method based on Amdahl's law implementation. The method verified to estimate disk latency at different disk queue depth. The error margin for predicted versus estimated is ~3%. For future work, we anticipate to modify Amdahl’s law estimation method, to enable the estimation of the performance-per-watt. In order to do that, we need to develop a power estimation model to predict power consumption at different queue depth settings.
6.
REFERENCES
[1] Hadoop: http://hadoop.apache.org
[2] D. R. Jiang, B. Ooi B., L. Shi, and S. Wu. ”The performance of mapreduce: an in-depth study”. Proceedings of the VLDB Endowment
[3] G. Wang, A. Butt, P. Pandey, and K. Gupta, “Using realistic simulation for performance analysis of MapReduce setups”. LSAP. ACM, 2009.
[4] T. Chao, H. Zhou, Y. He, and L. Zha, “A Dynamic MapReduce Scheduler for Heterogeneous Workloads”. IEEE Computer Society, 2009.
[5] J. Issa and S. Figueira, “Hadoop and Memcached: Performance and Power Characterization and Analysis”. Springer Journal of Cloud Computing:Advances, systems and Applications, 2012 [6] James Hendricks, et al., “Improving small file
performance in object-based storage”, Technical report, Carnegie Mellon University Parallel Data Lab, 2006 [7] A. Manda et al, “Provisioning and Evaluating
Multi-domain Networked Clouds for Hadoop-based Applications”, Third International Conference on Cloud Computing Technology and Science (CloudCom), 2011 [8] J. Shafer, S. Rixner, and A.L. Cox, A.L., “The Hadoop
distributed filesystem: Balancing portability and performance”, IEEE International Symposium on Performance Analysis of Systems & Software (ISPASS), 2010
[9] Disk IO benchmarking in the cloud :
http://blog.cloudharmony.com/2010/06/disk-io-benchmarking-in-cloud.html [10]FIO: http://freecode.com/projects/fio
[11]Kenneth Hoste, Lieven Eeckhout, Hendrick Blockeel “Analyzing Commercial Processor Performance Numbers for Predicting Performance of Application on Interest
[12]S. Krishnaprasad , “Uses and abuses of Amdahl’s law” December 2001 Journal of Computing Sciences in colleges” Volume 17, Issue 2