Comparative Analysis of EH-LEACH with Distinct Angles
in a Scalable Network
Swati Singh
Research Scholar CEC, Landran P.T.U, Punjab, India
Puneet Sandhu
Astt. Profesor CEC, Landran P.T.U, Punjab, India
ABSTRACT
Hierarchical routing having cluster based topology is a very propitious approach for improving throughput. Wireless sensor networks (WSNs) are distributed networks consisting of sensors deployed randomly to oversee an inaccessible area. Sensors operate on a battery of limited power. The goal of WSN is to improve network lifetime and reliability with improved throughput. Limited energy resource is the main driving factor behind increasing the throughput. LEACH is one of the eminent hierarchical routing protocol in WSN. In this paper an improvement of LEACH has been suggested. In our proposed algorithm we adopt a technique in which the nodes are clustered at four different angles in a scalable network. A rectangular network is taken and different parameters like End to End Delay and Throughput are studied at each different angle. The protocol has been simulated in Network Simulator-2 (NS-2) and results are analyzed at each different clustering angle.
Keywords
WSN, LEACH, Throughput, Energy Consumption
1. INTRODUCTION
Wireless sensor network represent a new wireless communicating paradigm for extracting data from the environment. WSN can be described as the representative non infrastructure networks that are capable of wireless communication.[5] The intelligent network has a large number of sensor nodes with micro processing capability and limited power. WSN is a distributed system consisting of wireless nodes, base station and a number of sensing devices. Wireless nodes generally consists of sensors, actuators, memory, a processor and they communicate through a wireless medium.
Figure1: Wireless Sensor Network
Sensor nodes collect data and communicate them to the central processing station known as sink. Data collected at base stations is further processed, analyzed and stored by the client. In WSN, the network layer’s primary concern is to find an optimum route from data sources to sink devices (e.g. Gateway).[7] The requirement and design of routing protocol are subject to a variety of challenges and constraints such as energy, self-management, security etc. Various metrics to gauge the performance of sensor network routing protocol include the following:
1) Energy- Energy being the main challenge, need to be minimized as sensors operate on limited battery power and also for longer duration. Thus increasing the network lifetime.
2) Throughput- Network throughput and lifetime of nodes provide insights appropriate for deploying large scale wireless sensor network.
3) End to end delay- It includes all the possible delays caused by queuing, retransmission delay at the MAC and propagation and transfer times.
4) Packet Delivery Ratio- Is the ratio of number of data packets delivered to the destination and the number of data packets sent by the sender. Data packets may be dropped en route for several reasons.
5) Latency- In sensor network, sensor nodes have to operate data to the base station. The transmission and reception of data is typically time sensitive. So the routing protocol design should be such that transmission occurs in less time.
In hierarchical routing whole network is divided into hierarchy of nodes. Hierarchical routing is superior to flat based routing protocol as the latter one faces high control packet overhead and high latency due to flooding, thus decreasing throughput as well as the lifetime of the sensor nodes. In hierarchical routing, many clustering algorithms have already been proposed. They reduce collision in the wireless sensor network and also enables the duty cycling of sensor nodes for increased energy efficiency. Yet the design of these protocols faces several confronts such as selection of cluster heads, cluster formation, additional overheads incurred during overhead change and other calculations leading to energy wastage in large sensor networks[5].
station[1]. The operation of LEACH is usually divided into rounds. Each round is further divided into set-up phase followed by the steady-state phase. Figure 2 shows different LEACH phases.
2. ENHANCED LEACH Protocol
In this research, enhanced LEACH protocol has been proposed in which the angle is optimized for partitioning the network. The cluster head is chosen by using the residual energy and the location of the nodes in the rectangular network. Scheme takes into account the selection of cluster head for extending the life time of network.
The limitation that was found in LEACH was its neglect of the residual energy. To overcome this ineffectiveness enhanced LEACH protocol uses both the residual energy and the location for choosing the cluster head.
In the enhanced LEACH protocol the rectangular network is uniformly divided into clusters. Each cluster consists of cluster head and many member nodes. N nodes are randomly distributed in S*S region space.
Simulation at different angles is done and the results of the network are studied in terms of EED and TPUT . EED refers to end to end delay and TPUT refers to throughput. First the comparison for EED, TPUT is done taking 1000*900 field at 20°. Further the result is carried out by varying the field size from 1000*900 to 1000*800 to 900*800 and clustering angle to 20°, 40° and 70°. We will now describe this methodology in detail.
Stage 1: Area partition
Firstly the network is partitioned by the sink by applying the optimum angle: that forms different clusters. Then, the is further split into by the following strategy:
0 ≤ ≤ -1
here varies from
0: .1: -1
Stage 2: Cluster head generation
The second stage is the cluster head generation. In the network based on clustering, cluster head is responsible for coordinating the operations among other sensor nodes in the cluster, collecting, fusing the data and then sending it to the sink. Thus, the load on the cluster head is more and consumes more energy. So during the generation of the cluster head, both the position and the residual energy of the node are considered. In the first round, node whose position is close to the sink is chosen as the cluster head. In the following rounds the member nodes can be the cluster heads if it satisfies both of these conditions:
1) Its location becomes closer to the sink.
2) The residual energy of the nodes must be greater than the threshold.
Stage 3: Data transmission
After the above stages, data transmission takes place i.e. nodes send their data during their allocated TDMA (time division multiple access) slot, to the cluster head. Thereafter the cluster head creates and broadcasts its own TDMA schedule which includes time slots for data transmission from member nodes to the cluster head and then from the cluster head to the sink[4]. The cluster head then fuses the data packet received from member nodes and transfers it to the sink.
3. ENERGY CONSUMPTION MODEL
The energy consumed in the network depends upon various factors: 1.Data transmission from the member nodes to the cluster head and then from cluster head to the sink. 2.Data received. 3.Energy consumed in fusing the data by the cluster head. The energy consumption model is introduced in [7]. The energy consumption for transmission and receiving the l bit message covering a distance of d meters in the power path loss channel respectively are:
(l,d)= l +l (l)= l
Where and presents the transmitter and the receiver circuit energy consumption per bit respectively. denotes the effect of antenna, amplifier and carrier frequency with the prescribed bit error rate (BER).
The energy consumed in the network depends upon various factors:
1. Data transmission from the member nodes to the cluster head and then from cluster head to the sink.
2. Data received.
3. Energy consumed in fusing the data by the cluster head. The energy consumption model is taken from[3].
The energy consumption for transmission and receiving the l bit message covering a distance of d meters in the power path loss channel respectively are:
(l,d)= l +l (l)= l
Where and presents the transmitter and the receiver circuit energy consumed. denotes the effect of antenna, amplifier and carrier frequency.
4. SIMULATION
This section covers the simulation done for Enhanced LEACH in NS-2. We use the end to end delay, throughput and packet delivery ratio for examining the sensor nodes at various angles. The parameters taken for the simulation work are presented in Table 1.
Table1. System Parameters PARAMETERS VALUES
Angle ( ) 20°,40°,70,°90°
Sink Position (50,175)
Data Packet 2000 bits
Initial Energy 0.5 J
100pJ/bit/m2 50nJ/bit 50nJ/bit Energy for Data Fusing 5nJ/bit
4.1 Snapshots showing end to end delay at
20°, 40°, 70° and 90° angles.
Figure 2 shows the network snapshot for EH-LEACH protocol for 1000*950 field area at different angles. Along the Y axis delay is taken in millisecond and X axis consists of simulation time in seconds. The total simulation time taken is 50 seconds.
Figure2: A snapshot showing End to End Delay.
4.2. Snapshots showing throughput at 20°,
40°, 70° and 90° angles.
Figure3 shows the network snapshot for EH-LEACH protocol for 1000*950 field area at different angles. Along the Y axis speed is taken and X axis consists of simulation time in seconds. The total simulation time taken is 50 seconds.
Figure 3: A snapshot showing throughput.
Figures 2 and 3 are random snapshots of the network at various angles taking different parameters.
5. RESULTS AND COMPARISON
5.1 Results for end to end delay and
throughput for 1000*950 simulation field
This section covers the results obtained for end to end delay and throughput when deploying different number of nodes at 1000*950 simulation field area.
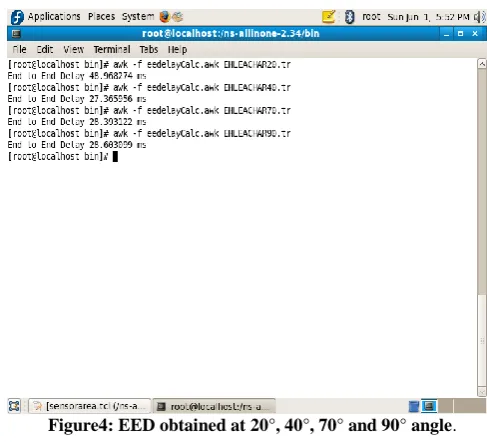
Figure4: EED obtained at 20°, 40°, 70° and 90° angle.
[image:3.595.315.564.84.317.2] [image:3.595.312.556.451.672.2]
Figure5: TPUT obtained at 20°, 40°, 70° and 90° angle.
Figure 5 shows the values obtained for PDF when 50 nodes were deployed in 1000*950 field area at 20°, 40°, 70° and 90° angles.
TABLE2: EED and TPUT at different clustering angles
EED TPUT
20° 48.96 543.84
40° 27.36 542.92
70° 28.39 545.85
90° 28.60 550.48
[image:4.595.314.546.125.334.2]Simulation results are shown in Table 2 and figures 4 and 5.
Figure 6 shows the end to end delay for enhanced LEACH at four different angles i.e. 20°, 40°, 70° and 90°. It is shown that at 90° angle the end to end delay is maximum whereas clustering the nodes at an angle of 40° will give least end o end delay.
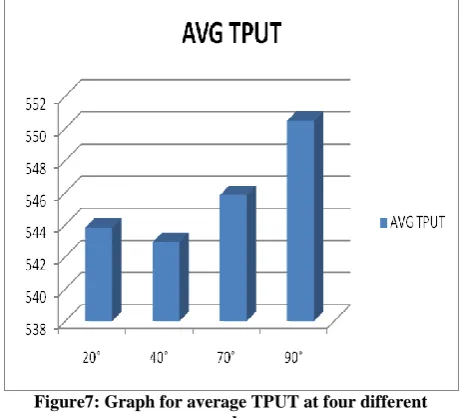
Figure7: Graph for average TPUT at four different angles
Figure 7 shows the throughput for enhanced LEACH at four different angles i.e. 20°, 40°, 70° and 90°. It is shown that at 90° angle the throughput obtained is maximum. By placing the nodes at 90° in a field area of 1000*950 will reduce energy consumption.
6. CONCLUSION
In the proposed method, we implemented Enhanced LEACH that uses both the location and the residual energy of the node. Network is partitioned by the sink by applying the optimum angle to have uniform cluster head distribution. The network constitutes rectangular grids in order to centrally place all the nodes. It is shown that as the angle is increased the throughput is also increased. Partitioning the area at 90° provides the maximum throughput. It was further analyzed that by placing the nodes at different angles in a particular field area gives different EED and TPUT at each angle. The simulations were carried out in Network Simulator (NS-2). For the future work, the simulation area can be varied and different angles other than 20°, 40°, 70° and 90° can be applied.
7. REFERENCES
[1] Jia Xu, Ning Jin, Xizhong lou, Ting Peng, Qian Zhou, Yanmin Chen, “Improvement of LEACH Protocol for WSN”, IEEE 9th
International Conference on Fuzzy Systems And Knowledge Discovery (FSKD)2012. [2] Sushant Miglani, Rajoo Pandey,“Optimization of
Clustering Probability of LEACH Protocol for Lifetime Maximization of Wireless Sensor Networks”, IEEE, International Conference on Parallel, Distributed and Grid Computing. 2012.
[image:4.595.54.287.376.521.2] [image:4.595.54.286.570.744.2][4] R.Saravanakumar,S.G.Susila, J.Raja, “An Energy Efficient Clustering Based Node Scheduling Protocol for Wireless Sensor Networks”, IEEE, 2010.
[5] Tripta Singh, Neha Gupta, Jasmine Minj,”Hierarchical Clustering Based Routing Protocol with High Throughput for Wireless Sensor Network ”, IEEE, 2013. [6] T.D. R¨aty, “Survey on contemporary remote surveillance
systems for public safety”, IEEE Trans. Syst., Man, Cybern., Part C, vol. 40, no. 5, pp. 493–515, Sep. 2010. [7] Yongming Qin, Qiuling Tang, Ye Liang, Xiuyu Yue, Xian
Li, “An Energy-Efficient Cooperative MIMO Scheme for Wireless Sensor Networks”, The 14th IEEE
International Conference on Computational Science and Engineering,2011
[8] Wendi Rabiner Heinzelman, Ananth Chandrakasan, and Hari Balakrishnan,“Energy Efficient Protocol for Wireless Networks”, Proceedings of 33rd
Hawauu International Conference.