Munich Personal RePEc Archive
Impact of globalisation? Changes in the
MTM in Poland
Chmielewski, Tomasz and Kot, Adam
National Bank of Poland, Warsaw School of Economics
13 September 2006
Online at
https://mpra.ub.uni-muenchen.de/8386/
Impact of globalisation?
Changes in the MTM in Poland
Tomasz Chmielewski
Adam Kot
∗This version: September 13, 2006
Abstract
The relationship between economic slack and inflation has been getting vague and blurred recently in the monetary transmission models supporting the MPC decision making process. This paper shows that the relationship holds robustly for inflation measures corrected for textile, footwear, audio appliances and telecom devices. The prices of those four consumption basket components have exhibited a downward trend irrespective of what is going on with the rest of consumption process for already five years. The results are supported by the evidence from VAR.
JEL Classification System: E31, E52
Introduction
The relationship between output gap and inflation is an important component of the mone-tary transmission mechanism. The output gap represents the relative position of aggregated supply and demand; the inflation builds up when demand exceeds supply. This relationship has been usually summarised in the form of a Philips curve equation, where output gap is one of the explanatory variables for the movements of inflation.
Recently the literature on factors shaping inflation started recognising that restricting the Philips curve to the domestic output gap only is not necessarily a sufficient approach.
∗Both authors: National Bank of Poland and Warsaw School of Economics.
With economies worldwide transforming towards more openness the international economic fluctuations weight increasingly more on domestic developments. The ongoing process of integration of world economy, usually referred to as globalisation, cannot be ignored by policy makers due to the impact it exercises on both domestic and international economic environment.1
In an economy strongly open to international competition the domestic cyclical position determines the inflation to a lesser extent. Positive output gap may not translate into acceleration of inflation because there are cheaper foreign-made goods that can be easily supplied. The prices may even be falling if such a direction finds support from the conditions prevailing in external economies. Similar considerations refer to a situation when output gap is negative. So in addition to the domestic output gap the inflation can be also driven by the relation of supply and demand in the country’s trading partners economies, which can be quantified by for instance some measures of the external or global output gap. This strand of thinking has been explored by i.a. Borio and Filardo (2006) [2]. The authors claim that when analysing the inflation process two approaches should be applied simulta-neously: the ”country-centric” one and the ”globe-centric” one. In the former, the inflation in a given country is exclusively influenced by the excess demand or slack in that country, ie. by the domestic output gap. The impact of international developments is fully trans-ferred to the domestic output measures and the foreign prices affect the inflation through import prices. The latter assumes that goods produced domestically and abroad are good substitutes and that capital can easily be moved cross-borders. This implies that the map-ping between the domestic output gap and domestic inflation should be supplemented by international factors, such as the global excess demand or slack measures. None of the two approaches provides a complete picture of the inflation process, so the idea is to use both when explaining inflation. In the empirical part of the paper the authors provide evi-dence that combining the ”country-centric” and ”globe-centric” factors in a Philips curve extended with the ”globe-centric” variables improves its statistical properties. They use variants of a following specification:
πt−π U
t =c+βGap D
t−1+φGap Gi
t−1+ηXt−1+ǫt (1)
where π is the inflation rate, πU is the inflation trend measured by the HP trend on core inflation, GapD is domestic output gap, GapGi
stands for various measures of global output gap, X is a set of other variables normally included in empirical Philips curves andǫ is an error term.
Based on the data from 16 industrialised economies and the euro-zone as a whole, Borio and Filardo document a decline in the sensitivity of inflation to domestic output gaps β
1
and a rise in importance of the global output gap. For the global output gap more than one proxy measure has been used2
, all of them tested in empirical specifications. The results indicate that for many countries the global gap plays a more pronounced role both in terms of statistical significance and the weight on inflation than the domestic gap. As the authors emphasise, their results are of ”the first sight” type, so still deeper analysis may be needed to confirm the findings more firmly. Moreover, the analysis presented in the paper has been limited to a number of developed economies.
The sensitivity of inflation to domestic capacity constraints in advanced economies has also been studied in the IMF World Economic Outlook (2006) [18]. The analysis has been based on the Philips curve-type inflation equation, in which the coefficient on output gap has been allowed to vary over time depending on the trade openness of the country Open, central bank credibility Credib, role of wage bargains Bargainand average deviation of inflation from the sample mean πDV
it :
πit =ci(1−φCredibit) +αi(1 +θCredibit)πit−1+
+βi(1 +γOpenDVit +λCredib DV
it +δπ
DV
it +χBargain DV
it )yit+ǫit (2)
The remaining notation is following: π – inflation, c – constant, y – domestic output gap,
ǫ – error term and DV – deviation from the sample mean. The estimates of five different variants of (2) indicate a statistically significant negative impact of trade openness on the value of β, which corresponds with Borio and Filardo results. So the response of inflation to the domestic output gap weakens with increasing openness of the economy.
The two pieces of empirical results on relationship between output gap and inflation pre-sented above refer to developed countries. The globalisation however exerts its impact on the developing economies as well. Allard (2006) [1] provides some evidence for the eight new EU member states3
. Deriving from the World Economic Outlook (2006) approach, she has estimated the following equation:
πit =απit−1 +β(1 +γT radeOpenessit)outputgapit+ǫit (3)
with import price inflation, oil price inflation and changes in exchange rate added to the regressions depending on specification. With estimates of γ significant and negative she concludes, that the sensitivity of inflation prices to domestic economic conditions in the eight NMS has been falling in the wake of higher trade integration. This implies that the impact of globalisation processes on the inflation-output relation is similar in the emerging European economies and in the advanced economies analysed elsewhere.
2
Global output gap measures have been computed as weighted sums of domestic output gaps, with different systems of weights based on data regarding external trade, import, exchange rate, GDP and mixtures of these.
3
In this paper we make an attempt to analyse further the sensitivity of inflation to output gap in Poland. Referring to the NBP inflation projection model – the so-called ECMOD – we first demonstrate that the relevance of the domestic output gap for the ”net” inflation has been diminishing recently. ”Net” inflation is the core inflation measure used as the main consumer inflation variable in the model and it is defined as CPI inflation excluding food and fuels. Next we identify those of the ”net” inflation subcomponents that seem mostly affected by the globalisation and increasing trade openness. Correcting the ”net” inflation for these subcomponents yields statistically significant relation of output and the corrected inflation in inflation equation. This result suggests that while modelling monetary transmission in Poland it would be worth considering being more explicit in dividing the inflation indices into two subcategories: tradable inflation (globalisation-affected inflation) and non-tradable inflation (domestically driven inflation). The findings based on the modifications of the NBP projection model are supported by the VAR analysis.
It has to be stressed that our results have been preliminary so far and should be considered as a first approach to the issue. Definitely more analysis is needed to provide a thorough and robust description of the impact of globalisation factors on the monetary transmission in Poland. Main difficulties are connected with short time series and lack of clear-cut con-clusions from the ongoing discussion on the channels of impact of globalisation and growing trade integration on inflation.
1
CPI inflation developments in Poland
This section presents a couple of statistics on CPI inflation developments in Poland over the course of recent years, that might shed some light on the changes in the output-inflation relationship discussed further on.
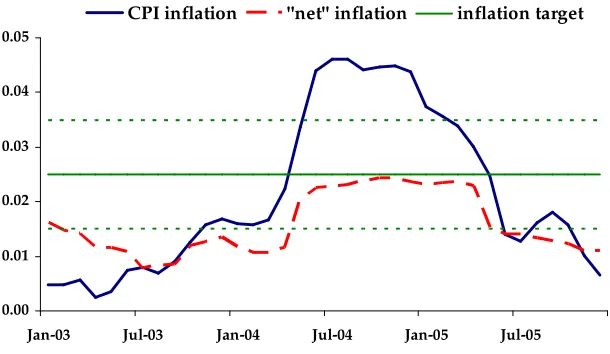
first half of 2006 saw the expected decrease in the CPI y/y figures. However, the slide was well below the inflation target. Again, the food prices developments contributed to that outcome, as in 2005 favourable conditions for agriculture production prevailed and the foreign demand for Polish meat products shrank due to Russian ban on imports from Poland. Additionally, the excise tax on fuels had been reduced in Autumn 2005, leading to fall in retail prices.
0.00 0.01 0.02 0.03 0.04 0.05
Jan-03 Jul-03 Jan-04 Jul-04 Jan-05 Jul-05
[image:6.595.143.448.235.412.2]CPI inflation "net" inflation inflation target
Figure 1:Inflation and inflation target in Poland
The above description of inflation developments clearly indicates that the 2004 inflation hike and 2005 fall can be largely attributed to the moves in food and fuel prices which are well beyond the scope of monetary policy influence. It is therefore interesting to have a look at the core inflation adjusted for these two categories. The ”net” inflation, a core inflation measure most often referred to by the NBP, suits for that purpose, as its definition excludes exactly food products and fuels from the CPI basket. ”Net” inflation is also the main consumer price index modelled in the NBP projection model. Figure 1 depicts y/y ”net” inflation. It is less volatile compared to pure CPI. The rise from about 1 per cent to slightly above 2 per cent in 2004 and subsequent fall in 2005 reflect increase in VAT rates after the EU entry. Disregarding this effect, over the recent years the ”net” inflation remained below the inflation target (as mentioned above, the target is defined for CPI, so this comparison needs caution). The average absolute deviation of ”net” inflation from the target since beginning of 2004 equalled 0.86 percentage point. The above description of developments of CPI inflation and ”net” inflation suggest there may be a downward bias, related for instance to undergoing changes in the monetary transmission which are not easy to identify at first sight.
-0.3 -0.2 -0.1 0 0.1 0.2
Jan-00 Jul-00 Jan-01 Jul-01 Jan-02 Jul-02 Jan-03 Jul-03 Jan-04 Jul-04 Jan-05 Jul-05
clothing footwear
telecommunications equipment audio equipment
[image:7.595.144.451.130.295.2]new_netcpi
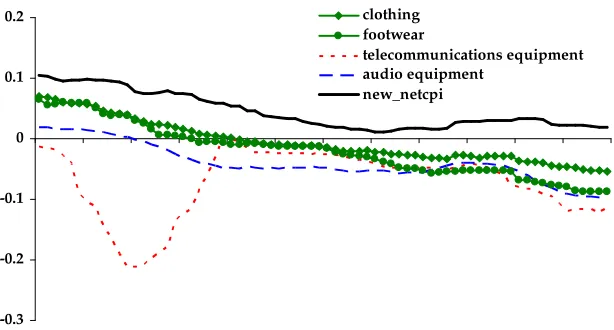
Figure 2:Subcomponents of ”net” inflation, y/y changes
equipment, audio equipment and remaining components (labelled as ”new-netcpi”) of the ”net” inflation basket. One can easily see that while the ”new-netcpi” inflation stays pos-itive during the whole 2000-2005 period, the other subcomponents of ”net” inflation have exhibited deflationary tendency for the past four years. Particularly striking is the period from 2004 on: despite the fast economic growth, positive growth of unit labour costs in economy, significant fluctuations of the exchange rate (including depreciation of nominal effective exchange rate of about 13 per cent recorded in the beginning of 2004) and ris-ing prices of many other goods and services the prices of footwear, clothris-ing, audio and telecommunication equipment have been on decrease. This suggests that the impact of lo-cal, domestic factors on the behaviour of those prices has been highly limited. Since those, with no doubt, are tradable goods, their prices are set outside Poland and depend much more on the capacity utilisation in countries like China, transportation costs or intensity of competition, which is increasing along with the increase of the openness of Polish economy. On the other hand this can also be the case that some other that the above-listed factors shape the behaviour of discussed prices, like changes in technology or fashion. These factors are however difficult to identify, disentangle and measure due to problems with access to necessary data. Table 1 presents the CPI basket weights of the subcomponents discussed above. The weights of cloths, footwear and audio and telecommunication devices are not very high; altogether they counted for 5.83 per cent of the CPI basket in 2005.
2
Relationship between output gap and inflation
2000 2005
food and non-alcoholic beverages 30.45 26.94
fuels 2.79 3.84
”net” inflation 66.76 69.22
clothes 4.42 3.50
footwear 2.01 1.46
telecommunication equipment 0.06 0.08
audio equipment 0.74 0.80
[image:8.595.160.447.128.259.2]CPI 100.00 100.00
Table 1: Weights in CPI basket
curve has been on decrease recently. We therefore propose a change in the specification that addresses the issue and improves the statistical properties of the equation by removing from the inflation index a sample of goods with prices strongly affected by international developments. The statistical properties of the entire model with the new specification of the Philips curve have not been however examined.
The main model on which the monetary decision process in the NBP is based is called ECMOD. There are also other policy models in regular use in the Bank, however since mid-2005 inflation projections published in Inflation Reports are derived just from the ECMOD. ECMOD is a multi-equation econometric model belonging to the class of hybrid models4
.
Following the definition of the inflation target, the central inflation variable in the model is the CPI index. The behavioural inflation equation is however defined in terms of ”net” inflation index, a core inflation measure presented in the previous section. The reason behind this is the historically high volatility of food prices and fuel prices that is well behind the scope of influence of any factors that can be easily embedded into the model5
. The specification of the inflation equation is the following ECM:
∆netcpit=α+β(netcpit−1−(a+b·ulct−1+c·impprt−1)) +γgapt+δXt+ǫ (4)
where netcpi is the log of ”net” inflation price level, ulc is the log of unit labour costs level, imppr is the log of import price level, gap is the output gap and X represents other variables influencing inflation in the short run (these may be lagged inflation, increase in unit labour costs, increase in import prices etc., other lags than zero indicated in (4) are allowed). The long-run component builds on the cost-push approach to inflation, wheras the demand-pull effects are captured in the short-run via for instance output gap.
4
More information on ECMOD can be found in Fic et al. (2005) [8]
5
Along with the whole model, the equation is subject to reestimation, performed usually once a year unless any special circumstances occur (like for instance serious revisions of national accounts data going back as far as to 1995, published by the National Statistical Office in the end of 2005). It is interesting to see how is the γ coefficient, i.e. the sensitivity of inflation to output gap, evolving over time. For that purpose we estimate the inflation equation (4) on a series of extended (with rolling end points) samples, starting from 1997q1-2002q1 and ending at 1997q1-2005q4. The long run equation has been estimated on the sample 1995q1-2005q4 and yielded following results:
log(N ET CP I) = 1.61 + 0.65log(U LC) + 0.35log(IM P P R(1 +GT AR)) + 0.89DL (5)
with notation the same as in (4). Additional terms areGT AR which are the custom duties and import taxes applicable in nineties and DL– an artificial variable used to quantify the growth of ”net” inflation faster than the cost determinants of inflation (U LC andIM P P R) recorded in the sample.
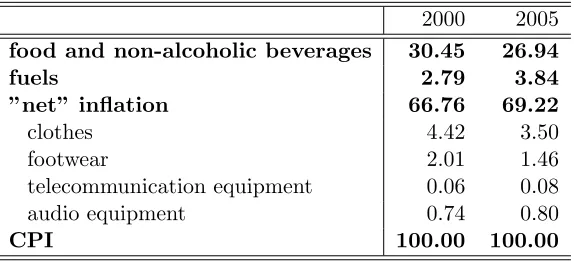
The short term equation was estimated on a series of extended samples of data, with different specifications (different variables substituted for X), for which the signs were in line with theory and significant. Figure 3 presents the resulting values of coefficients on output gap andt-Statitics6
. It can be seen thatγ used to be at 0.2-0.4 and significant prior to 2003. In 2003 the value of γ gets lower and loses statistical significance. From 2004 on the output gap is no longer a variable significantly affecting the inflation.
[image:9.595.78.530.452.590.2]-0.1 0 0.1 0.2 0.3 0.4 0.5 1 9 9 7 q 1 -2 0 0 1 q 2 1 9 9 7 q 1 -2 0 0 1 q 4 1 9 9 7 q 1 -2 0 0 2 q 2 1 9 9 7 q 1 -2 0 0 2 q 4 1 9 9 7 q 1 -2 0 0 3 q 2 1 9 9 7 q 1 -2 0 0 3 q 4 1 9 9 7 q 1 -2 0 0 4 q 2 1 9 9 7 q 1 -2 0 0 4 q 4 1 9 9 7 q 1 -2 0 0 5 q 2 1 9 9 7 q 1 -2 0 0 5 q 4 -1 0 1 2 3 4 5 1 9 9 7 q 1 -2 0 0 1 q 2 1 9 9 7 q 1 -2 0 0 1 q 4 1 9 9 7 q 1 -2 0 0 2 q 2 1 9 9 7 q 1 -2 0 0 2 q 4 1 9 9 7 q 1 -2 0 0 3 q 2 1 9 9 7 q 1 -2 0 0 3 q 4 1 9 9 7 q 1 -2 0 0 4 q 2 1 9 9 7 q 1 -2 0 0 4 q 4 1 9 9 7 q 1 -2 0 0 5 q 2 1 9 9 7 q 1 -2 0 0 5 q 4
Figure 3:Impact of output gap on ”net” inflation measure – the results of estimations on rolling (extended) samples. Left panel: Range of values for coefficient γ. Right panel: range of values fort-statistics
So what has happened? Has the difference between domestic actual and potential output lost its ability to impact inflation process? One of the possible explanations is based on the disaggregation of the ”net” core inflation measure signalled in the previous section.
6
For the ease of reference denote the ”net” CPI index excluding the prices of cloths, footwear, telecommunication and audio equipment by ”new-netpci”. As can be read from the table 1, the share of ”new-netcpi” in the CPI stood at 63.4% in 2005.
The idea is to apply the ”new-netcpi” instead of ”net” inflation measure in the infla-tion equainfla-tion with specificainfla-tion equivalent to (4). The long-run equainfla-tion estimated on the 1999q1-2005q4 sample yields:
log(N EW N ET CP I) =−4.99 + 0.83log(U LC) + 0.17log(IM P P R(1 +GT AR)) + 1.47DL
(6) The notation remains the same as in equation (5). It is worth noting that the coefficient on unit labour costs has increased (from 0.65 in equation (5) to 0.83 in (6)) and the coefficient on import prices diminished (from 0.35 in (5) to 0.17 in (6))7
. The interpretation is pro-intuitive: the impact of domestic factors on inflation is greater in case of ”new-netcpi” whereas the impact of external factors is lower.
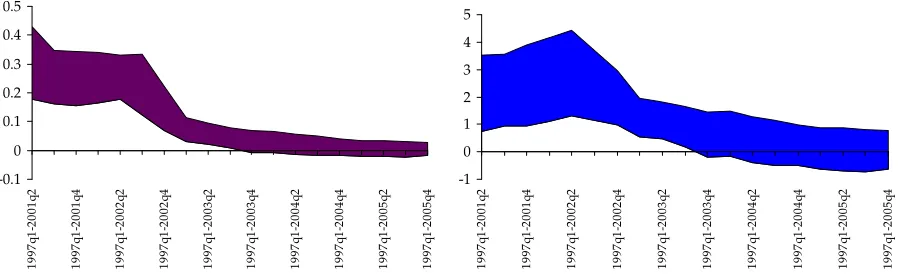
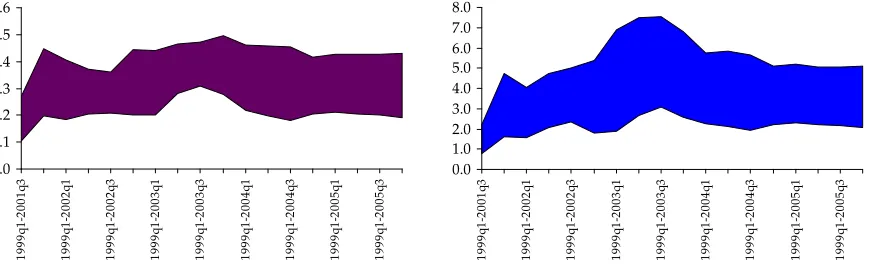
[image:10.595.86.522.434.568.2]Similarly to what has been done in the case of ”net” inflation short-term equation, we have estimated a number of different short-term specifications for the ”new-netcpi” index. The resulting coefficients on output gap along with respective t-statistics are presented on Figure 4. Contrary to the ”net” inflation case presented on Figure 3, the coefficients γ stay in the range 0.1-0.5 and are significantly different from zero.
0.0 0.1 0.2 0.3 0.4 0.5 0.6 1 9 9 9 q 1 -2 0 0 1 q 3 1 9 9 9 q 1 -2 0 0 2 q 1 1 9 9 9 q 1 -2 0 0 2 q 3 1 9 9 9 q 1 -2 0 0 3 q 1 1 9 9 9 q 1 -2 0 0 3 q 3 1 9 9 9 q 1 -2 0 0 4 q 1 1 9 9 9 q 1 -2 0 0 4 q 3 1 9 9 9 q 1 -2 0 0 5 q 1 1 9 9 9 q 1 -2 0 0 5 q 3 0.0 1.0 2.0 3.0 4.0 5.0 6.0 7.0 8.0 1 9 9 9 q 1 -2 0 0 1 q 3 1 9 9 9 q 1 -2 0 0 2 q 1 1 9 9 9 q 1 -2 0 0 2 q 3 1 9 9 9 q 1 -2 0 0 3 q 1 1 9 9 9 q 1 -2 0 0 3 q 3 1 9 9 9 q 1 -2 0 0 4 q 1 1 9 9 9 q 1 -2 0 0 4 q 3 1 9 9 9 q 1 -2 0 0 5 q 1 1 9 9 9 q 1 -2 0 0 5 q 3
Figure 4:Impact of output gap on ”new-netcpi” inflation measure – the results of estimations on a rolling sample. Left panel: Range of values for coefficient γ. Right panel: range of values fort-statistics
The above results are somewhat striking in suggesting that removing only a small part (counting for about 6%) of the ”net” inflation basket enables to counteract the issue of disappearing impact of the output gap on inflation. Since the patterns of ”new-netcpi” prices and those of cloths, footwear, audio and telecommunication devices differ visibly for still a rather short time, the findings should be regarded as preliminary and confirmation
7
through other analysis would be welcome. We attempt to do so in the next section by estimating a VAR that has appeared to support these results. On the other hand the findings are consistent with intuition and international evidence pointing to a growing international openness of economies and globalisation processes that limit the impact of domestic factors on inflation and enhance the importance of international factors. Moreover, the results indicate certain policy challenges for monetary authorities: change in the sacrifice ratio, necessity to analyse other, non-standard decomposition of the inflation measures and need to monitor more closely external economic developments.
3
Evidence from VAR
It is interesting to check whether findings presented in the previous section also hold in a more general modelling framework of VAR models. Unfortunately, results presented in this section might be interpreted only as indicative ones. Due to short ”new-netcpi” time series available and therefore a relatively small number of degrees of freedom left the results presented below are far from being statistically significant. We believe, however, that even analysis of differences in point estimates might be of interest, as it indicates at least need for some future research.
We estimate a small VAR model consisting of the following variables: the output gap, a measure of price level, the short term domestic interest rate and the effective exchange rate (in that order). Following discussion in the previous sections, ”netcpi” and ”new-netcpi” series are used as alternative measures of price level. We are interested whether there are differences in reaction of these alternative measures of prices after a monetary policy shock and after a shock to the output gap.
Generally, we follow the approach presented by Peersman and Smets (2001) [13]. The VAR model is estimated in levels8
and the standard Cholesky decomposition is applied in order to identify shocks. In order to diminish problems of ”price puzzle” the lagged oil prices (in logs) have been added as an exogenous variable. Due to a small number of observations available we looked carefully at the order of the VAR model. Introducing two lags proved to be necessary to ensure a good behaviour of residuals.
We present here the impulse response functions for ”netcpi” and ”new-netcpi” after a shock to the interest rate and a shock to the output gap. As indicated above, the difference in behaviour of these two variables is far from being statistically significant. Therefore, we concentrate here on point estimates.
Figure 5 shows that despite some attempts there is still a sign of ”price puzzle”. However, in the case of ”new-netcpi” this problem is much smaller. This result supports the intuition that monetary policy might be more efficient in controlling ”new-netcpi”.
8
-0.25% -0.20% -0.15% -0.10% -0.05% 0.00% 0.05% 0.10% 0.15% 0.20% 0.25%
1 2 3 4 5 6 7 8 9 10 11 12 13 14 15 16
Quarters
[image:12.595.169.438.162.315.2]netcpi new-netcpi
Figure 5:Impulse responce function after a shock to interest rate
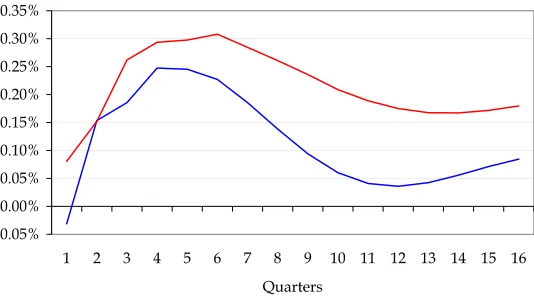
-0.05% 0.00% 0.05% 0.10% 0.15% 0.20% 0.25% 0.30% 0.35%
1 2 3 4 5 6 7 8 9 10 11 12 13 14 15 16
Quarters
netcpi new-netcpi
Figure 6:Impulse response function after a shock to output gap
[image:12.595.170.437.431.581.2]might have some implications forsacrifice ratio. Therefore, these results suggest a need for further research, as this issue might be of relevance for monetary policy makers.
4
Concluding remarks
The discussion and statistical evidence presented in the paper suggest that the explanatory power of domestic economic slack for inflation in Poland has been on decrease. To maintain statistical significance of the relationship between output gap and inflation one needs to narrow the inflation index, excluding items prices of which do not follow the domestic devel-opments but depend more on external factors. This result pointing to a blurring relationship between the domestic output gap and inflation is consistent with the other findings in this area published recently that attribute this phenomenon to fast growth in the international trade and increasing openness of economies, often referred to as ”forwarding globalisation processes”. The impact that these processes exert on the monetary transmission mechanism seems in the Polish case to stay in line with common intuition: the numbers and equations identified in previous sections point that the domestic economic slack keeps affecting sig-nificantly the domestic part of inflation. In a meantime however, the truly domestic part of inflation keeps shrinking.
Faced with the above, an amendment to the approach to analysing and modelling inflation process in the NBP seems worth considering. Namely, beside the traditional division of CPI index into food-prices, fuel prices and ”net” inflation, adomestic factors drivenandexternal factors driven inflation sub-indices could be defined, analysed and modelled on a regular basis. The proposed new division is not far from the tradable inflation and non-tradable inflation indices that are built and discussed in many central banks worldwide.9
Defining those indices is neither a straightforward nor obvious task since for every component of the consumption basket one has to determine the proportion of its ”tradeability” and ”non-tradeability”. These proportions may not necessarily be constant over time.
The results have also bearing on the sacrifice ratio, i.e. how much of output an economy needs to sacrifice to reduce inflation by a given amount. With diminishing impact of do-mestic output gap on inflation the sacrifice ratio increases. To reduce inflation central bank now needs more contraction in output, all else equal. The fall in the sacrifice ratio may also be a result of increase in the credibility of a central bank and better anchoring of inflation expectations on the target. In such a case central bank communication policy gains impor-tance and deserves more emphasis. These issues are of a potentially significant imporimpor-tance for monetary authorities and a proper approach to managing them may pose a challenge.
9
When interpreting the results presented in the paper one should keep in mind that they may depend on the specification of equations and models used in the analysis. By setting ECMOD equations against VAR models we have examined the problem from two angles, but it would also be interesting to see it from some other points of views as well. Hence this paper should be regarded as a ”first-order approximation” to the changes in the Polish monetary policy transmission induced by intensifying globalisation.
References
[1] Allard C., Inflation in Poland: How Much Can Globalisation Explain?, paper pre-sented during the IMF Article IV Mission to Poland, May 2006.
[2] Borio C., A. Filardo, Globalisation and inflation: New cross-country evidence in the global determinants of domestic inflation, BIS, draft, 23 March 2006
[3] Cechetti S., G. Debelle, Has the inflation process changed?, BIS Working Paper, November 2005
[4] Ciccarelli M., B. Mojon,Global Inflation, ECB Working Paper 537, October 2005
[5] Corvoisier S., B. Mojon, Breaks in the mean inflation. How they happen and what to do with them, ECB Working Paper 451, March 2005
[6] Czech National Bank, Inflation Report January/2004, January 2004.
[7] Elmeskov J., J.P. Martin, S. Scarpetta, Key Lessons for Labor Market Reforms: Ev-idence from OECD Countries Experiences, Swedish Economic Policy Review, 2002, Vol. 5, No. 2, pp. 20552.
[8] Fic T., M. Kolasa, A. Kot, K. Murawski, M. Rubaszek, M. Tarnicka,ECMOD Model of the Polish Economy, MateriaÃly i Studia No. 36, NBP, October 2005.
[9] Laxton, D., P. NDiaye, Monetary Policy Credibility and the Unemployment-Inflation Trade-Off: Some Evidence from 17 Industrial Countries, IMF Working Paper 02/220, 2002.
[10] Monetary Policy Council, Monetary Policy Strategy beyond 2003, NBP, February 2003.
[11] Globalizacja – kanaÃly oddziaÃlywania na inflacje. Przeglad literatury empirycznej, NBP, mimeo, 2006
[13] Peersman G., F. Smets,The monetary tramsnission mechanism in the euro area: more evidence from VAR analysis, ECB Working Paper 91, December 2001.
[14] Rogoff K.,Globalization and Global Disinflation, in ”Monetary Policy and Uncertainty: Adapting to a Changing Economy”, a symposium sponsored by the Federal Reserve Bank of Kansas City, August 28 - 30, 2003, Jackson Hole, Wyoming, pp. 77-112.
[15] Rogoff K.,Disinflation: An Usung Benefit of Globalisation, Finance and Development, December 2003
[16] Wagner H., Implications of Globalization for Monetary Policy, SUERF Studies no. 17, 2002.
[17] Sveriges Riksbank, Inflation Report 2006:2, June 2006