Sanitation and Its Impact on Health: A Study in Jorhat,
Assam
Dr. Minakshi P. Hazarika
Associate Prof. J.B. College, Jorhat
Abstract- Sanitation is a burning problem of our society. About 1/7th of the world’s population still defecates in the open in absence of toilets, of which 60% lives in India1. According to the latest estimates of the WHO/UNICEF Joint Monitoring Programme for Water Supply and Sanitation (JMP), released in early 2013 (collected in 2011), 36 per cent of the world’s population – 2.5 billion people – lack improved sanitation facilities, and 768 million people still use unsafe drinking water sources2. The lack of adequate sanitation and safe water has significant negative impacts on health. This is a cause of great concern as 88% of deaths in diarrhoea occur because of unsafe water, inadequate sanitation and poor hygiene. Inadequate access to safe water and sanitation services, coupled with poor hygiene practices, kills thousands of children every year.
According to the father of our nation M.K. Gandhi – “Sanitation in a community is more important than independence”. He said “Sanitation is based upon common spiritual effort in a community like ours, and it is also a basic human right”. Gandhi was an environmentalist of remarkable foresight and vision. He was aware that toilets are the link between good and bad environment. Sanitation is one of the most neglected sectors in India even today. More people have access to mobile phones than to a toilet according to a UN Study on how to improve sanitation globally. The goal of UNICEF is to halve, by 2015, the proportion of people without sustainable access to safe water - has been achieved globally, but the same target for sanitation is so far off track that it is unlikely to be met by 2015. The WHO/UNICEF joint monitoring programme for water supply and sanitation has said that at its present pace, India would take time till 2054 to meet its millennium development goals 2015 on sanitation.
A survey, published by the Urban Development ministry shows how basic infrastructure, especially sanitation, cannot keep up with the fast growth of Indian cities. The survey examined 1405 cities in 12 different States and found out that around 50% of these cities don’t have a proper water supply system. Even if the households have access to piped water in around 80% of these households the average supply is less than five hours per day. Concerning sanitation the numbers are even worse: Over 70% of the households in the analyzed cities don’t have access to toilets or a sewerage system. A researcher in Mumbai linked toilet situation directly to their health, especially
1 UNO & UNOCEF - www.healthissuesindia.com/poor-sanitation visited on
30th Jan, 2014
2 UNICEF – Water, Sanitation & Hygiene www.unicef.org/wash visited on
28th Jan, 2014
a high incidence of urinary tract and bladder infection for which water is vital to stave off such infections3.
In Assam, there are more than 12 lakh households, which have not had access to toilets. Human sewage poses the biggest threat to our rivers, lakes, ponds and the ground water table. It is seen that 80% pollution in Indian rivers is due to excreta and the impact of this on public health is catatrosphic. Poor quality drinking water and santitation is the second largest killer in India, malnutrition being the first4. In this paper, an attempt is being made to assess the status of sanitation and its impact on the health of the people in Jorhat. Three areas have been identified to make a comparative study, i.e. a rural area on the outskirts of Jorhat ie Pokapura village, a tea garden ie Hunwal tea estate in the district and two pockets from the slums of Jorhat municipal area.
Index Terms- Sanitation, health, facilities, neglected sectors
I. INTRODUCTION
ccording to WHO, “Sanitation generally refers to the provision of facilities and services for the safe disposal of human urine and faeces”5. It refers to the maintenance of hygienic conditions through services such as garbage collection and waste disposal. Sanitation is the hygienic means of promoting health through prevention of human contact with the hazard of wastes as well as the treatment and proper disposal of sewage waste water6.
However, in India, sanitation remains the most neglected sectors whereas human sewage poses the biggest threat to our rivers, lakes, ponds and the ground water table. Every river that passes through a city or a town today becomes a stinking sewer. Proper sanitation thus not only means clean toilets but also a healthy environment for the citizens, as there is proper disposal of physical and microbiological agents causing diseases. It has been estimated that less than 48% of urban and just about 3.15% of rural population in India have access to toilets.
No doubt access has also increased significantly. For example, in 1980 rural sanitation coverage was estimated at 1% and reached 21% in 2008. Also, the share of Indians with access to improved sources of water has increased significantly from 72% in 1990 to 88% in 2008. One of the most significant
3
Research by Kamakshi Bhatti on Health of female residents in Mumbai.
4 Muck Tale on Down to Earth, October, 2006.
5 en.wikipedia.org/wiki/Sanitation visited on 29jan, 2014 6 en.wikipedia.org/wiki/Sanitation visited on 29jan, 2014.
diseases that arise from poor sanitation is diarrhoea. Deaths resulting from diarrhoea are estimated to be between 1.6 and 2.5 million deaths every year (Mara, Lane and Scott and Trouba ). Most of the affected are young children below the ages of five. Other diseases that are caused by poor sanitation include schistosomiasis, trachoma, and soil transmitted Helminthiases. Poor sanitation accounts for almost 50 percent of underweight child since it has a direct link to diarrhoea.
In Assam, the Public Health Engineering Department (PHE) is implementing the Total Sanitation Campaign. The department had set a target of bringing 22,20,017 BPL households under the sanitation programme. Of this, so far 16,59,966 households have been covered and 5,60,051 households remain to be covered. The PHE department had set a target of covering 11,61,020 Above Poverty Line (APL) households under the Total Sanitation Campaign. Of these, 4,31,720 APL households have been covered and 7,29,300 households remain to be covered. The PHE Department must work rapidly to provide sanitation facilities to these households in order to achieve the ambitious sanitation target under the Total Sanitation Campaign.
II. OBJECTIVES
1. To assess the status of sanitation and drinking water in and around Jorhat.
2. To study its impact of sanitation and drinking water on the health of the people.
III. METHODOLOGY
Sample Design: This study has been carried out with primary survey at the designated areas i.e. the two selected slum pockets in an urban area, a typical rural village and a tea garden. This has been done so that three different areas are represented and at the same time three different samples are collected. The slum area represents a mixed group of people coming from
different areas of not only Assam but also different parts of India. Jorhat Municipality has identified 7 slum pockets of which 2 has been chosen, one from the central area and the other from the peripheral area of Jorhat city. The tea garden population again shows 3rd & 4th generation immigrants brought by the British in 19th century as well as Nepali people. The rural village shows original Assamese inhabitants living in the area with traditional occupations, mostly farming for generations.
Sample Selection & Size: The samples were selected with judgement sampling, so that different income groups of people get represented in the surveyed area. An equal number of samples i.e. 30 samples were selected to represent each area, with a total of 120 samples and a sampled population of 675 in this study. The collected samples were tabulated and processed and presented in the form of written text supplemented by illustrations as and when required. Secondary data were collected from books, journals, newspapers, and concerned government and private offices.
Jorhat municipal area covers 9.20sq.km. and comprises of 19 wards and has a population of 85,704 persons and the slum population is 65,949 persons covering an area of 1.39 sq.km. (Source: Municipal Record, 2001). There are seven slum pockets of which two areas Harijan Colony and Puja Dubi area have been chosen.
Hunwal Tea Estate is a plantation under Williamson Magor group, which is the largest tea plantation group producing over 75 million kg annually. It is located in southern part of Jorhat district near the foothills of Nagaland.
Pokamura Kuhiaboria Brahmin Gaon is situated at the south west of Jorhat and is a plain region lying away from the Brahmaputra & the Bhogdoi rivers at a height of 83 metres above sea level. The population of the village is 200 with a household number of 40.
IV. STUDY AREA
[image:2.612.106.506.476.669.2]
Fig. 1 (C): Study Area - Slum Pockets in the Municipal Area
Analysis
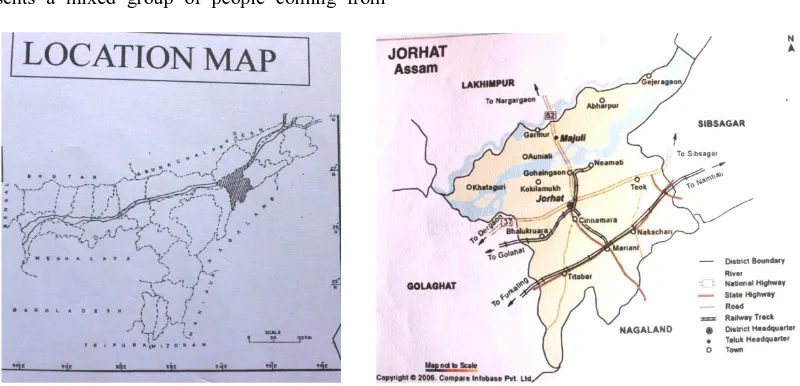
This study is carried out in Jorhat which falls under Jorhat district of Assam. It is located between 26045/ to 26075/ N latitude and 94013/ to 9422/ E longitude and at a height of 86 metres above sea level. It is the second largest city in Assam after Guwahati and its history can be traced down to two joint markets i.e Macharhat & Chowkirhat. “Jor” meaning joined and “hat” meaning market. It was the last capital of the Ahom Kingdom and home to many historical monuments – namely Rajamaidan, Lachit maidan, big water tanks dug by the Ahom rulers. At present it is also known as the tea capital of the state with tea gardens in and around it and the Tea Reseach Centre being located at Jorhat. Its a vibrant place today with a thriving cosmopolitan city with a strong sense of character and identity. It is also called the cultural capital of Assam with the indigeneious tribes trying to preserve their tradition and culture. This district has been the most literate for the last 3 decades with the present literacy rate being 82.15% with male literacy at 87.63% and female literacy at 76.45% according to the 2011 census.
This district occupies an area of 2851sq.km. and the municipal area is 9.20km with 19 wards . The new masterplan for the city has been formulated with 31 wards but has not yet been implementd. This ditrict lies on the south of the river Brahmaputra (as shown by Fig 1A) with the largest inhabited riverine island Majuli located on the river Brahmaputra. There are several other rivers flowing down the Naga hills through Jorhat into the Brahmaputra. In fact the main river Bhogdoi passing through this city Jorhat is one whose course has been diverted from Disai river by the Ahom rulers when they shifted their capital to Jorhat. The climate of this region is subtropical monsoon with hot and humid summers and dry & cool winters. The average rainfall received is around 20” and the humidity level is as high as 83%. Summer temperatures are as high as 250 to 370 celsius and winter 100- 220 celsius.
The total population of the district has crossed 1 million with 1,009,197 with a decadal growth rate of 9.31% which is more or less at par with that India’s growth rate of 9.05% between 2001 and 2011. The urban population is 2,19,565 which is 20.2% of
the district, which includes population of Mariani, Titabor and Teok. This is so, as Jorhat has been expanding horizontally and the master plan with 31 wards includes a much wider area whose population is not added to the present one.(Source: Municipal record, 2011)
Sampled Population
[image:3.612.50.286.60.257.2]A total of 120 households with 675 samples were surveyed, 30 samples each in each area i.e. the slums, the tea garden and the village in the rural area. The percentage of male members is more in the slums and the tea garden marginally with 51 and 51.5 percent whereas in the rural area females account more than males with 52.3 percent. The following table 1 gives the age wise classification of the sampled population.
Table No. I: Sampled Population in the three different areas age wise.
Population Group
Male Female Total
Slums Number %age Number %age Number
0 month to 4 years
8 3 13 5.8 21
4yrs to 15yrs
19 8.2 20 8.8 39
15yrs to 22 yrs
26 11.5 21 9.3 47
22yrs to 60 yrs
62 27.3 56 24.6 118(51.8%)
More than 60yrs.
2 1 1 0.5 3
Total 117 51 111 49 228
Tea Garden 0 month to 4 years
12 4.7 10 3.9 22
4yrs to 15yrs
18 7.0 15 5.9 33
15yrs to 22 yrs
43 16.8 42 16.4 85(33.2%)
22yrs to 60 yrs
58 22.7 53 20.7 111(43.4%)
More than 60yrs.
1 0.3 4 1.6 5
Total 132 51.5 124 48.5 256
Rural Area 0 month to 4 years
2 1.0 7 3.7 9
4yrs to 15yrs
7 3.7 14 7.3 21
15yrs to 22 yrs
13 6.8 15 7.8 18
22yrs to 60 yrs
58 30.4 60 31.4 118(61.8%)
More than 60yrs.
[image:3.612.309.581.265.738.2]Total 91 47.7 100 52.3 191 Grand
Total
340 335 675
[image:4.612.312.576.57.157.2]In the slums it is seen that the sampled population are either inter (53.3%) or intra state (46.7%) migrants. In case of inter-state migration 30% have come from different parts of Bihar and the rest 16% from Odisha. In case of intra-state migration 12% each have migrated from Dhubri and Nagaon and 4% each have come from Tezpur and Golaghat and the rest 22% of the slum population are originally from Jorhat.
Figure 2: Sampled Population from the Slum Pockets
In the tea garden again we have migrant population and can see that 36.7% are from Bihar, 40% from Odisha, 20% from West Bengal and 3.3% are indigeneous Nepali speaking people. All of them are employed in the tea estate and are working as tea garden labourers either in the field or at the factory.
And in the village of course, we have indigeneous Assamese people who have been living there for generations. The diagrams above shows that we have a mixture of people who are settled in Assam due to work purposes. The tea garden labourers have been living here for the last 3-4 generations, however the slum population have migrated either first generation or are just second generation samples. They have relocated themselves from different part of Assam as well searching for new opportunities.
Figure 3: Sampled Population in the Tea Estate from different States
Table II: Migrants Information
Slums Bihar Odisha Dhubri Nagaon Tezpur Golaghat Jorhat (in
%age)
30 16 12 12 4 4 22
Tea Garden
Bihar Odisha Bengali Nepali
(in %age)
[image:4.612.28.310.58.94.2]36.7 40 20 3.3 - - -
Table III: Occupational Classification of All The Sampled Population (in %age)
Daily wage labourer
Sweeper Business Service Household Labourers
Others
33 5 18 19 4 20
[image:4.612.142.469.372.599.2]Figure 4 Sampled Occupational Classification of Population
[image:5.612.166.447.67.232.2]As such the income classification shows that majority i.e. 43.3% comes from the second monthly income group of Rs. 5000/- to Rs. 10,000/- followed by the third income group (26.7%) earning between Rs.10,000 – 20,000/- a month. There’s also a sizeable sample (8.7%) from the highest income group earning more than Rs. 30,000/- a month. So in other words here’s a mixed sampled population comprising different communities with different cultures as well as different economic status.
Figure 5: Income Classification of the Sampled Population
Household Condition – The samples were selected in such a way so that both kutcha, semi-pucca (cemented) pucca and RCC households get represented in each of the areas. Of course the condition of houses in slums are purely temporary with materials which are to be used for other purposes. They are squatters occupying the most neglected part of the city with narrow lanes, unhygienic conditions etc.
In the slums it is seen that 45% of the population live in houses with less than 2 rooms. This figure for tea gardens is 17% while in the rural area, no houses were found with less than 2 rooms.
Again if we see the ventilation in houses, it is found that in the slums only 15% houses have ventilation whereas in the other two areas all houses have proper ventilation. Regarding drains in the slums only 13% households have covered drains and the rest are uncovered which is again a health hazard to them. While in the tea garden and the village 47% and 87% have drains. The socio-economic indicators based on household amentities provides a background to understanding the health and status of the people under survey. All the houses surveyed in three different areas have access to electricity.
Table IV: Housing Condition of the Sampled Areas
Category Slums Tea Estate Rural Area
No. of Rooms
<2 rooms >2room s
<2 rooms >2room s
<2 rooms 2-4 rooms
>4 rooms
45% 55% 17% 83% 32% 68%
Ventilation With Without With Without With Without
[image:5.612.149.464.332.478.2]
Fig 6 (A): Garbage Disposal at Hunwal T.E. Fig 6 (B): At Pokamura village
Regarding garbage disposal majority of them dispose it in either the streets or within their compound which lies untreated. As can be seen all kinds of garbage are disposed off at the same place. The practice of throwing it into a municipal bin is very less (15%). Maybe because there aren’t enough bins and roughly about 30% burn their garbage without sorting which again is harmful for the environment.
Regarding fuel for cooking nearly 45% samples in the slum areas cook on firewood in just 1 or 2 room tenements without adequate ventilation. But the good aspect is that still quite a major chunk of the samples use gas as their fuel for cooking.
Fig7 (A & B): Source of Water i.e. Pond and Government Water Supply Scheme in the Rural Area Drainage Open Covered Drains No
drains
Drains No drains
87% 13% 47% 53% 87% 13%
Kitchen Gas Chulha Gas Chulha Gas Chulha
55% 45%
Garbage Disposal
Street M/Bin Burn Street Dump Street Dump Burn
Slum dwellers – The major source of water for them is the tap water provided by The Urban Water Supply (62.5%). For 10% samples their source of drinking water is the river Bhogdoi by the side of which they reside in squatters. Another interesting aspect of their drinking water is that, when water from the urban water supply is not available the residents there naturally draw water from the river alongside their houses. A few of the toilets were also seen to drain into the river from which they drink water. A few of the slum dwellers also have tube well as their source of water (27.5%)
A bacterial analysis of water was done by the researcher at North East Institute of Science & Technology (NEIST), Jorhat to check the impurities in the water. The sample was drawn from the water container (bucket) of a household Renu Basfar, Harijan Colony and the result is –
i) Number of bacteria in per ml of water is more than 200.
ii) This water sample has more than 1800 intestinal origin group of bacteria. iii)It has 5 MPN (Most Probable Number) of pathogenity.
Thus, this sample of water was found to be contaminated with faecal coliforms and as such unfit for human consumption. It can cause several water borne diseases, which the slum dwellers are unaware as they are consuming the water without adequate filtration.
Fig. 6 (a) Fig. 6 (b)
Rural Village – Most of the people (60%) here prefer drinking water from government water supply scheme available in their area. Some of the households (20%) take pond water which they have within their compound. Apart from the pond some households (20%) also have tube well with motor pumps. The water from the pond and the tube well have high iron content but otherwise is not contaminated. Nearly half of the sampled population (45%) drink water after boiling and filtration, another 45% only filter water before drinking and the rest 10% boil the water before drinking.
Hunwal Tea Estate – In the tea garden the water supply is provided by the tea garden authorities. a) Number of bacteria in per ml of water is more than 200.
[image:7.612.143.308.192.413.2]b) This water sample has more than 1600 intestinal origin group of bacteria. c) It has 4 MPN (Most Probable Number) of pathogenity.
Fig 8 Water Source in Tea Garden
[image:7.612.37.443.461.599.2]Sanitation The availability and cleanliness of toilets is a reflection of the society, which in turn reflects the spread of diseases especially gastro-intestinal and skin etc. Recently a study conducted by C-NES Centre for North East Studies & Policy Research found that 67% of the people in Jorhat have access to toilet facilities according to the district level household and facility survey of 2007-08 7. The fact that millions in India are still forced to defeacate in the open ought to be a matter of national shame. It is shameful not only from the angle of human health but from human dignity, sense of aesthetics and cleanliness.
Fig. 11 Type of Toilets in Slums
i) Slums – In this study 5% samples have their own toilets and the rest 95% share their toilets between families, out of which 52% are sanitary toilets and the rest 43% are traditional toilets. Regarding cleaning their toilets 78% of the samples do not at all clean their toilets but the rest clean it every 2-3 days with disinfectant. Simply by washing our hands with soap before meals also
Fig12 (A) & (B) :Toilets (Traditional & Mordern)
ii) prevent us from several diseases and it was seen that only 20% samples wash their hands with soap and the rest (67%) just wash their hands with water and 13% samples said they its not part of their daily routine and so do not remember to wash their hands before eating. None of the sampled population in the slums have running water in their toilets.
iii) Rural Village – In the village 58% people have attached toilets and clean it daily and also weekly using disinfectant. The rest 42% have traditional toilets away from their house. In these toilets 31% have running water inside their toilets and the rest don’t.
7
Fig. 13: Toilets in the Rural Village
Percentage of Toilets with and without running water
Fig. 14: Household with and without running water.
iv) Hunwal Tea Estate – Only 13% of the households have attached toilets, and 23% have unattached but proper toilets, 47% use traditional toilets and 17% samples still defecate in the open.
V. FINDINGS
1. A total of 120 samples were collected of which 47.7% are male and 52.3% are female. There are 60 samples from the slums since the slums are represented by two pockets.
2. a) In the slums it is seen that the sampled population are either inter (53.3%) or intra state (46.7%) migrants. In case of inter-state migration 30% have come from different parts of Bihar and the rest 16% from Odisha. In case of intra-state migration 12% each have migrated from Dhubri and Nagaon and 4% each have come from Tezpur and Golaghat and the rest 22% of the slum population are originally from Jorhat.
b) In the tea garden again we have migrant population and can see that 36.7% are from Bihar, 40% from Odisha, 20% from West Bengal and 3.3% are indigeneous Nepali speaking people. All of them are employed in the tea estate and are working as tea garden labourers either in the field or at the factory.
c) And in the village of course, we have indigeneous Assamese people who have been living there for generations.
3. Occupation wise classification shows that 33% of the samples are daily wage labourers followed by (19%) service holders followed by business persons (18%) and a very minor sample comes from household labourer
(4%) and sweeper (5%). They come from the slum pockets. 21% of the samples are part time workers who otherwise work in the fields or are engaged in house hold chores.
4. Economic classification of the sampled population shows that 43.3% comes from the monthly income group of Rs. 5000/- to Rs. 10,000/- followed by the third income group (26.7%) earning between Rs.10,000 – 20,000/- a month. There’s also a sizeable sample from the highest income group earning more than Rs. 30,000/- a month, though 14.5% of the samples earn less than Rs. 5000/- a month. So in other words here’s a mixed sampled population comprising different communities with different cultures as well as different economic status.
5. In the slums it is seen that 45% of the population live in houses with less than 2 rooms. This figure for tea gardens is 17% while in the rural area, no houses were found with less than 2 rooms.
6. Again, if we see the ventilation in houses, it is found that in the slums only 15% houses have ventilation whereas in the other two areas all houses have proper ventilation.
7. Regarding drains in the slums only 13% households have covered drains and the rest are uncovered which is again a health hazard to them. While in the tea garden and the village 47% and 87% have drains while the rest don’t.
enough bins and roughly about 30% burn their garbage without sorting which again is harmful for the environment.
9. Regarding fuel for cooking nearly 45% samples in the slum areas cook on firewood in just 1 or 2 room tenements without adequate ventilation. But the good aspect is that still quite a major chunk of the samples use gas as their fuel for cooking.
10. The major source of water is The Urban Water Supply (62.5%). For 10% samples their source of drinking water is the river Bhogdoi and 27.5% samples draw water from tube wells. Another interesting aspect of their drinking water is that, when water from the urban water supply is not available the residents there naturally draw water from the river alongside their houses. A few of the toilets were also seen to drain into the river from which they drink water. This sample of river water tested at NEIST shows that it contains bacterial coliforms and as such unfit for human consumption.
11. In the rural area, most of the people (60%) here prefer drinking water from government water supply scheme available in their area. Some of the households (20%) take pond water which they have within their compound. Apart from the pond some households (20%) also have tube well with motor pumps. Nearly half of the sampled population (45%) drink water after boiling and filtration, another 45% only filter water before drinking and the rest 10% just boil water before drinking.
12. In the slums only 5% samples have their own toilets and the rest 95% share their toilets between families, out of which 52% are sanitary toilets and the rest 43% are traditional toilets. Regarding cleaning their toilets 78% of the samples do not at all clean their toilets but the rest clean it every 2-3 days with disinfectant. Simply by washing our hands with soap before meals also prevent us from several diseases and it was seen that only 20% samples wash their hands with soap and the rest (67%) just wash their hands with water and 13% samples said they do not wash their hand before eating. None of them have running water in their toilets. In the tea garden, only 13% of the households have attached toilets, and 23% have unattached but proper toilets, while 47% use traditional toilets, 17% samples still defecate in the open.
13. Rural Village – In the village 58% people have attached toilets and clean it daily and also weekly using disinfectant. The rest 42% have traditional toilets away from their house. In these toilets 31% have running water inside their toilets and the rest don’t.
VI. CONCLUSION
From this study it is revealed that, although much has been achieved a lot still needs to be done to improve the sanitation situation. Moreover, its the women folk who fetch water for the household and looks after the hygiene and cleanliness of the house. So their education and awareness regarding safe drinking
water and clean toilets is very important. Equally important is the awareness regarding the benefits of good health, as the whole i.e. good health can be achieved only by fulfilling the parts.
The total sanitation campaign (TLC) launched by the government of India in 1991 is indeed commendable but the speed & success of implementation is very slow. The target of achieving total sanitation by 2012 has not been achieved except for five states in India accordning to statistics. In fact women are most affected by the lack of proper sanitation, which is also one of the causes of girls drop out in school because of lack of toilets in school.
REFERENCES
[1] Bhagabati, A.K., Kar B.K., Bora A.K. (2001):“Geography of Assam, Rajesh Publication.
[2] Bhatti Kamakshi Health of female residents in Mumbai. [3] Chabria Anjali, (2011): One India One People, Vol.15/4 Published by
Suchitra R. Hegde.
[4] Down to Earth, October, 2006. “Muck Tale”
[5] Jaiswal, Rajesh (2013): “Research Promoter – Micro Credit for Small Tea Grower of Assam”.
[6] Kothari, C.R. (2008): “Research Methodology”, New Age International (P) Limited Publisher.
[7] Mandal, R.B. (1999): “Urban Geography”, Concept Publishing Company, New Delhi.
[8] Mara, Lane and Scott and Trouba (2010): Water & Sanitation for the Urban Poor, Evaluation of the costs and benefits of water and sanitation improvements at the global level, and Mara D, Lane J, Scott B, Trouba D (2010) ‘Sanitation and Health’. PLoS Med 7(11): e1000363.
[9] Santra Prakasnaryan, (2013): Geographical Review of India, “Status of Maternal and Child Health in West Bengal”.
[10] Sharma, H.N. (2008): “Jorhat Town during the Nineteen Sixties” pp 1-8. [11] Taher, M. Ahmed, P. (2005): “A Geographical Profile”, Published by Mani
Manik Prakash.
[12] The Sentinel, Guwahati, April 14, 2013 “Assam yet to achieve target under Total Sanitation Campaign”.
[13] The Sentinel, Jan 28, 2014 “Assam yet to achieve target under Total Sanitation Campaign”, by a Staff Reporter.
[14] The Assam Tribune Oct. 29, 2013, “Call for action on potable water, sanitation”.
[15] The Seven Sister’s Post, Guwahati, June 19, 2012” Basic Right: Campaign against restroom injustice” original article came out in The New York Times.
Websites
[16] http/History of Jorhat [17] http/ Health of India [18] http/ Sanitation in India
[19] UNO & UNOCEF - www.healthissuesindia.com/poor-sanitation visited on 30th Jan, 2014
[20] UNICEF – Water, Sanitation & Hygiene www.unicef.org/wash visited on 28th Jan, 2014
[21] en.wikipedia.org/wiki/Sanitation visited on 29jan, 2014. [22] en.wikipedia.org/wiki/Sanitation visited on 29jan, 2014. [23] www.biotoilet.org
Wikipedia the free encyclopaedia Drinking water supply and sanitation in India
AUTHORS
department at both Under Graduate and Post Graduate Courses for the last 20 years. Her specialization is
Regional and Urban Planning in which she completed her Master’s