www.ijsrp.org
Innovative Technique for Analysis of Retaining Wall –
using Dimensional Analysis
Siddhesh P. Narvekar, Dr. Manoj M. Mujumdar, Akshay R. Thorvat
KIT‟s College of Engineering, Kolhapur, Maharashtra State: 416008, India.
Abstract- Analysis of retaining wall is one of the major part in Geotechnical Engineering. This can be done by various methods such as Rankine's Theory, Coulomb‟s Theory, Culmann's Graphical Method which depends on various assumptions . To overcome this, various approaches has been adopted, in this paper we have tried to formulate the same with the help of Dimension Analysis method by which results can be obtained without any assumptions and an universal formula can be developed. We have used the modified Buckingham-pi theorem for this analysis. The results of dimensional analysis so obtained are then compared with the actual test results. The comparison shows the validity of this method.
Index Terms- Retaining wall; Active Earth Pressure; Dimensional Analysis; Trial and error.
I. INTRODUCTION
very Engineer seeks to have a simple, fast and reliable solution to his problems. For this he took help of various analysis tools. There are various methods of analysis such as Limit Equilibrium Analysis, Finite Element Analysis etc. which involves simple rules and assumptions to more complex techniques. Dimensional analysis is a mathematical technique which makes use of study of dimensions as an aid to the solution of several engineering problems. The various physical quantities used by engineers to describe the given phenomenon can be described by a set of quantities which are in a sense independent of each other. These quantities are known as fundamental or primary quantities. The expression for a derived quantity in terms of the primary quantities is called the dimension of the physical quantity
II. MATERIALS AND METHODS
2.1 Experimental Study On Earth Pressure Of Retaining Wall By Field Tests by Minaro Matsuo,Satosuo Kenmochi [3] Earth pressure acting on retaining wall has been theoretically & experimentally studied by many researchers but the large ranged measured result are comparatively low. In this paper Influence of displacement of wall on magnitude of earth pressure are shown.
Retaining wall structure
Height 10 meter Made up of concrete
Backfill Silty Sand & Slag (Produced in Iron manufacturing process)
Duration One Year (Including preparation of the test)
Procedure in General
When Earth Pressure becomes stable at rest wall is moved outside to Active State and after completion of the same wall has returned back to original position to measure Passive Pressure.
Experimental Set up
Wall is made up of concrete of 10m height. Lowest end is supported by Hinge (Provides not only inclined displacement but also horizontal displacement)Pressure receiving plates – 2m in each unit length Load Cells – Four to each pressure receiving plate. Two at the lowest end (Measure wall friction)Oil Jacks – Between Retaining wall & wall of existing building.
Pre-Experimental Procedure
Retaining wall set up with supports by Oil Jacks between existing wall & test wall. Place the lowest pressure receiving plate and fill the backfill up to height of 2mContinue the process up to 10m height.
Unit Weight
Silty Sand 1.9 t/m3 Slag (A) 2.0 t/m3 Slag( B) 1.6 t/m3
Influence of Underground water
Sand mat is placed between original ground & backfill Water always pumped out
Experimental Procedure
At Rest Firstly wall is kept at rest condition – 2 Months Active State Tilting deformation is given – Twenty Days ( Displacement is measured by Dial gauge) Passive State Wall has been bring to original position. This is actually not perfect passive state but gives the Rough information. Beyond this practically not possible due anticipated danger
Relationship between Earth Pressure & Time.
Resultant force = Horizontal Earth pressure + Frictional Force. Horizontal Earth pressure = Sum of values measured by twenty load cells
Frictional Force = Two load cells at the lowest end of pressure receiving plate
www.ijsrp.org
Coefficient Of Earth Pressure, Angle Of Wall Friction, Point Of Application Of Resultant Force.
2.2 Formulation of Dimensional Analysis Equation
Dimensional analysis looks to reduce to a minimum the dimension space in which the behaviour of problem can be studied by joining and systematically positioning the assumed governing variables (V) = (V1, V2, V3... Vn), consisting total of „m‟ independent primary dimensions (D) = (D1, D2, D3...Dm), into N = (n - m) dimensionless groups, that are (π1, π2, π3…πn), with N being less than V [1].
Thus, using modified Buckingham – pi theorem [1] we have V = { Pa, γ, z, k, Φ, δ, d }hence, n = 7. Writing the dimensions of the variables, V= { M1 L-1 T-2 , M1 L-2T-2, L1, O, O, O, L1 }, m = 3.
As a requirement the condition of „Dmin‟ which looks to reduce the total number of primary dimensions in set {V} is fulfilled by minimizing the value of m, therefore, assuming the S = [M1L-1T-2], V= [S1, S1L-1,L1,0,0,0,L1]; hence, m = 2; the number of repeating variables forming a set Q. Thus, the number of dimensional pi-groups and the number of isolated variable in N = (n-m) = 7 – 3 = 5.
R is a set o variables in V that dimensions totally different from one another,
R= { p, γ, z }. Dimensionless gropes are formed by the combination of the repeating (Q) and isolated (NOTQ) variable sets; Since Q is to be selected from R,
Q = { Pa, γ }
... (1)
NOTQ = { z, k, Φ, δ, d } ... (2)
Therefore the dimensionless groups are, π1= { Pa, γ, z }
... (3i) Or
π2= { Pa, γ, k }
... (3ii) Or
π3= { Pa, γ,Φ }
... (3iii) Or
π4= { Pa, γ, δ }
... (3iv)
Or
π5= { Pa, γ, d }
... (3v) Now, representing
π1= { Pa, γ, z } ... (4)
In dimensional form eq. (4) can be stated as follows: [Mo Lo To]= [M1 L-1 T-2] a x [M1 L-2T-2] b x [L1] c
Comparing the indices of left hand side and the right hand side; for
M: 0 = a +b L: 0 = -a-2b+c T: 0 = -2a - 2b
Hence, a =1 then b = -1, c = -1
Substituting these values in eq. (4) π1 = { Pa γ-1 z-1 } = Pa / (γ z )
... (5)
Similarly, by solving the eq. for π2, π3, π4 and π5 we find that
π2 = k
... (6) π3 = Φ
... (7) π4 = δ
... (8) π5 = Pa / (γ d)
... (9)
We consider π1 = ψ (π2, π3, π4, π5) and by substituting from eqs. (5),(6),(7),(8)and (9), we have
Pa / (γ z )= ψ [k, Φ, δ, Pa / (γ d) ] ... (10)
To find exact nature of (ψ) a power product relationship of the dimensionless groups is used as follows;
π1 = β1 (π2 β2, π
3 β3, π
4 β4
, π5 β5
To solve eq. (11), a logarithmic form of this eq. is used log(π1) = log(β1)+ β2 log(π2)+ β3 log( Π3)+ β4 log( Π4)+ β5 log( Π5)
log (Pa /(γ z )) = (logβ1) + β2 log(k) + β3 log (Φ) )+ β4 log(δ)+ β5 log(p/(γ d)) ... (12)
Now π1 is treated as the dependent variable and the value of constants (β1, β2, β3) can be found out by performing a multiple regression analysis of eqs. (11) and (12) or by the trial-and-error procedure of eq. (12).
Now using the Properties of Backfill material with reference to the Experiment performed on site and using Rankines formula to find the Active Pressure at mid height of wall .We will use this as a control point to formulate the D.A for Slag B as Backfill material we will get
Pa = k γ z = 0.1325 * 1.6* 5 = 1.06 t/m2, And taking the values of Φ = 50° δ = Φ/2 = 25° d = 0.0325m
By using the test results obtained from the site test, and substituting the values of the test results in eq. (12) - that is, using this point as a control point to formulate the dimensional analysis, we get
-2.021 = log(β1) -2.0212 β2 + 3.912 β3 + 3.212β4 + 3.015β5 ... (13)
[image:4.612.80.539.526.661.2]Table 1 explains the trial and error procedure with values of constants for eq.(13), in the first trial, β1, β2, β3 and β4 are assumed and the corresponding β5value is back calculated by using eq.(13) for values π1, π2 , π3, π4 and π5 of the first set of test results, which are use as a control point. Then the determined β values are submitted, along with the values of π1, π2 , π3, π4 and π5 for the second set of test results, as a check point in eq.(11). Hence the control point is used to prepare the dimensional analysis equation and the checkpoint is used to authenticate it.
Table 1. Trial and Error Procedure with Values of Constants for Equation (13)
Trial
No. β1 β2 β3 β4 β5
Results
Remark
1 1 1 1 1 -2.3627 0.1349
NOT VALID
2 1 1 1 0.9 -2.2562 0.13475
NOT VALID
3 1 1 0.6 0.6 -1.4176 0.1339
NOT VALID
4 1 1 0.5 0.5 -1.1813 0.1337
NOT VALID
5 1 1 0.4 0.4 -0.945 0.1334
NOT VALID
I. 6
1 1 0.3 0.3
-0.70878 0.1332
NOT VALID
II. 7
1 1 0.2 0.2 -0.4725 0.1329
NOT VALID
III.8
1 1 0.1 0.1 -0.2362 0.1328
NOT VALID IV.9 1 1 0.09 0.09 -0.2125 0.1326 VALID
Thus the trial 9, as shown in Table 5, resulted in a valid equation and correct set of values are
β1=1, β2= 1 , β3 = 0.09 , β4= 0.09 , β5= -0.2125
By substituting the preceding β values values in Eq.(9) and solving, we get the universal formula
Pa = { k z γ1.2125 (Φ δ).09 d 0.2125 } ... (14)
III. RESULTS AND DISCUSSION
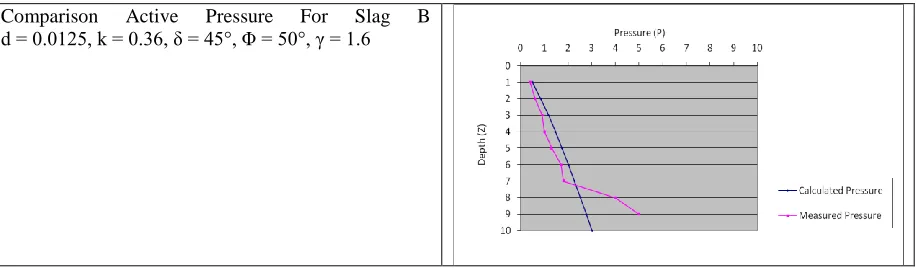
3.1 Comparison of Experimental Results and Dimensional Analysis
To verify the proposed method we have used 5 test results. Below graphs shows the results of the tests conducted at site and the results obtained by the proposed method. The results shows that the prediction capability of this new method is very good.
www.ijsrp.org Comparison Active Pressure For Slag B
d = 0.025, k = 0.30, δ = 51°, Φ = 50°, γ = 1.6
Comparison Active Pressure For Slag B d = 0.0325, k = 0.3, δ = 50°, Φ = 50°, γ = 1.6
Comparison Active Pressure For Slag B d = 0.0488, k = 0.27, δ = 49°, Φ = 50°, γ = 1.6
Comparison Active Pressure For Slag B d = 0.0725, k = 0.23, δ = 50°, Φ = 50°, γ = 1.6
Graphical Comparison between Experimental and Analytical Results
IV. CONCLUSION
The It is possible to formulate a DA for any type of Geotechnical problem , only thing that various parameters involved in the problem should be known along with there interrelationship with each other.
Various assumptions required in the conventional analysis are not required for the D.A.
From any point called as Control Point either obtained by traditional analysis or an experimental tests; the predictions of the other points with different soil conditions, displacements could be possible.
D.A.is simpler method than any other traditional method to take the wall displacement into consideration. D.A. is simpler and faster method as compared to any other rigorous methods of analysis such as Finite Element Analysis, Limit Equilibrium Methods, etc. and have potential to replace them.
Notations:
The following symbols are used in this paper: Pa = Active Earth pressure γ = Soil Density
z = Depth of backfill
k = Coefficient of Earth Pressure Φ = Angle of Internal Friction Δ = Angle of wall Friction
D = Wall displacement
V = Set of independent and dependent parameters involved in the phenomenon; and an Unknown function
M = Mass dimension L = Length dimension T = Time dimension
D = Set of independent primary dimensions Dmin = Minimum number of independent and nonzero elements
n = Number of variables or parameters m = Number of primary dimensions in D N = (n−m) = Number of dimensionless groups Q = Set of repeating variables
R = Set of variables in V that have dimensions totally distinct from one another
REFERENCES
[1] Butterfield, R.1999. “Dimensional analysis for geotechnical engineers.”J. Geotechnique, 493, 357–366
[2] Phatak, D. R., and Dhonde, H. B. 2003. “Dimensional analysis of reinforced concrete beams subjected to pure torsion.” J. Struct. Eng., 12911, 1559– 1563
[3] Minaro Matsuo,Satosuo Kenmochi “ Experimental Study On Earth Pressure Of Retaining Wall By Field Tests” Soil & Foundations Japanese Society Of Soil Mechanics & Foundation Engineering Vol 18 No 3 Sept.1973. [4] Narvekar S P , “Analysis of retaining wall by Dimensional Analysis using
Modified Buckinghms Pi Method” Dissertation work during M. Tech- Geotechnical Engineering 2008-09
[5] Text book by P. N. Modi, S. M. Seth; “Hydraulics And Fluid Mechanics” [6] Text book by Kasmalkar B. J “ Geotechnical Engineering ”
[7] Text book by Gopal Ranjan “ Basic & Applied Soil Mechanics ” [8] Text book by Punmia B. C. “ Soil Mechanics & Foundation ”
AUTHORS
First Author – Siddhesh P.Narvekar, Assistant Professor, Department of Civil Engineering, KIT‟s College of Engineering, Kolhapur, Maharashtra: 416008, India.
[email protected], Tel: +91-09011323796 Second Author – Dr. Manoj M. Mujumdar, Professor,
Department of Civil Engineering, KIT‟s College of Engineering, Kolhapur, Maharashtra : 416008, India.
[email protected], Tel: +91-07875163510 Third Author – Akshay R. Thorat, Assistant Professor,
Department of Civil Engineering, KIT‟s College of Engineering, Kolhapur, Maharashtra: 416008, India.