Full Length Research Article
LANDSLIDE DETECTION USING SATELLITE REMOTE SENSING IMAGERY
1
*Kwong-Fai A. LO,
2Hui-Chung YEH and
3Shou-Hung CHEN
1
Institute of Geography, Chinese Culture University, 55, Hwa Kang Rd, Yangmingshan, Taipei, Taiwan
2Department of Natural Resources, Chinese Culture University, 55, Hwa Kang Rd, Yangmingshan, Taipei, Taiwan
3
Department of Geography, Chinese Culture University, 55, Hwa Kang Rd, Yangmingshan, Taipei, Taiwan
ARTICLE INFO ABSTRACT
Landslide detection using satellite remote sensing images has been widely studied. This type of applications often involves either change detection or multi-spectral image classification methodologies. If there is only one set of satellite image, the change detection method has limited use. Collecting and analyzing training area data for image classification are costly and time consuming. This study, therefore, utilize only one SPOT satellite image data for estimating the normalized difference vegetation index (NDVI), and to segregate vegetated and non-vegetated areas of the Ta-An River Basin in Central Taiwan. Slope factor and textural feature are then used to identify the landslide area. Results indicate that the accuracy of landslide detection using NDVI alone is about 88%. Using NDVI with slope factor and textural feature increases overall accuracy to 97%. This study successfully demonstrates the capability of using one set of remote sensing image to map landslide area in a large river basin.
Copyright © 2015 Kwong-Fai A. LO et al. This is an open access article distributed under the Creative Commons Attribution License, which permits unrestricted use, distribution, and reproduction in any medium, provided the original work is properly cited.
INTRODUCTION
Remote sensing is the science of obtaining and interpreting information from a distance, using sensors that are not in physical contact with the object being observed. Land use classification using satellite multi-spectral scanner image is a typical application of remote sensing to environmental monitoring. Due to high population density housing construction in steep hillside is very popular in Taiwan. With this type of improper land use, soil erosion and debris flow occurs more often. Landslide includes a wide range of ground movement, such as rock fall, slope failure, and debris flow. Landslide detection using satellite remote sensing images has been widely studied in Taiwan (Cheng et al., 1998; Kuo et al., 2000). This type of application often involves either change detection or multi-spectral image classification methodologies. If there is only one set of satellite image, the change detection method has limited use. Collecting and analyzing training area data for image classification are sometimes costly and time consuming. This study, therefore, utilize only one SPOT satellite image data to estimate the normalized difference vegetation index (NDVI), and to segregate vegetated and non-
*Corresponding author: Kwong-Fai A. LO
Institute of Geography, Chinese Culture University, 55, Hwa Kang Rd, Yangmingshan, Taipei, Taiwan
vegetated areas of the Ta-An River Basin in Central Taiwan. In addition to using just NDVI only, the combined use of slope factor and textural feature will be studied also to identify the landslide area.
Vegetation Indices
Vegetation indices attempt to measure biomass or vegetative vigor quantitatively based on digital values. Band ratios are computed from two spectral bands. Ratio of near infrared and red bands is useful in mapping vegetation and vegetation condition. The ratio is high for healthy vegetation, but low for stressed or unhealthy vegetation as well as non-vegetation areas. The most widely used index is normalized difference vegetation index (NDVI), which is a variant of the simple ratio calculation. The NDVI can be computed by (Schowengerdt, 1997):
red NIR
red NIR
NDVI
(1)where
NIR and
red are the reflectance of near infrared and red bands, respectively. The NDVI values range from –1 to 1. Vegetated area will generally have high values because ofISSN: 2230-9926
International Journal of Development Research
Vol. 5, Issue, 04, pp. 4237-4241, April,2015
International Journal of
DEVELOPMENT RESEARCH
Article History:
Received 21st January, 2015
Received in revised form 16th February, 2015 Accepted 26th March, 2015
Published online 29th April, 2015
Key words:
Remote Sensing, NDVI,
their relatively high near infrared and low visible reflectance. In contrast, clouds, water, and snow have larger visible reflectance than near infrared. Thus, rocks and bare soil areas have near zero NDVI value. Clouds, snow, and bright non-vegetated surfaces have NDVI values of less than zero.
Slope Factor
There are three essential causative factors of debris flow. One is high intensity rainfall. The second is abundance of rock or sand sources. The third is steep slope. Landslide or debris flow usually occurs in steep hillside. The following slope function is used to calculate slope factor of Fig. 1:
)
(
tan
1dx
2dy
2Slope
(2)where
dx = [I (2,3)-I (2,1)] / k , and k is the distance between I (2,3) and I (2,1)
dy = [I (1,2)-I (3,2)] / k , and k is the distance between I (1,2) and I (3,2)
I (1,1) I (1,2) I (1,3) I (2,1) I (2,2) I (2,3) I (3,1) I (3,2) I (3,3) Fig. 1. Schematic of pixel group matrix
Textural Features
Textural features are derived from original spectral features. From a k by k pixel group (Fig. 1), two textural features used in this study are defined as follows: Let I(m,n) be the radiance at image coordinate (m,n). If pairs of pixels are considered within the pixel group, the gray level radiance difference is
)
,
(
)
,
(
)
,
(
d
I
m
n
I
m
d
1n
d
2g
(3)where both d1 and d2 can assume values of either 0 or
d
; d is the distance separating the pixel pairs and)
/
(
tan
1d
1d
2
= 0o,45o,90o,135o is the direction in which the pixel pairs are measured. The histogram of the distribution of radiance difference within a pixel group is)
(
,
g
h
d and textural features are (Wu and Chin, 1985;Schalkoff, 1992):
(1) Angular second moment
2 255
0 ,
2
(
)
)
,
(
g dN
g
h
d
ASM
(4)(2) Entropy
255 0 , ,(
)
ln
)
(
)
,
(
g d dN
g
h
N
g
h
d
ENT
(5)where N is the total number of pixel pairs in the pixel group separated by distance d and direction θ. In this study, the separation distance of pixel pairs d=3 is used.
Study Area and Data Set
[image:2.595.310.558.339.506.2]Ta-An River Basin is located in Central Taiwan with a total area of about 760 km2. The length of the main river is about 96 km (Fig. 2). Ta-An River originates from Ta-Ba Mountain of the Sheue-Shan Mountain Range. The elevation of Ta-Ba Mountain is about 3,488 m above sea level. The eastern part of the river basin is higher and declines toward the west. Except for the coastal area, most of the river basin consists of high mountains with limited plain areas. The Li-Yu-Tan Reservoir is located at the midstream of the Ching-Shan River, which is a branch of the Ta-An River. Two sets of data are used in this study. One is a single SPOT HRV multi-spectral image. This level-10 satellite image data was taken at 03/05/2001 and then re-sampled with resolution of 12.5 m by 12.5 m. The other is the detail landslide survey data collected by the Industrial Technology Research Institute (Energy and Resource Lab., 2001). The landslide survey was conducted right after the Chi-Chi earthquake (09/21/1999) and continued through typhoon Toraji (07/21/2001).
Fig. 2. SPOT image and boundary of the Ta-An River Basin
RESULTS AND DISCUSSION
Three steps are involved in this study to detect landslide:
(1) Selection of vegetated threshold (2) Selection of non-vegetated threshold
(3) Slope factor and textural feature addition to detect landslide area.
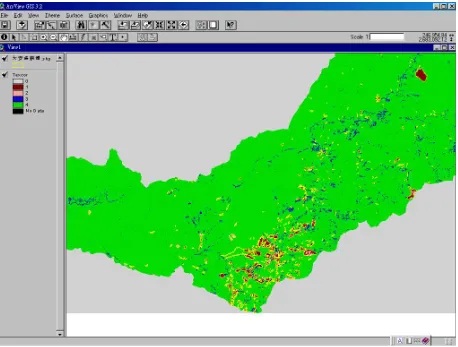
Fig. 3. Image of landslide detected by NDVI
[image:3.595.77.525.421.761.2]and bare soil for the study area. Error matrix (Table 3) shows that the overall accuracy for landslide detection improves to about 97%. Fig. 5 shows the area of landslide and vegetation which matches extremely well with the actual survey data. This result successfully demonstrates the capability of using one set of remote sensing image to map landslide area in a large river basin.
Table 1. Error matrix for vegetation and non-vegetation with NDVI=0.22
Non-vegetation Vegetation
Producer’s Accuracy (%) Non-vegetation 64,911 34,744 65.14
[image:4.595.70.528.56.403.2]Vegetation 554,746 4,204,710 88.34 User’s Accuracy (%) 10.48 99.18 87.87 Table 2. Error matrix for landslide and vegetation with
NDVI=0.22, slope=20o
Landslide Vegetation Producer’s Accuracy (%)
Landslide 63,171 36,484 63.39
Vegetation 137,224 4,622,232 97.12 User’s Accuracy (%) 31.52 99.22 96.43 Table 3. Error matrix for landslide and vegetation with
NDVI=0.22, slope=20o, textural feature=0.2
Landslide Vegetation Producer’s Accuracy (%)
Landslide 63,171 36,484 63.39
Vegetation 131,964 4,627,492 97.23 User’s Accuracy (%) 32.37 99.22 96.54
CONCLUSIONS
This study utilizes only one SPOT satellite image data for estimating the normalized difference vegetation index (NDVI), and to segregate vegetated and non-vegetated areas of the Ta-An River Basin in Central Taiwan. Slope factor and textural feature are then used to identify the landslide area. Results indicate that the accuracy of landslide detection using NDVI with slope factor and textural feature performs much better than using NDVI alone. This study also successfully demonstrates that using one set of remote sensing image is capable to map landslide area in a large river basin.
REFERENCES
Cheng, K.S., Yeh, H.C. and Kuo Y.C. 1998. On the use of divergence for feature selection in remote sensing image classification, Annual Conference, American Society of Photogrammetry and Remote Sensing, Tampa, Florida. Energy and Resource Laboratories, 2001. Investigation Report
of Landslide Inventory of Typhoon Toraji, Industrial Technology Research Institute, Taiwan, (in Chinese). Kuo, Y.C.,Yeh,H.C. Cheng, K.S. Liou, C.M. and Wu, M.T.
2000. Identification of Landslides induced by Chi-Chi Earthquake Using SPOT Multispectral Images, In:
Proceedings of The 21st Asian Conference on Remote Sensing.
[image:4.595.39.284.545.596.2]Schalkoff, R.J. 1992. Pattern Recognition: Statistical, Structural and Neural Approaches, Wiley, 364 pp.
[image:4.595.38.284.715.766.2]Schowengerdt, R.A. 1997. Remote Sensing: Models and Methods for Image Processing, Second Edition, Academic Press, 522 pp.
Wu, R., Weinman, J.A. and Chin, R.F. 1985. Determination of Rainfall Rate from GOES Satellite Images by a Pattern Recognition Technique, Journal of Atmospheric and Oceanic Technology (2): 314-330.