Full Length Research Article
DETERMINATION OF PHYSICOCHEMICAL PARAMETERS OF TANNERY EFFLUENT
POLLUTED SOIL
1
*Emmanuel, S. D.,
1Adamu, I. K.,
1Ejila, A.,
1Mohammed, S. Y.,
2Ja’afaru, M. I.,
3Amos, Y. and
1
Agbor, O.
1
Nigerian Institute of Leather and Science Technology (NILEST), Zaria, Nigeria
2
Department of Microbiology Moddibo Adama University (MAUTECH), Yola, Nigeria
3
Department of Microbiology, Kaduna State University (KASU), Kaduna, Nigeria
ARTICLE INFO ABSTRACT
Discharge of total chromium content into the environment as industrial waste is one of the major causes of environmental pollution. Soil samples were collected from 12 sites, four from each of the study areas viz; Yankusa control land, Gasau dumpsite and Daula agricultural deposited site. The total chromium content was analyzed using atomic absorption spectrophotometry (AAS). Physiochemical analysis of the contaminated and control land fill were also determined. The parameters determined were colour, odour, pH, temperature, Nitrogen, % potassium and % phosphorus etc. All parameters were found to be higher than the WHO limit except % Nitrogen, % Potassium and % Phosphorus that falls beyond. Equivalent statistical analysis on one way variance (ANOVA) shows that the concentration of the total chromium content varies significantly (α=0.05) between samples sites compared to the reference soil sample with F calculated value less than F tabulated (0.27/3.13) (0.27/3.13 and 2.32/3.13) respectively from the levels of total chromium, the results shows high level of total chromium content in the effluent discharge to the land fill and has passed the threshold level of 0.05mg/l. In this present investigation, the above parameters measured from control and polluted land fill are potential for profound effect on the contaminated soil itself, resident of microorganism, aquatic life and for further research work that will be done regarding to bioremediation process on land fill abatement.
Copyright © 2014 Emmanuelet al. This is an open access article distributed under the Creative Commons Attribution License, which permits unrestricted use,
distribution, and reproduction in any medium, provided the original work is properly cited.
INTRODUCTION
The environment nowadays is facing acute pollution problem with the discharge of various industrial effluents, containing substances varying in characteristics from nutrients to highly toxic substances. Pollution leads to wide spread denaturation of the environment, threatening the very existence of living being in a given habitat. Tannery industry is reputed globally as a major industry and contribute serious environmental problem (UNIDO, 2005). The current pattern of industrial activity alters the natural flow of materials and introduces novel toxic chemicals into the environment (Faisal and Hasnann, 2004). Heavy metal release to the environment of industrial activities and poses a significant threat to the environment has been increasing continuously because of
*Corresponding author: Emmanuel, S. D.,
Nigerian Institute of Leather and Science Technology (NILEST), Zaria, Nigeria
industrial activities and technological development and poses a significant threat to the environment, soil and public health. Contamination of agricultural soil with heavy metals is a major problem on industrial and defense related sites all over the world (Parameswari et al., 2010). Tannery industries release effluents directly on the agricultural land or surface of water bodies which eventually leaches to ground water that lead to contamination of toxic metallic component and result in a sense of well documented problem in living beings (Zang and Li., 2011). Chromium exists in many oxidation state of which only Cr (VI) and Cr (III) ions are the most stable under environmental circumstances (Masood and Malik., 2011). Chromium (III) is required in human body, but in very small amounts and relatively immobile, slightly acidic to alkaline and chemically more stable than Cr (VI) and less bio available due to its negligibility and permeable nature to bio membrane. Cr (VI) is highly mobile and water soluble when compare to Cr (III), where as chromium is also used as a pigment.
ISSN:
2230-9926
International Journal of Development Research
Vol. 4, Issue, 8, pp. 1723-1729, August,2014
International Journal of
DEVELOPMENT RESEARCH
Article History: Received 31st May, 2014 Received in revised form 30th June, 2014 Accepted 21st July, 2014 Published online 31st August, 2014
Key words:
Atomic absorption spectrophotometry (AAS), Chromium content,
Hexavalent chromium can be harmful to human health and is toxic, mutagenic and also carcinogenic (APHA, et al., 1998). Chromates in soils have also been found to induce allergic reactions in some individuals. Due to those health and environmental issues, restrictions have been imposed on the use of certain chromium compounds in many countries. Soil is an important system of terrestrial ecosystem. There is a direct impact of pollutants ion minerals, organic matter and microbial community of soil (Nagaraju el al., 2007). The discharged of industrial effluent especially without treatment may have profound influents on physicochemical and biological properties of soils related to soil fertility. A wealth of information on occurrence of changes in properties of soils due to discharge of effluent from other industries is available such as cotton ginning mill (Narasimba et al.,1999), sugar industry (Nagaraju et al., 2007), dairy waste water (David shyam babu, 2010) and dairy industry (Nizamuddin et
al.,2008). Effluents from leather processing, a major industry
that produces huge volume of waste water normally discharged to irrigate agricultural lands. This tannery waste water contains a very little amount of proteins except for the sludge waste that has nitrogenous compound from hides and skins of animals
The analytical determination of metal ions at low concentration levels has received considerable attention in the last few years (Sarazaninic and Mentasti., 1997). The determination of heavy metals including chromium, has traditionally been carried out by atomic absorption spectrometry (AAS) (EN 1233, 1996) or inductively coupled plasma ICP (ISOLL 885), precise and sensitive but allow determination of total chromium only. The concentration of Cr (VI) is estimated from the difference of total chromium content and Cr (III), which can be analyzed using photometric methods this so called difference method causes in accurate calculated concentration of Cr (VI). In this present investigation atomic absorption spectrometry (AAS) was used to determined total chromium ion from industrial tannery effluent discharge on land fill abatement and control land fill.
MATERIALS AND METHODS
Sampling
The soils samples were collected from Gasau (A1) and Daula
(A2) landfills and the Yankusa (A3) control site in Challawa
industrial area, Kano State, Nigeria. Four samples were randomly collected from each site making a total of 12 samples. After the removal of surface litter, 20gram of sample was collected from each of twelve sites at a depth between 10 – 15cm using soils auger into clean polythene bags. All the samples were properly labeled (S1 – S12) and transported to
National Research Institute for Chemical Technology (NARICT) Basawa Zaria, Nigeria for analysis.
Physiochemical properties of contaminated soil and control landfill
pH: Ten grams of the soil samples was taken and added to twenty five ml of distilled water. The mixture was shaken intermittently for 30 minutes. The pH was then determined by using the pH meter in standard bulb solution (Nag 2007).
Temperature
Ten grams of soil sample was taken and added to 25ml of distilled The mixturee was shaken thoroughly for 20 minutes. The temperature was determined using the thermometer in solution (Aneja, 2007)
Organic matter
Two and a half grams of dried, sieved soil was taken into a pre-weighed crucible and ignited over a Bunsen burner to a bright red heat, stirring occasionally with a wire loop. The sample was heated for 15 minutes. Then it was allowed to cool in a desiccator and the weight of the soil was taken. The organic carbon content was calculated as follows:
% Organic matter = loss in weight X 100
Weight of Sample Fawole and Oso, (2004).
Total Nitrogen
One and a half gram of crushed dried soil samples was pour into 300ml Kjelda flask along with 25ml of concentration. H2SO4 and 3g mixed catalyst. The sample was digested using
Kjeldahl digestion apparatus until a clear green or whitish color was obtained. The digested solution was then diluted to 100ml with distilled water. Distillation was done adding 20ml of diluted digest into 500ml Kjeldahl flask containing anti – bumping chips and 40ml of 40% NaOH was slowly added by the side of the flask. A conical flask (250ml) containing a mixture of 50ml 2% boric acid and 4 drops of mixed indicator (Cresol/bromothymol) was used to trap the liberated ammonia. The distillate was then titrated with 0.1m HCL. The total nitrogen content was then calculated using
%N2 =
( ) x 100
Where M = Actual molarity of acid V = Titre volume of HCL used V+ = Aliquot volume distilled (Onyeika and Osieji 2003).
Phosphorus
Fifty grams of the dried crushed soil was suspended and filtered through a nylon cloth into a glass beaker. Twenty five ml of the filtrate was heated for 25 minutes with HN03/HCL in a ratio of 3:1 (digestion). The mixture was dilute was diluted to the 100ml mark with distilled water. Fifteen ml of the diluted solution was then pipette into a cuvette and 1ml of the phosphate reagent was added to it and the reading taken using the phosphate meter (Nag, 2007).
Potassium
To determine the potassium content of soil samples fifty grams of the dried soil was suspended in 50ml of distilled water and filtered using nylon cloth. The filtrate (25 ml) was mixed with HNO3. HClO4 in a 2:1 ratio. The beaker containing the
filtrate was made up to 100 ml by the addition of deionized water digested sample was stored in a sterile polyethylene bottle at room temperature for further analysis of the metal using atomic absorption spectrophotometer.
Calculation
% Potassium = 2 x 0.005
Where R = Potassium Concentration (ppm) in the aliquot (Nag, 2007).
Total Chromium
Fifty gram of the dried crushed soil was suspended in 50ml distilled water in a beaker and was filtered through nylon cloth. Twenty five of the filtrate was collected in a 400ml beaker and 10ml of concentrated H2so4 and 5ml of
concentrated HNO3 were added to the filtrate in ratio3/1. The
beaker containing the mixture was then placed on a hot plate for boiling until the solution becomes clear and then the solution was transferred by filtration through what man Filter paper No2 into a volumetric flask. The volume of the filtrate was made up to 50ml by adding deionised water. Digested sample were store in sterile polyethylene bottles at room temperature for further analysis of the metal using flame atomic absorption spectrometry (FAAS) Rani, 2003.
Statistics
The data obtained in the study were analyzed by one – way of variance (ANOVA) differences between means of chromium ion were considered significant at values of P < 0.05.
RESULTS AND DISCUSSION
In trying to determine the physiochemical characteristics of the soil and the presence of chromium ions in environment due to their toxicity is of great concerned to public health and environment. The data showed the level at which the polluted landfill has been fully devestistated due to the discharged of industrial chemical recipe. The unprecedented discharge of effluent containing chromium ions could be dully mitigated or resuscitated by the abating land through bioremediation process. Soil is a potent system of terrestrial system, and direct discharge of industrial tannery effluent especially that without treatment may have profound influence on physiochemical and biological properties of soil fertility (Narasimba et al, 2011). The colour is usually the first parameter to be recognized in control and polluted landfill due to contaminated waste water that affect the integrity of the land mass. Such colour were observed to be brown, and blue/black in their identity and were symbolized with label (S1, S2, S3 and S4), (S5, S6, S7 and
S8), and (S9, S10, S11, and S12) from control sample,
contaminated site and deposited site respectively. (Dhungana and Yadav, 2009). WHO reported colourless, dirty dark green and green appearance for tannery effluents in like manner affect the colour, appearance and permeability of the virgin soil when discharge. Obnoxious odour is also perceived and recognized within the affected area of effluent discharge compared with the reference soil sample as shown in table 1. The mean pH values of the contaminated soil at Gasau (5.6) and (5.7) Daula was found to be acidic in comparison with
(6.8) Yankusa control site as shown in table 1. Jyoshana and Narasimba (2007) reports show that discharge of effluent from tannery increased the soil pH slightly in comparison with the control soil pH 3.6 – 7.2 and pH 6.8 – 7.2 respectively. Variation in pH values of effluent waste to soils can alter the rate of biological reaction and survival of various microorganisms. Since the control landfill does not contained chemicals recipe. The organisms absolutely, sincerely maintained their level of integrity in terms of improving the soil fertility for their survival as well as the life of plants and animals (Bannats et al., 2008). The varying pH could be attributed to the chemical discharge on landfill due to excessive use of NaOH, H2O2 and atomic stabilizer use during
finishing processes in tanning and in conjunction with environmental stresses brought about by the contamination (wood and Kellong, 2007). The soil samples collected from polluted sites were mostly affected by waste water irrigation due to the presence of heavy metal which affects the pH and might likely reduced the population densities of micro flora within a given habitat.
The mean temperature values of the contaminated and deposited landfills (Gasau and Daula) respectively were (37oC) and (35oC) in comparison with the reference soil sample (30.0oC) Yankusa. The findings are in line with the study conducted by Nandakumar (2008). It appears the values falls within the permissible limit. It might be that at the time the sample were collected at winter season, the reference water sample falls within the ambient temperature and other below. High temperature could be as a result of addition of warm water while low temperature could be attributable for the season of samples collection (winter). Increase in temperature can cause change in the species in a given habitat. It could also reduce solubility of oxygen and amplified odour due to anaerobic and aerobic reaction respectively (Nandakumar, 2008). The electrical conductivity of both contaminated and control soil were (0.57, 0.81) and 1.27µMhos cm-1respectively. Higher water holding capacities of the mean values were observed in contaminated soil than control, values were found to be (0.56, 0.5) and 0.31mg/l respectively. Increased water holding capacity and decreased electrical conductivity in contaminated soil may be due to the accumulation of organic wastes such as amino acid residues and alkalis in tannery industries (Alvare Bernal et al., 2006).
observed, it could be attributed to high concentration of chromium ions that affects the diversity of microbial activity in a given habitat. Some of these less tolerant microorganisms could as well die in the process of struggling for survival. The dead of the organisms could be the reason for high quantity of organic matter in Gasau and Daula contaminated and deposited agricultural landfill; hence, there was no microbial activity within the catchment area of chromium ions disposal as seen in plate 1,2 and 3. Total nitrogen, phosphorus and potassium (NPK) in percentages were higher in all ramifications from contaminated land fill than the control soil except potassium content. The properties of contaminated soil sample were (0.460, 0.293) and 0.100%; (0.385, 0.040) and 0.063%; (0.385, 0.973 and 1.043%. respectively. However, this could be possibly explain that surface run- offs from agriculturally fertilized and neighboring lands, microbial interaction and synergy role play by the plants and the microbes in converting inorganic to organic compound
(mineralization).This might have contributed significantly to the lesser amount of phosphate and nitrogen percentage present in the Yankusa control land fill in comparison with contaminated and deposited soil Gasau and Daula respectively i.e. the lower area of agricultural activities. This is a plause? Except potassium. On the other hand of the essential elements, one could have expected the assimilation to be in this order N> P>K but instead N<P>K. This might be related to the possible use of high amount of fertilizers during such periods by the neighboring farmers. In additions, surface runoffs could have added these nutrients during heavy rainfalls especially as this is the peak rainy season period in the area under study. Thus, there seems to be a low content of phosphate than nitrates. This might also be related to the fact that some aquatic photosynthetic microorganisms utilized phosphate while oxygen-depleted photosphorylative means of energy generation (Isabelle and walter, 1979). The order of this trench N>P>K, nitrate might seem to be less abundant than Physicochemical Properties of Control and Contaminated landfill
Properties s1 s2 s3 s4 s5 s6 s7 s8 s9 s10 s11 s12
Colour Br Br Br Br Br Br Br Br Br Br Br Br
Odour Nor Nor Nor Nor Fou Fou Fou Fou FFou FFou FFou FFou
pH 7.2 6.8 6.4 6.6 5.6 5.3 5.7 3.9 7.2 4.8 5.2 5.7
TemoC 35 37 33 33 37 36 35 40 37 34 34 34
Electric conductivity (Mhouscm3) 1.23 1.29 1.30 1.25 0.62 0.72 0.68 0.58 1.00 0.92 0.58 0.72 Water holding capacity(m/g) of soil 0.30 0.29 0.31 0.32 0.62 0.52 0.51 0.60 0.50 0.63 0.47 0.52 TEXTURE
Sand(g) 74 75 76 73 54 52 49 56 73 74 68 71
Silt(g) 21 20 19 21 23 24 23 25 24 25 23 24
Clay(g) 9 8 7 8 15 17 16 17 17 16 18 15
Organic matter (%) 4.35 4.42 4.20 4.80 8.1 8.4 8.1 8.3 8.1 8.3 8.2 8.0 Chromium ions(mg/l) 2.18 4.15 1.32 1.28 8.36 107.99 67.25 81.52 51.43 57.48 67.08 1.93 Total nitrogen (%) 0.140 0.09 0.019 0.19 0.24 0.23 1.03 1.37 0.33 0.33 0.37 0.14 Potassium (%) 0.610 1.16 1.160 1.24 0.05 0.16 0.26 0.07 0.87 0.43 1.30 1.32 Phosphorus(%) 0.025 0.057 0.012 0.156 1.201 0.233 0.013 0.011 0.011 0.047 0.077 0.023
Yankusa Control Site Gasau Dump Site Daula Deposited site
KEY:Br=Brown ;Nor= Normal Fou= Foul; FFou=Fairly foul
TESTING OF HYPOTHESIS
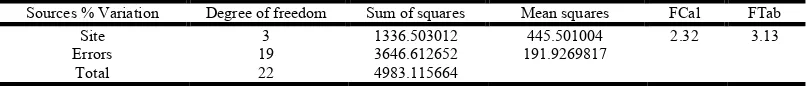
Table 2. Analysis of variance of total chromium on reference control soil (Yankusa)
ANOVA
Sources % Variation Degree of freedom Sum of squares Mean squares FCal FTab
Site 3 1336.503012 445.501004 2.32 3.13
Errors 19 3646.612652 191.9269817
Total 22 4983.115664
[image:4.595.41.556.72.232.2]The calculated values is less than the F. Tabulated, this depicts that null hypothesis is rejected.
Table 3. Analysis of variance of total chromium on contaminated land fill (Gusau)
ANOVA
Sources % Variation Degree of freedom Sum of squares Mean squares FCal FTab
Site 3 828.4206772 276.1402257 0.27 3.13
Errors 19 19592.95777 1031.208304
Total 22 20321.37845
The F Calculated value is less than the F tabulated. This depicts that the null hypothesis is rejected.
Table 4. Analysis of variance of total chromium on deposited site (Daula)
ANOVA
Sources % Variation Degree of freedom Sum of squares Mean squares FCal FTab
Site 3 1336.503012 445.501004 2.32 3.13
Errors 19 3646.612652 191.9269817
Total 22 4983.115664
[image:4.595.96.499.303.346.2]Plate 1. Yankusa Control Land Fill
Plate 2. Gasau Dumpsite
phosphate, for which reason it may therefore be that nitrate could be said to be a limiting nutrient in the productivity of Challawa land fill. The total chromium content of the contaminated soil were also much higher than that of the control as observed in table 1 with varying values ranging between (1.289 – 4.15mg/l) from Yankusa control land full, (8.36 – 107.99 mg/l) from Gasau dumpsite and (1.93 – 67.08mg/l) Daula dumpsite respectively. The study is in line with the result conducted earlier by (Ugoji and Aboaba, 2004). Total chromium implies chromium (II), chromium (III), chromate ion and chromium (VI) ion present in natural water or contaminated soil. Their present in a given habitat depend on interaction with microbes that led to the significantly differ in biological, geo chemical and toxicological properties (Sule and Ingle, 1996). Cr (III) over a narrow concentration range is considered essential for mammals, maintenance of glucose essential for mammals, lipid and protein metabolism at minimal level. Whereas Cr (VI) is reported to have a toxic effect in human (Cotton et al., 1999). In this current investigation, tannery effluent discharged directly on land fill are usually found to contain higher values of chromium in comparison with the control land. According to Ugoji Aboaba, (2004), chromium ion in polluted land had higher concentration 89.30% against the lower values of 0.255mg/l in the control land. However, a possible explanation for its high level is as a result of the used chromium salt during tanning.
This could be disastrous to the concept of a clean environment. It may also enter the food chain through plants, animals as well as water source. Once it gets into food chains by biomagnifications and bioaccumulation of the metal in various living systems may take place. This result was in conformity with that of (Khan, 2006), in which they reported that bioaccumulation and biomagnifications could lead to toxic level of these metals in organism, even if exposure level is very low. This could also cause disruption in the ecological balance when in abundance. However, the said permissible limit for total chromium discharge in the stream or river for irrigation and domestic use should not exceed 0.05mg/l by (WHO, 1985). Then it could be that the rural dwellers that leave within that vicinity are not guarantee of safety. High concentrations of chromium in drinking water can cause skin ulcer, allergic reactions, carcinogenic and mutagenic effect to humans (Matin and Ginswold, 2009). One way ANOVA revealed significant variation, the mean level of pollution between sampling sites Gasau and Daula landfill compared to reference soil samples Yankusa with F calculated values less than the F Tabulated (0.27/3.13, 0.27/3.13 and 2.32/3.13) respectively as indicated in the result obtained. In this present investigation, there is a high level of pollution by chromium ion in Gasau and Daula contaminated landfill with reference to control landfill Yankusa. This may be linked to the fact that the two contaminated sites exceeded the stipulated level of 0.05mg/l (WHO 1985) as shown in table 1 of the Cr ion analysis.
Conclusion
This present investigation atomic absorption spectrometry (AAS) was used to determined total chromium ion from industrial tannery effluent discharge on land fill abatement and control land fill. The analytical determination of metal ions at low concentration levels has received considerable attention in
the last few years (Sarazaninic and Mentasti., 1997). The determination of heavy metals including chromium, has traditionally been carried out by atomic absorption spectrometry (AAS) (EN 1233, 1996) or inductively coupled plasma ICP (ISOLL 885), precise and sensitive but allow determination of total chromium only. The concentration of Cr (VI) is estimated from the difference of total chromium content and Cr (III), which can be analyzed using photometric methods this so called difference method causes in accurate calculated concentration of Cr (VI). In this present investigation, the above parameters measured from control and polluted land fill are potential for profound effect on the contaminated soil itself, resident of microorganism, aquatic life and for further research work that will be done regarding to bioremediation process on land fill abatement.
REFERENCES
Alverez-Bernal DSM, Olalde-portugal JT, Contreras-Remos N, Trujillo- Tapia V 2006. Effect of tanneries waste water on chemical and biological soil characteristics. Appl. Soil Ecol. 33:267-277.
Aneja KR 2007. Experiments in microbiology plant pathology and biotechnology new age plant international publisher 4: 236 – 237.
A PHA, AWWA, WEF 1998. Standard methods for the examination of water and waste water. 20th American public health association, American water works association, water environment federation.
Bannats MI, Nigan P, Singh, D 2008. Microbial Decolorization of Tannery effluent a review Bioresource Technology. 58; 217 – 277.
Cotton FA, Wkinson G, Murilla CAJ, Bochman M 1999. Advanced inorganic chemistry 6th ed. Repika Press, Canada, 756 – 758.
David shyambabu S 2010. Protease and protease and phaspatase activity of soil contaminated with dairy waste water Asian . J. Microbiol. Biotech. Environ Sc. 26:711-714.
Dhungana TP, Yadav PN 2009. Determination of chromium in Tannery Effluent and Study of Adsorption of Cr (VI) on Sawdust and Charcoal from Sugacane Bagasses. J. Nepal Chem. Soc. 23:93-101.
Faisal M, Hasnanin S 2004. Microbial conversion of Cr (VI) into Cr(III) Industrial effluent. Afr. J. Biotechnol., 3:610-617.
Fawole MO, Oso BA 2004. Laboratory manual of microbiology spectrum work Ltd Ring road Ibadan. 45-48 Isabelle G, Walter HM 1976: Botany A functional Approach.
4th Edition. Blackwell Scientific Publications 667.
Jyothsma, DV and Narasimha B 2007. Influence of diary weaste water on soil physiochemical biological and enzymatic properties pollution research 26., 711 – 714. Khan AG 2006. Relationship between Cr. biomagnifications
ratio, accumulation factor and mycorrhizae in plants growing on Tannery effluent-polluted soil. Environ Int. 26:417-423.
Nag A 2007. Analytical techniques in agriculture, biotechnology and environmental engineering. Prentice – hall of india, new delhi 84 – 102.
Martin S, Grisworld W 2009. Human Health effluent of heavy metals center for hazardous substance research, Kansas State University, issue 15. Http www.enqq.ksu.edu/CHS4 assessed 2009. 23:12
Masood F, Malik FA 2011. Bull Environmental Contamination Toxicol United.
Nandakumar 2008. Tannery and Chromate industries effluent on soil animal and plant in soil polluted organisms (ed: PC Mishra). Asish Publishing House, New Delhi 81 – 105. Narasimha, G. Sridevi A. Venkatas and Rajasekhar, R 1999.
Effleunts of cotton ginning mill effluents on soil enzymatic activities and nitrogen in memorization on soil.
Narasimha GA, Stridevi A, Venkata SR, Rajasekhar BR 2011. Effects of cotton ginning mill effluents on soil enzymatic activities and Nitrogen minelization in soil. J. Chem. Pharm. Res. 31:128-137.
Nizamuddin SA, Sridevi A, Narasimba G 2008. Impact of dairy factory effluents on soil enzyme activities Eco. Environ Cons.14:89-94.
Onyekeike EN, Osuji JO 2003: Research Techniques in Biological and Chemical Science Springfield Publisher Ltd. Owerri.
Parameswari E, Lakshmanan A, Thilagavathi T 2009. Bioadsorption of chromium (VI) and Nikel (II) by bacterial isolates from an aqueous solution. Electronic J. Environ. Agric. Food Chem. 8(3):150-156.
Rani F 2003. Role of microorganisms in bioremediation of heavy metal ions and organic pollutants present in textile industry. Unpublished Ph.D thesis submitted to the Department of Biological Sciences, Quaid-l-Azam University, Islamabad Pakistan.
Sarzanini G, Mentasti E 1997. Detrermiantion and specification of metals by liquid chromatography journal chromatography 789:301.
Sule PA, Ingle J JD 1996. Effluent discharge anal Chim Acta 326:85.
Ugoji E O, Abaoba, OO 2004. Biological treatments of textile industrial effluents in Lagos metropolis, Nig. J. of Environ. Biol. 25 (4): 497 – 02.
UNIDO 2005. United Nations Industrial Development organizations cost of t Tanned Waste Treatment 15th session of the leather and leather products industry panel, leon, Mexico.
WHO (World Health Organization) 1985. WHONET 5.4 update notes Geneva.
Wood A, Kellong S.T 2007. Biomass cellulose and hemicelluloses methods enzymes 160: 632 – 634.
Zang K, Li F 2011. App. Microbol. Biotechnol. 90: 1163.