R E V I E W
Open Access
Transcriptome level analysis in Rett
syndrome using human samples from
different tissues
Stephen Shovlin
1and Daniela Tropea
1,2*Abstract
The mechanisms of neuro-genetic disorders have been mostly investigated in the brain, however, for some pathologies, transcriptomic analysis in multiple tissues represent an opportunity and a challenge to understand the consequences of the genetic mutation. This is the case for Rett Syndrome (RTT): a neurodevelopmental disorder predominantly affecting females that is characterised by a loss of purposeful movements and language accompanied by gait abnormalities and hand stereotypies. Although the genetic aetiology is largely associated to Methyl CpG binding protein 2 (MECP2)
mutations, linking the pathophysiology of RTT and its clinical symptoms to direct molecular mechanisms has been difficult.
One approach used to study the consequences ofMECP2dysfunction in patients, is to perform transcriptomic analysis in tissues derived from RTT patients or Induced Pluripotent Stem cells. The growing affordability and efficiency of this approach has led to a far greater understanding of the complexities of RTT syndrome but is also raised questions about previously held convictions such as the regulatory role ofMECP2, the effects of different molecular mechanisms in different tissues and role of X Chromosome Inactivation in RTT.
In this review we consider the results of a number of different transcriptomic analyses in different patients-derived preparations to unveil specific trends in differential gene expression across the studies. Although the analyses present limitations- such as the limited sample size- overlaps exist across these studies, and they report dysregulations in three main categories: dendritic connectivity and synapse maturation, mitochondrial dysfunction, and glial cell activity. These observations have a direct application to the disorder and give insights on the altered mechanisms in RTT, with implications on potential diagnostic criteria and treatments.
Keywords:Rett syndrome, Methyl-Cpg-binding protein 2, Transcriptomics, MicroArray, RNASeq
Background
Rett Syndrome (RTT) is a rare (1 in 10,000 live female births) and complex neurodevelopmental disorder fre-quently associated with mutations in the gene coding for Methl-CpG binding Protein 2 (MECP2). Despite the limited genetic aetiology, the clinical presentation of the disorder and the genetic mutations are heterogeneous. The identifi-cation of the gene associated to RTT: MECP2, lead to the generation of mouse models that recapitulate the signs of the disease. Using the mouse models it has been shown that
some of the symptoms of RTT are present even if the gene is regularly expressed in the nervous system (but not the remaining tissues), supporting the observation that RTT is not restricted only to brain malfunctions. This notion stresses the importance of considering several tissues in addition to the brain for the study of RTT.
Changes in gene expression have been explored as an unbiased read out of the molecular mechanisms related to RTT. Our analysis explores the genes dysregulated in different tissues in RTT patients and summarizes the results in accordance with the pathophysiology of the disorder. This is the first review which summarizes the gene expression studies in patients.
* Correspondence:[email protected]
1Neuropsychiatric Genetics Research Group, Trinity Translational Medicine
Institute- TTMI, St James Hospital, D8, Dublin, IRELAND
2Trinity College Institute of Neuroscience, TCIN, Loyd Building, Dublin2,
Dublin, IRELAND
RTT syndrome onset and progression
Rett syndrome is an X-linked, neurodevelopmental disorder found to nearly exclusively affect female pa-tients. Infants have an apparently normal early post-natal development, but signs and symptoms of RTT begin to present around 6 to 18 months after birth. RTT classically is characterised as a loss of purposeful hand movements and acquired skills, loss of language, hand stereotypies such as wringing or clapping and abnormal gait. These symptoms gener-ally progress across stages, including a period of stabilisation after initial regression phase. When the main RTT criteria are present, and accompanied by a period of stabilisation after the regression period, the patients are classified as having typical or classic RTT [1] although there is distinct classification of atypical RTT. Atypical RTT is an umbrella term for a number of RTT variant disorders that exist. Known variants include Early Seizure RTT which is associ-ated with mutations to the CDKL5 [2], Preserved Speech Variant or Zapella Variant [3], Congenital RTT which is associated with mutations to the FOXG1 gene [4], “forme fruste” RTT [5, 6] and Male variant RTT [7].
There are four stages of classic RTT: stage 1 - early onset of disease after birth (between 6 and 18 months), stage 2 -developmental regression, stage 3 - psuedosta-tionary stage (a stabilisation after regression period) and finallystage 4- a late motor deterioration stage [8]. Typ-ical RTT is strongly associated with a loss of function mutation to the global transcriptional regulator MECP2 (Methyl-CpG-binding protein 2) and represents over 95% of typical RTT cases and 75% of variant RTT cases [9].
Despite this strong association between MECP2 mutations and RTT, there are patients with MECP2 mutations that do not have the clinical presentation-this has been shown to be as high as 1.1% in a north American database of RTT [10, 11]. In atypical RTT -as mentioned previously- other genes such as CDKL5 and FOXG1 are associated with the clinical presentation [1]. However recently CDKL5 has been distanced from RTT as it results in an early onset encephalopathy that tends to present more severely, with greater propensity for epileptic activity [12, 13]. The cases where RTT occurs with no MECP2 muta-tions help to illustrate that the genetic aetiology alone cannot confer the RTT phenotype and indeed even within the typical form of RTT there are differ-ing levels of severity between patients. For the pur-poses of this review we will be specifically looking at studies that use typical RTT patients with the excep-tion of Colak et al. 2011 [14] who compared typical RTT and RTT-like patients to control patients to find common pathways between the disorders.
Methodological approach
Understanding the molecular mechanisms of RTT from transcriptomic analysis of patient derived samples presents several challenges: the rarity of the condition, tissue composition, heterogeneity between samples, and different methods for RNA quantification and analysis.
As RTT is primarily a neurodevelopmental disorder, post-mortem brain samples are the only source that in-cludes tissues with the primary pathology of the disorder and conducting research with them requires age matched, clinically and genetically comparable samples from the same brain regions. The rareness of the disorder make this a tall order. Even if samples are available there is still the problem of heterogeneity of cell populations across brain samples which can bias gene expression [15,16]. Although this issue has been solved in mouse studies [17], RTT patients present the additional complication that X-inactivation is variable in different cells.
The main dysfunctions of RTT are associated to brain function, yet MECP2 is a ubiquitously expressed gene across the body and we need to take into account the de-rivation from different tissues when analysing the results of RNA expression. Recent studies in mice showed that Mecp2mutations in whole body but not brain, determine the appearance of symptoms of the disease associated to muscular weakness and bone integrity showing that the brain is not the only area involved in determining the RTT phenotype [18]. These results prompt a re-evaluation of more peripheral tissues for the investigation of molecu-lar dysfunction in RTT, and in particumolecu-lar, the studies per-formed in peripheral blood, which is a preferred source for studies in patients.
Another interesting aspect to keep in mind when comparing different studies, is the evolving nature of the transcriptomic technology: - RNA-sequencing techniques have replaced microarray as the technique of choice when comparing lowly expressed differential changes. Dynamic range detected with RNA-Seq is optimized when compared to microarray, meaning that resolution of higher fold-changes is improved [19,20]. The benefits of RNA-Seq arise from the direct reading of the transcript sequences as opposed to microarray which is based on the hybridisation samples to a number of predesigned probes, searching for a limited number of transcripts, developed by manufacturers. Later versions of microarray chips and techniques looked to increase detection of genes by increasing the number of transcripts tested for, with strong replication and reliability of transcript detection [21].
Post-mortem brain samples
and financial burden of RTT has meant that only 4 tran-scriptome level studies using post-mortem brain samples [23–26] have been produced. Each of these studies has had to contend with different limiting factors in their approach and analysis meaning that none of the studies are compatible enough to conduct a meta-analysis. Age groups, mutation type, control comparisons, analysis techniques and brain region used all varied across the studies.
Colantuoni and colleagues provided the first evidence of Differential Gene Expression (DGE) in post-mortem brain (PMB) samples, comparing 6 typical RTT patients with 6 age and sex matched controls across a number microarray platforms and using a number of statistical software programs to increase detection sensitivity and reliability [23]. Brain tissues utilised from the patients were taken from Brodmann areas (BA) 1–5 of the frontal and parietal cortices. Their results identified 3 major areas of DGE: neuronal maturation genes, presynaptic marker genes and glial specific genes. These results point to a disruption of synaptic connections (specifically presynaptically), synapse maturation, synap-tic transmission and increased reactivity of glia.
Deng and colleagues conducted a microarray study to examine DGE in both human RTT patients and murine models. They subsequently used their results of the RTT patient data to generate a mouse model with overexpres-sion of the FXYD1 gene which was found consistently over expressed in the RTT samples [24]. FXYD1 is a FXYD domain ion transport regulator which modulates the Na+/K+ ATPase channel activity. FXYD1gene over expression in mouse neurons induced reduction in dendrite spine density as determined by Scholl analysis. In support of the role of FXYD1 gene in RTT, two methylation promotor sites in the FXYD1 gene have been shown to be binding sites for MeCP2. Further study was carried out on the role ofFxyd1inMecp2 de-ficient miceMatagne and ColleaguescrossedFxyd1null male mice with Mecp2 308 hetrozygous female mice to examine the behavioural effects of ablating the over ex-pression response of Fxyd1 to Mecp2 deficiency [27]. The behavioural results of these mice showed a rescue in the recognition of novel location when both alleles for Fxyd1 were deleted but not with a single allele deletion with no further rescue to any other behavioural testing. They also found that Fxyd1 KO with normalMecp2 ex-pression showed a similar impairment asMecp2deficient mice in this task. These results have shown that modulat-ing the expression ofFxyd1levels can rescue very specific hippocampal dependent cognitive functioning.
For Deng et al.’s study brain samples were taken from the superior frontal gyrus (SFG) which is adjacent to Colantuoni and colleague’s samples at BA1–5 (primary somatosensory, primary motor cortex and part of the
parietal cortex just posterior to the primary somatosen-sory cortex). Although these are distinct regions of the cerebral cortex, MECP2 expression in the human RTT brain is generally distributed across cortical regions al-though there is a clear preferential expression in matured neurons [15].
In another study Gibson et al. 2010compared frontal and temporal cortices of 6 RTT patients and 6 health sex-matched controls to examine DGE in human RTT Post-Mortem Brian samples. However the lack of age matched in control samples in this study is clearly a con-founding factor. In order to compensate for this added level of variability Gibson and colleagues used four way comparison (Both frontal and occipital cortices of RTT and control samples) to analyse differential expression [25]. For DGE comparison a gene was required to be sig-nificantly expressed in 5 out of 6 patients. The idea in this study is to compare a region highly effected in severe RTT phenotypes (Frontal cortex) versus a region thought to be less affected (occipital cortex) as well as the traditional control versus disease comparisons [28, 29]. The results indicated an upregulation of Dynamin 1, Amyloid like protein 1, Clusterin, Cytochrome C Oxidase, and Collap-sin Response Mediator Protein 1 (DMN1, APLP1, CLU, MT-CO1, CRPM1) in frontal cortex. Interestingly the Clusterin protein appears to be induced by Histone deace-tylation inhibitors [30] which would make sense when consideringMECP2’s molecular mechanism is thought to be mediated by recruitment of Histone Deacetylase 1, HDAC [31]. However recent studies on brain evoked activity in RTT patients showed that the occipital area presents circuits alteration in RTT [32] making assump-tion ofGibson and colleaguesweaker.
The final study was conducted by Lin and colleagues analysed samples from 4 RTT patients and 4 age-, sex-and ethnically matched controls. They used a murine model of RTT to provide further independent verifica-tion of the expression of the differentially expressed genes [26]. Two distinct chemistries were used in this study, microarray and RNA-seq. There findings which were confirmed using an independent RTT mouse model dataset [33] and showed 13 significantly differen-tially expressed genes. Notably the C1Q complex genes C1QA,C1QBand C1QCwere all found to be decreased in expression, while a number of complement pathways C3,TGFBR2, CXCR1 and TYROBP were also observed to be downregulated.
Blood tissue samples
hand blood is a tissue that is relatively accessible and is minimally invasive. These properties make blood sam-ples ideal for time course studies taken at multiple times and giving researchers the ability to temporally measure variables in the same RTT patient.
Pecorelli and colleagues used a Microarray technique to analyse DGE of Peripheral blood lymphomonocytes (PBMC) of 12 RTT patients compared to 7 age and sex matched controls. The study used 2 analysis models to find significant differential expression, these analysis programs were highly congruent 480 differentially expressed genes (DGE) with only 11 genes being found in only one of the programs [34].
Gene Ontology term and clustering analysis was then performed to identify pathways either up or down regu-lated, showing four major components: genes with chro-matin folding were down-regulated, while genes relating to mitochondrial functioning, genes relating to antioxi-dant defence, and genes with ubiquitin-proteasome sys-tem functions were all up-regulated in patients versus controls. The authors suggest a feedback response: ex-pression of antioxidant defence and Ubiquitin Prote-asome System (UPS) related genes would increase in response to the altered expression of mitochondrial functioning proteins creating overall an increase in the oxidative stress.
Other evidence has shown that RTT is associated with a higher level of oxidative stress and production of Re-active Oxygen Species (ROS) [35, 36]. Pecorelli and col-leagues showed upregulation of a number of mitochondrial complex genes in RTT PBMC suggestive of a reduced respiratory efficiency and an aberrant pro-duction of ATP levels, although ATP levels were not dir-ectly measured in this study. Taken together the upregulation of mitochondrial functioning related genes along with the increase in cellular anti-oxidant defence related genes, it is likely that there was an increased production of ROS. ROS are also known to effect the proper folding and function of proteins, oxidised proteins are dysfunctional and require clearing via the ubiquitin-proteasome related genes [37] by the Ubiquitin-Proteasomal system (UPS). The upregulation of Ubiquitin-proteasome related genes in this study, Pecorelli et al. 2013 is indicative once again of the in-creased oxidative stress of RTT patients.
Colak and colleagues used whole blood as their tissue source of 3 typical RTT patients and 2 RTT-like pheno-types and compared them to 7 age and sex matched controls using microarray analysis. The purpose of their work was to identify potential shared mechanisms be-tween typical and atypical RTT. Their data suggested that RTT-like patients have dysregulation in oxidative phosphorylation, mitochondrial functioning, tumour suppressor p53 signalling and docasahexaenoic acid
signalling. Of particular note here was the RTT-like pa-tients- but not classic RTT papa-tients- showed a dysregu-lation of mitochondrial functioning. Network analysis identified potentially critical regulatory functions of the following genes, IL1, IL1R1, TGFβ, interferon-α and –β and NFκB pathways in both classic RTT and RTT-like patients. The NFκB pathway is thought to have a critical role in synapse development [38]. As well as NFκB path-way, Calcium homeostasis, cholesterol metabolism and NFAT/Calcinurin signalling were implicated through the bioinformatic analysis in both phenotypes.
Induced pluripotent stem cells derived from Rett patients Induced pluripotent stem cells (IPS) are a relatively recent technique that represent an intriguing solution to the in-ability of researchers to study directly RTT neuronal cells in vivo. IPS cells are cultured from primary cell sources and treated to reverse their cell fate using a number of overexpressed reprogramming factors OCT4, SOX2, KLF4, and MYC. These reprogrammed cells have pluripo-tency and the ability to be cultured and differentiated into specific cell types depending on culturing microenviron-ment [39]. Recently these techniques were employed using RTT patient fibroblasts to reprogram and then differenti-ate IPS cells into RTT phenotypic neurons [40–43]. The findings from these studies showed that the differentiated neuronal cells from cultured from RTT-IPS cells were consistent with RTT phenotype. Interestingly, some stud-ies found that IPS cells and the derived neurons retained non-random highly skewed X Chromosome Inactivation or XCI [43–45] while others have shown a reactivation of the fibroblasts inactive X Chromosomes [40,41], however, once all IPS cells were cultured and differentiated into neurons, all cells showed XCI.
Tanakaandcolleaguescompleted a recent study investi-gating DGE in undifferentiated RTT-IPS cells to investigate the regulatory role ofMECP2loss of function mutations on early cell development. They used both mutant and control MECP2expressing cell line from the fibroblasts of RTT pa-tients, sequenced the samples and found that mutant RTT-IPS cells showed de-repression of X-linked genes [47]. Several biological pathways were also found to be affected in mutant RTT-IPS cells but importantly each MECP2 mutation appeared to give a different pathway profile. Im-portantly, stem cell development processes did not appear to be affected byMECP2mutant expression, although mat-uration marker NOTCH1 was repressed in all RTT-IPS cell lines and AKT1, another maturation marker was found to be significantly altered in 2 out of 5 mutant RTT-IPS cell lines. Altogether these results show that even at an undifferentiated stage of cell development, RTT cells are beginning to diverge from normal development. The unique profiles shown by each MECP2 mutation cell line highlight the importance of developing methods for accur-ate treatment screening for RTT with potential applications in future medical care.
According to the findings in each of these different studies described we identified three main mechanisms that are altered in RTT: dendritic arborisation and synaptic maturation, mitochondrial function, and glial activity. In the following sections we will describe these in more detail and how other work in the literature backs up these mechanisms.
Abnormalities in dendritic Arborisation and synaptic maturation
Although the first real signs of the onset of RTT are the impaired developmental and neurocognitive symptoms that present between 6 months and 1 year [8], in some patients microcephaly has provided an even earlier indi-cation of the presence of RTT [48]. Brain weight and volume too have been shown to be decreased in early post-mortem analysis of RTT [29, 49]. These Early stu-dies have indicated that RTT brain morphology may be drastically different to warrant such global changes.
Indeed when the microstructure of RTT neurons from human patients and mouse model RTT brains was ana-lysed, decreases in dendritic spine density and neuronal cell soma size were repeatedly observed [49–52]. These two characteristics, decreased dendritic spine density and neur-onal soma size are thought to be the salient morphological changes that occur in the RTT brain phenotypes [53, 54]. This phenotype has been linked to RTT genetically by the theory that loss of function mutations in MECP2 disrupt synaptic maturation processes at a critical time in develop-ment, causing deficient dendritic expansion, an increase in BDNFand neurotransmitter abnormalities which would all
contribute to further dendritic reductions and synaptic pruning [55].
Given this background, it comes as no surprise that the transcriptomic studies in human post-mortem brain samples provided strong evidence to support the abnor-malities to dendritic spine dysgenesis and synaptic ma-turation. There was a decrease in presynaptic markers found in Colantuoni and colleagues study as well as some increase in the postsynaptic markers [23], while Deng and colleagues found that FXDY1 increased expression in both human and mice brain samples and resulted in decreased synaptic density when Fxdy1 was overexpressed in murine models.Gibson and colleagues found that CRMP1, which is normally localised in the dendrites of hippocampal neurons and is involved in neural process outgrowth, showed an increase in the frontal cortex. They hypothesised that abnormal expres-sion of CRMP1 could contribute to a decrease in den-dritic arborisation, through abnormal process outgrowth and Long-term potentiation [25]. Colak and colleagues results in whole blood show that the NF-kB (Nuclear Factor Kappa B Subunit 1) pathway was observed to be disrupted in whole blood of RTT and RTT-like patients. Increased NF-kB signalling has been shown to contrib-ute to loss of dendritic spine density at the callosal pro-jection neurons of MeCP2 knockout mice. Decreasing this aberrant NF-kB signalling could rescue dendritic phenotype and improved the survival of such KO mice [56]. SpecificallyColak and colleagues found that NFAT complex genes: NFATC2 and NFATC3 were downregu-lated, and postulate that this disruption to the NFAT/ Calcineurin complex caused a decrease to axonodendri-tic connections and disrupted synapaxonodendri-tic proliferation in both RTT and RTT-like blood tissue [14].
colleagues found that undifferentiated RTT-IPSC showed overrepresentation of synaptic transmission, axon guidance and neural projection development which would indicate that changes take place earlier in development. These path-ways were not equally altered across patients and indicated that each MECP2mutation had a different profile of dis-rupted pathways [47].
Not all evidence from the transcriptomic studies pointed directly to the loss of dendritic arborisation and loss of synaptic maturation though. Lin and colleague’s major finding in RTT Post-mortem brains was a downregulation of the C1Q complex genes. These genes play a role in microglial synaptic pruning. Downregulation of C1Q is suggestive of less synaptic pruning and therefore an in-creased dendritic spine density however this is no direct measure of dendritic spine density in this study [26].
Although it is not possible to state definitively that the loss of dendritic arborisation is the primary change re-sponsible for clinical manifestations the RTT phenotype, it is clear the recurrence of these structural abnormalities likely contribute to the RTT phenotype or at least the neurocognitive deficiencies. This hypothesis is supported by recent work byRoss and colleagues[18] who explored the peripheral component of RTT, by creating a Peripheral Mecp2 Knockout (PKO) mouse model which specifically addresses the effects of mice with neurotypical architec-ture but disrupted Mecp2 expression in the rest if the body. Their findings showed much improved severity score, survival, and body weight, although after a year wildtype and PKO were still significantly different weights. The study showed that the central nervous system compo-nent of RTT is responsible for the majority of the symp-toms of RTT. Behavioural, sensorimotor and even autonomic deficiencies appeared to be rescued in these mice. However a peripheral phenotype was observed, hypo-activity, exercise fatigue and bone abnormalities were all detected in the PKO mice. The importance of this finding should not be over looked, hypo-activity and fa-tigue are interesting in the context of MECP2’s effect on mitochondrial dysfunction which will be discussed in the subsequent section.
There are two main outcomes of these studies: first, results derived from IPSCs are not totally overlapping with results coming from brain samples. This is likely to be due to the different stage of maturation in the samples from the two different populations. Second, al-though- as expected- the majority of the genes dysregu-lated in the category of dendritic connectivity and synaptic maturation derive from studies on brain post-mortem samples, some genes identified in blood samples are also been showed to be involved in synaptic maturation (i.e.NFkB pathway).
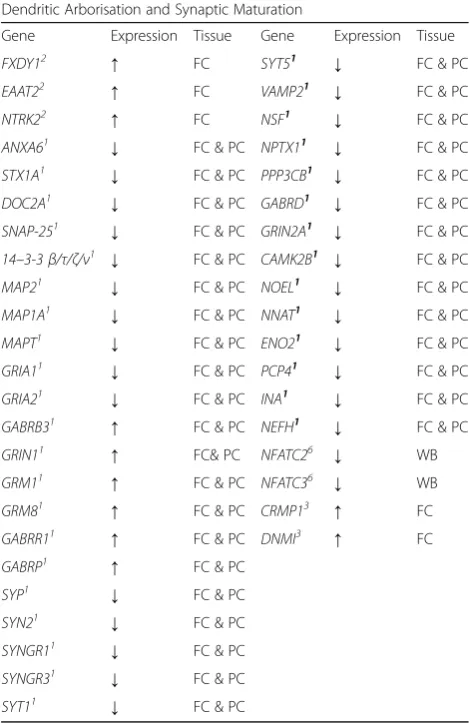
A list of the genes that evidence the disruption to syn-aptic maturity and dendritic arborisation were detected
as significantly different in across these studies is listed below in Table1.
Mitochondrial dysfunction
[image:6.595.304.540.123.485.2]The link between RTT and mitochondrial dysfunction was made by a number of researchers back in the early 1990s [60–62]. The rationale behind these studies was the over-lap in symptoms found in RTT and in mitochondrial dis-ease: early developmental delay, mental retardation, seizures, motor dysfunction, GI reflux, cardio- and re-spiratory problems [63]. Mitochondrial dysfunction and diseases are associated with an increase in oxidative stress due to imbalance in energy production which leads to the generation of ROS [36,64,65]. Mitochondrial dysfunction has been less studied as a mechanic of the pathophysi-ology of RTT compared to the neuronal and developmen-tal mechanisms but has recently received more attention.
Table 1Summary of the gene expression evidence for changes in dendritic arborisation and synaptic maturation identified by transcriptomic analyses in human Rett Syndrome tissues
Dendritic Arborisation and Synaptic Maturation
Gene Expression Tissue Gene Expression Tissue
FXDY12 ↑ FC SYT51 ↓ FC & PC
EAAT22 ↑ FC VAMP21 ↓ FC & PC
NTRK22 ↑ FC NSF1 ↓ FC & PC
ANXA61 ↓ FC & PC NPTX11 ↓ FC & PC
STX1A1 ↓ FC & PC PPP3CB1 ↓ FC & PC
DOC2A1 ↓ FC & PC GABRD1 ↓ FC & PC
SNAP-251 ↓ FC & PC GRIN2A1 ↓ FC & PC
14–3-3β/τ/ζ/ν1 ↓ FC & PC CAMK2B1 ↓ FC & PC
MAP21 ↓ FC & PC NOEL1 ↓ FC & PC
MAP1A1 ↓ FC & PC NNAT1 ↓ FC & PC
MAPT1 ↓ FC & PC ENO21 ↓ FC & PC
GRIA11 ↓ FC & PC PCP41 ↓ FC & PC
GRIA21 ↓ FC & PC INA1 ↓ FC & PC
GABRB31 ↑ FC & PC NEFH1 ↓ FC & PC
GRIN11 ↑ FC& PC NFATC26 ↓ WB
GRM11 ↑ FC & PC NFATC36 ↓ WB
GRM81 ↑ FC & PC CRMP13 ↑ FC
GABRR11 ↑ FC & PC DNMI3 ↑ FC
GABRP1 ↑ FC & PC
SYP1 ↓ FC & PC
SYN21 ↓ FC & PC
SYNGR11 ↓ FC & PC
SYNGR31 ↓ FC & PC
SYT11 ↓ FC & PC
Colantuoni et al. [23]1
, Deng et al. [24]2
, Gibson et al. [25]3
, Lin et al. [26]4
, Pecorelli et al. [34]5
, Colak et al. [14]6
, Tanaka et al. [47]7
Kriaucionis and colleagues [66] reopened the question of mitochondrial dysfunction in RTT with the discovery Ubiquinol-cytochrome c reductase core protein 1orUqcrc1 overexpression in RTT mouse model. Since then findings in the relationship between mitochondria dysfunction and RTT phenotype have been gathering [67–69], this has cul-minated in the EPI-743 phase II clinical trial in 2014 (NCT01822249) which is a vitamin E compound targeting energy production via targeting of NADPH quinone oxi-doreductase 1 (NQO1) developed by Edison pharmaceuti-cals. A more recent vitamin E derivative Trolox has been developed and has recently been tested in preclinical models [70].
Evidence for disturbed mitochondrial function in RTT was predominantly derived from Pecorelli et al. 2013 [34] study in human RTT whole blood. With their find-ings implicating mitochondrial complexes 1 to 5 as well as ATP synthase and ATPase inhibitory factor gene 1 all upregulated in RTT whole blood. Of particular note is theCytocrome C Oxidase/COXgenes which were upreg-ulated with a mean fold increase of 1.5 times. COX ex-pression and enzymatic activity were examined in the frontal cortex of post-mortem RTT brains in Gibson et al.’s [25] work, where a reduction in both of these was observed. Altered Cytochrome b-c 1 complex subunit 1 orUQCRC1expression had previously been observed by Krianciouset al. and shown to be disrupt mitochondrial respiration in mouse neuroblastoma cell culture [66]. This paper also supports the observations that mito-chondrial complexes I and III are down and upregulated respectively in RTT.
Colak and Colleagues[14] found that only RTT-like pa-tients had mitochondrial dysfunctions through network analysis of whole blood samples, where classic RTT did not show the same extent of mitochondrial dysfunction relative to the RTT-like patients. However there was a very limited number of patients used it in this samples that would affect the statistical power of the experiment (3 classic RTT and 2 RTT-like samples were used by Colak and colleagues compared to 12 classic RTT samples in Pecorelli and colleagues study in 2013 paper [14, 34]). There is further evidence for and against mitochondrial dysfunction mechanism in the in RTT derived Induced Pluripotent Stem cells (RTT-IPS). In undifferentiated RTT-IPS there was an increase in expression of NR3C1, which encodes a mitochondrial transcription factor as well as MRPS33 which encodes a mitochondrial ribosomal protein. MRPS33 was also increased in the PBML while NR3C1 was not differentially expressed. However when RTT-IPS were differentiated towards neural cell fate in Andoh-Noda and Colleagues work [71], the increase to NR3C1was not found. Interestingly, genes linked to mito-chondrial dysfunction appear to be dysregulated in all the cells and tissues examined. The list of genes supporting
the mitochondrial dysfunction observed in RTT human tissues comparted to control can be found listed below in Table2.
[image:7.595.305.540.119.487.2]A further point of interest here is that two studies have discussed both mitochondrial dysfunction and den-dritic abnormality together.Großerandcolleagues postu-lated how mitochondrial dysfunction in RTT could affect dendritic signal integration and plasticity while Belichenko andcolleagues went as far as to identify not only coincidence but show co-localisation of both den-dritic spine dysgenesis and mitochondrial dysregulation in mutant Mecp2 mice [51, 72]. Specifically they found enlargement of mitochondria and altered structure of cristae at the dendrites of mouse neurons. Recent at-tempts to target the mitochondrial dysfunction in RTT has been strong enough to warrant human testing with
Table 2Summary of the gene expression evidence for changes in mitochondrial functioning genes identified by transcriptomic analyses in human Rett Syndrome tissues
Mitochondrial Functioning Genes
Gene Expression Tissue Gene Expression Tissue
COX6C5 ↑ PBMC COX6C5 ↑ PBMC
COX7A125 ↑ PBMC ETFA5 ↑ PBMC
COX7C5 ↑ PBMC UQCRQ5 ↑ PBMC
COX8A5 ↑ PBMC TIMM105 ↑ PBMC
COX145 ↑ PBMC TSPO5 ↑ PBMC
URCRQ5 ↑ PBMC TOMM75 ↑ PBMC
UQCRFS15 ↑ PBMC MT-CO13 ↓ FC
UQCRH5 ↑ PBMC MRPS335,7 ↑ RTT-IPS & PBMC
SDHB5 ↑ PBMC NR3C17 ↑ RTT-IPS
NDUFV25 ↑ PBMC
NDUFS45 ↑ PBMC
NDUFA95 ↑ PBMC
NDUFS65 ↑ PBMC
NDUFB105 ↑ PBMC
NDUFB45 ↑ PBMC
NDUFC25 ↑ PBMC
NDUFS55 ↑ PBMC
NDUFC15 ↑ PBMC
NDUFB95 ↑ PBMC
NDUFA85 ↑ PBMC
NDUFAB15 ↑ PBMC
NDUFA25 ↑ PBMC
NDUFB65 ↑ PBMC
ATP5A15 ↑ PBMC
Colantuoni et al. [23]1
, Deng et al. [24]2
, Gibson et al. [25]3
, Lin et al. [26]4
, Pecorelli et al. [34]5
, Colak et al. [14], Tanaka et al. [47]7
clinical trials like the EPI-743 and Triheptanoin phase 2 trials (NCT02696044 and NCT01822249 respectively). These trials could determine the utility of targeting mitochondrial dysfunction in RTT. Considering all this evidence and the real possibility of clinical application in a mitochondrial rescue approach to treating RTT pa-tients, mitochondrial dysfunction represents an import-ant feature of Rett that is supported by a number of the transcriptomic studies.
Glial cell activity
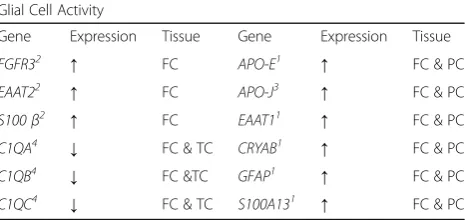
In recent times the role of glial cells has been explored in RTT patients. Initially glial cells were thought not to be important in the study of RTT asMECP2was consid-ered exclusively neuronally expressed in the CNS. Earlier immunocytochemical methodologies were unable to de-tect glial MECP2 expression in humans [15] and there-fore the role of glia was diminished in RTT. However more recent research conducted in the role of glia and RTT has yielded more contradictory results. Microglia have been found to be partly responsible for or at least contribute the RTT phenotype in mouse models [73] in addition, astrocytic re-expression of MECP2 has also been observed to improve motor and respiratory deficits and increase longevity in mice models of RTT [74]. However reintroduction of Wildtype microglia has been shown not to be able to rescue normal functioning [75]. These findings in RTT mouse models were foresha-dowed though by the Colantuoni and colleagues [23] whose transcriptomic analysis of RTT patient’s post-mortem brain samples detected increases in a num-ber of specific glial cell markers including GFAP, S100A13, α B-crystallin, and EAAT1. This insight into observed glial expression that occurred directly in the brain tissues of RTT patient’s years before it was ob-served in preclinical models. This illustrates the value of measuring gene expression in human patients in spite of the technical and logistical challenges of such experi-ments present.
Contrary to the previous attempts to quantify MECP2 expression in glia, more sensitive antibodies have made it possible to detect MECP2 expression in astrocytes. Non-cell autonomous impact from MECP2 mutant as-trocytes has been shown to perpetuate a RTT like phenotype too [74, 76, 77]. These detrimental effects could also be rescued via appropriate expression of MECP2 in the effected astrocytes [74]. Glutamate has been strongly implicated as being the major player in this non-cell autonomous effect, specifically glutamate clearance [78,79]. This is especially interesting consider-ing the findconsider-ings from Colantuoniet al. and Deng et al. respectively [23, 24] who the glutamate transporters EAAT1andEAAT2are both upregulated in the RTT hu-man brain. EAAT2 or Glutamate transporter 1 is also
found in high concentrations on normal astrocytes in throughout the brain and is responsible for 90% of all glutamate uptake [80] whileEAAT1or theglutamate as-partate transporter is expressed earlier in development and expressed in lower concentration thanEAAT2[81].
Downregulation of EAAT1 and EAAT2 expression in response to glutamate exposure have been shown to be im-paired in astrocytic cultures ofMECP2KO mice compared to wildtype, illustrating an acceleration of Glutamate clear-ance [79]. On top of this abnormal glutamate metabolism, microglia have shown an increased release of glutamate, which is thought to contribute the aberrant dendritic archi-tecture in neurons [78]. The proteins produced by GFAP and S100βare both increased in astrocytes of Mecp2 KO mice [79] which again were found to be increased in post-mortem RTT frontal cortices [23,24].
Further evidence of disruption to microglial was also found across the transcriptional studies. Clusterin or APO-J produces a protein associated with microglial ac-tivation [82] was increased in post-mortem RTT brain in Gibsonet al.’s study.Lin and colleagues found that C1Q complement genes were downregulated in RTT human brains, they postulated three possibilities. Either there was a reduction in the total number of microglia, or there was normal resting state microglia but a reduced activation, or that the decreased expression of C1Q was found in neurons [26]. Table 3 lists the genes differen-tially expressed across the transcriptomic studies that support the role of glial cell activity in RTT pathology.
[image:8.595.306.539.588.698.2]In Colak and colleagues study comparing the gene ex-pression between RTT and RTT-like patient’s whole blood the Interleukin-4 pathways were altered in both patient types. IL-4 is a cytokine responsible for M2 phagocytic clearance in the brain, where it helps to switch microglia to a polarised M2 expressing cells, which optimises the micro-glia to provide neuroprotective functions. These functions include releasing neurotrophic factors and clearing the is-chemic debris which can be caused by neuroinflamatory
Table 3Summary of the gene expression evidence for changes in glial cell activity identified by transcriptomic analyses in human Rett Syndrome tissues
Glial Cell Activity
Gene Expression Tissue Gene Expression Tissue
FGFR32 ↑ FC APO-E1 ↑ FC & PC
EAAT22 ↑ FC APO-J3 ↑ FC & PC
S100β2 ↑ FC EAAT11 ↑ FC & PC
C1QA4 ↓ FC & TC CRYAB1 ↑ FC & PC
C1QB4 ↓ FC &TC GFAP1 ↑ FC & PC
C1QC4 ↓ FC & TC S100A131 ↑ FC & PC
Colantuoni et al. [23]1
, Deng et al. [24]2
, Gibson et al. [25]3
, Lin et al. [26]4
, Pecorelli et al. [34]5
, Colak et al. [14]6
, Tanaka et al. [47]7
processes [83]. Considering the evidence that RTT patients have altered inflammatory responses [84, 85] the IL-4 pathway dysregulation could indicate that this impaired microglial switch in RTT patients could contribute to the pathogenic role of Microglia and neuroinflammatory pro-cesses in the disease.
The RTT-Induced Pluripotent Stem cells have been studied by Andoh-Noda and colleagues, and they found thatMECP2mutations found in RTT patients caused an increase of expression of glial markers in differentiated cell cultures suggesting a bias towards a astrocytic cell fate [71]. These results help to show the contribution of glial cell activity towards disruption of the synaptic transmission, dendritic and synaptic architecture in the brains of human RTT brains.
The role of glial cells and their contribution to the RTT phenotype certainly has changed over recent years but there are still many unanswered questions with regards to the potential therapeutic targeting of this mechanism [86]. However given the amount of evidence and indications from the transcriptomic studies as well as the current directions of the literature, it is likely that glial function will be a focus in the future of RTT re-search, also considering that several of the reported genes have been identified in both brain, whole blood and IPSCs and are linked to mechanisms of inflamma-tion which are known to be present in multiple tissues.
Influence of mutation type on mechanisms:
As well as the heterogeneity of tissue type, one interest-ing aspect that might contribute to lack of overlappinterest-ing in these transcriptomic studies is how mutation type contributes to the severity of the disorder. Various stud-ies have found a number of links between particular mu-tations and severity of disease [10,87–89]. This has been an area of great interest to clinicians and researchers, as finding relationships between molecular mechanisms of MECP2 and severity of phenotype could elucidate pos-sible therapeutic targets and/or provide genetic counsel-ling for families and carers. Since 99.5% of RTT patients have De Novo mutations [90] occurring in different portions of the MECP2 gene, the composition of RTT patients examined in each cohort will likely vary, hence influencing the differential gene expression detected throughout these studies.
The scope of individual mutations in the MECP2 is large, recently it was found that 518 different pathogenic or likely pathogenic mutations have been recorded while a further 211 mutations’significance has yet to be deter-mined out to the approximately 900 different recorded cases of MECP2 mutation [91]. Despite this wide range of variance > 65% of RTT syndrome mutations are caused by a subset of 8 common mutations; R106W, R133C, T158 M, R168C, R255X, R270X, R294X, and
R306C [92]. Interestingly, this distribution is reflected in the total cohort of patients across these transcriptomic studies, 19/29 = 65.5% (see. Table4).
Even within this subset there are differences in severity and disease progression.Cuddapah and Colleaguesused the largest cohort of RTT patients to date (1052 partici-pants) and found that mutations to R133C, R294X, R306C, exon 1, and 3′ truncations had lower severity scores while mutations R106W, R168X, R255X, R270X, splice sites, large deletions, insertions and deletions, were all found to have higher clinical severity scores; finally the common mutation T158 M was found to represent an intermediate clinical severity score [89]. It was also found that although –in general- clinical seve-rity increases overtime, this was not true for a number of mutations including R106W, R294X, exon 1 inser-tions, large deleinser-tions, splice sites, and cases without MECP2 mutations. Considering the progressive nature of RTT these exceptions are intriguing.
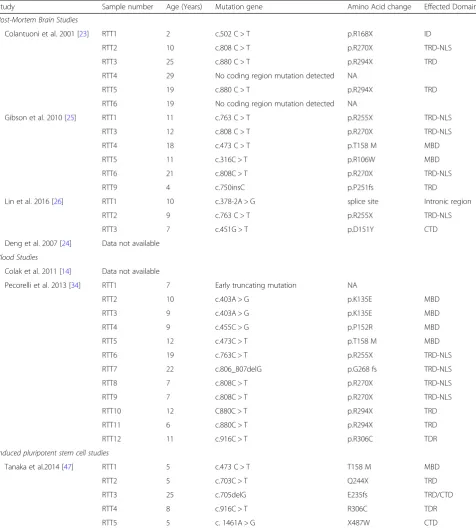
In order to better understand the influence of the differ-ent genetic mutations in each of these transcriptomic studies, we listed each mutation for each RTT patient in Table4. However we were not able to access the genotypic information for some studies [14,24]. Table4is split into each group of tissue type, i.e. Post-Mortem Brian studies, Blood Tissue studies and Induced Pluripotent Stem Cells.
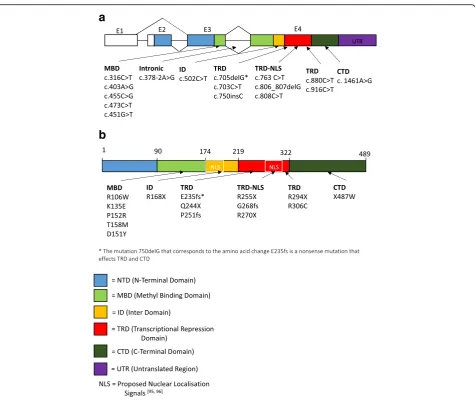
In order to visualize the distribution of the different mutations in theMECP2gene, we report the schematics of the different exons and protein domains of MECP2 gene (Fig.1a) and protein (Fig.1b). The mutations found across the studies are grouped as per protein domain and are listed out and displayed on the schematic.
proteins, KPNA3 and KPNA4 in fact KPNA3 binding to MECP2 has been shown to be retained in MeCP2-270X N2a cell lines [98].
Interestingly Fabio and Colleagues demonstrated that when RTT patients were split into mutations within
[image:10.595.60.537.110.641.2]NLS (mutations within R294, excluding R294 itself ) and mutations after NLS (mutations including R294 onwards through C terminal) they found a significant decrease in severity of Motor function and autonomy impairments indicating its importance in the overall function of the
Table 4Displaying the mutation classification of each RTT patient in the individual studies. Sample identifier number, age, genetic mutation, amino acid change and effected domain are all detailed
Study Sample number Age (Years) Mutation gene Amino Acid change Effected Domain
Post-Mortem Brain Studies
Colantuoni et al. 2001 [23] RTT1 2 c.502 C > T p.R168X ID
RTT2 10 c.808 C > T p.R270X TRD-NLS
RTT3 25 c.880 C > T p.R294X TRD
RTT4 29 No coding region mutation detected NA
RTT5 19 c.880 C > T p.R294X TRD
RTT6 19 No coding region mutation detected NA
Gibson et al. 2010 [25] RTT1 11 c.763 C > T p.R255X TRD-NLS
RTT3 12 c.808 C > T p.R270X TRD-NLS
RTT4 18 c.473 C > T p.T158 M MBD
RTT5 11 c.316C > T p.R106W MBD
RTT6 21 c.808C > T p.R270X TRD-NLS
RTT9 4 c.750insC p.P251fs TRD
Lin et al. 2016 [26] RTT1 10 c.378-2A > G splice site Intronic region
RTT2 9 c.763 C > T p.R255X TRD-NLS
RTT3 7 c.451G > T p.D151Y CTD
Deng et al. 2007 [24] Data not available
Blood Studies
Colak et al. 2011 [14] Data not available
Pecorelli et al. 2013 [34] RTT1 7 Early truncating mutation NA
RTT2 10 c.403A > G p.K135E MBD
RTT3 9 c.403A > G p.K135E MBD
RTT4 9 c.455C > G p.P152R MBD
RTT5 12 c.473C > T p.T158 M MBD
RTT6 19 c.763C > T p.R255X TRD-NLS
RTT7 22 c.806_807delG p.G268 fs TRD-NLS
RTT8 7 c.808C > T p.R270X TRD-NLS
RTT9 7 c.808C > T p.R270X TRD-NLS
RTT10 12 C880C > T p.R294X TRD
RTT11 6 c.880C > T p.R294X TRD
RTT12 11 c.916C > T p.R306C TDR
Induced pluripotent stem cell studies
Tanaka et al.2014 [47] RTT1 5 c.473 C > T T158 M MBD
RTT2 5 c.703C > T Q244X TRD
RTT3 25 c.705delG E235fs TRD/CTD
RTT4 8 c.916C > T R306C TDR
RTT5 5 c. 1461A > G X487W CTD
MECP2 activity [99]. Indeed others too have found evi-dence that mutations towards the C-terminal of MECP2 have milder phenotypes. RTT patients with R306C and C-terminal truncations were both identified as being more likely to retain ambulation and use of language [88,100].
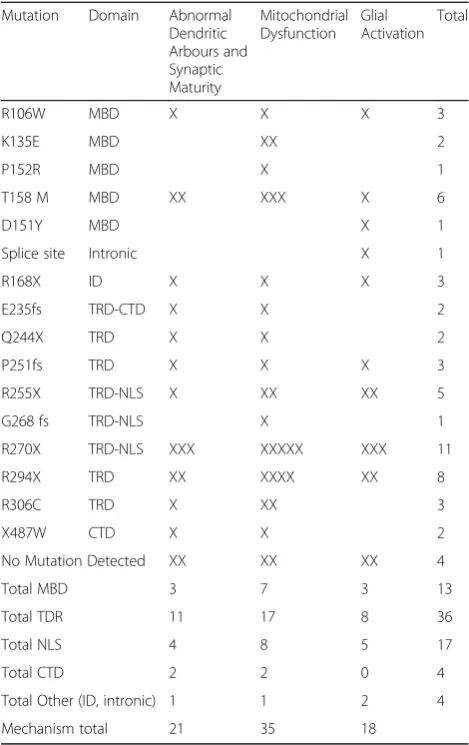
In Table 5 below we show a breakdown of individual mutations identified in studies supporting the 3 mecha-nisms previously discussed; abnormal dendritic arbours and synaptic maturation, mitochondrial dysfunction and glial cell activation. The two most common mutations were R270X and R294X with 11 and 8 cases respectively. No clear pattern was seen indicating that particular mu-tations were more likely to support a particular mechan-ism. Although mitochondrial dysfunction was somewhat higher than the others across domains, this was probably
due to Pecorelli and Colleagues having a greater study participation (n= 12) [34] compared to the other studies [14,23–26,47].
One study that took into account individual RTT mutations was the RTT-IPS cell study by Tanaka and Colleagueswho used fibroblasts to create Induced pluri-potent stem cells with mutant MECP2 expressing cell lines, which were then used for sequencing. Their results showed that a number of neurodevelopmental functions were affected, although these varied depending on the mutation. For examples the R306C mutation cell line showed that downregulated genes compared to wild type effected the axonal guidance and neuronal projection but not synaptic transmission, while for E235fs muta-tions was the opposite, with synaptic transmission effected but not axonal guidance or neuronal projection.
a
b
[image:11.595.62.538.84.485.2]And finally the C-terminal deletion X487W was only significantly effected in axonal guidance KEGG pathway. Tanaka and Colleagues conclude that even from early development individual MECP2 mutations affect differ-ent sets of genes [47]. Due to the limited number of pa-tients reported in the mentioned transcriptomic studies, we cannot run an association analysis between mutation type and molecular function, however all together these results show that the majority of mutations present are associated to alterations in genes associated to mito-chondrial function.
Conclusion
In summary, despite the limited number of transcriptomic level studies conducted in human RTT patients, there is a
small reservoir that provide interesting information for understanding some of the pathophysiology of RTT. The main conclusion that emerges from the human transcrip-tomic studies, is the convergence of mechanisms across different tissues. The dysregulated genes belong to three main categories: abnormal dendritic arborisation and syn-aptic maturation, mitochondrial dysfunction and glial cell activity. Analysis in each of these groups lead to new po-tential therapeutics: clinical trials have been designed uti-lising compounds to target both the abnormal dendritic architecture (NCT01777542 and NCT01703533) and the
mitochondrial dysfunction (NCT01822249 and
NCT02696044) in RTT and have reached phase II trials. The evidence for targeting glial cell expression is slightly more contested, however now exists a strong base of evi-dence to support the disruption to normal function of glial cells including a number of the transcriptomic studies reviewed here (including Colantuoni, Deng, Lin, Gibson, Colakandcolleagues[14,23–26]).
Although additional analysis is required to confirm the exact pathophysiological events taking place in RTT patients, transcriptomic studies represent a very good un-biased basis for detection of aberrant cellular behaviours and provide researchers with a road-map to guide specific investigations. Because of the breadth of detection and sensitivity of these studies their findings can be used to generate new hypothesis to be tested in additional sets of experiments. This snapshot of the current context of tran-scriptomic studies indicate that there are some genes and pathways which affect several functions across different preparations (synaptic, glial and mitochondrial function) and represent key components to pathophysiological state of the typical (mutant MECP2) RTT patients. Such ana-lyses can be used to uncover the biological basis of RTT and to point at new strategies for interventions.
Abbreviations
AKT1:AKT Serine/Threonine Kinase 1; AMPA1: Glutamate Ionotropic Receptor AMPA Type Subunit 1; AMPA2: Glutamate Ionotropic Receptor AMPA Type Subunit 2; APLP1: Amyloid-Like Protein 1; ATP: Adenosine Tri-Phosphate; BA: Brodmann Areas; BDNF: Brain Derived Neurotrophic Factor; C1QA: Complement C1q A Chain; C1QB: Complement C1q B Chain; C1QC: Complement C1q C Chain; C3: Complement C3; CDKl5: Cyclin Dependent Kinase Like 5; CLU/APO-J: Clusterin; CNS: Central Nervous System; COX: Cytochrome C Oxidase; CRPM1: Collapsin Response Mediator Protein 1; CRYAB: Crystallin A Beta; CTD: C-Terminal Domain; CXCR1: C-X-C Motif Chemokine Receptor 1; DGE: Differential Gene Expression; DMN1: Dynamin 1; DOC2A: Double C2 Domain Alpha; EAAT1: Solute Carrier Family 1 Member 3; EAAT2: Solute Carrier Family 1 Member 2; FC: Frontal Cortex;
FOXG1: Forkhead Box G; FXYD1: FXYD Domain Containing Ion Transport Regulator 1; GABRB3: Gamma-Aminobutyric Acid Type A Receptor Beta 3; GFAP: Glial Fibrillary Acidic Protein; HDAC: Histone Deacetylase 1; ID: Inter Domain; IL1: Interluekine-1β; IL1R1: Interleukin 1 Receptor Type 1; IL-4: Interleukin 4; IPS: Induced Pluripotent Stem Cells; KEGG: Kyoto Encyclodpedia of Genes and Genomes; KLF4: Kruppel-Like Factor 4; KO: Knock-Out; KPNA3: Karyopherin Subunit Alpha 3; KPNA4: Karyopherin Subunit Alpha 4; MAP 2: Microtubule Associated Protein 2; MBD: Methyl Binding Domain.; MECP2: Methyl-CpG binding protein 2.;
[image:12.595.56.291.142.515.2]MRPS33: Mitochondrial Ribosomal Protein S33.; MT-CO1: Cytochrome C Oxidase.; MYC: MYC Proto-Oncogene BHLH Transcription Factor.;
Table 5Displaying each RTT patient mutation used across the different studies along with the effected domain. These mutations are split into the 3 mechanisms found across the studies, abnormal dendritic arbours and synaptic maturity, mitochondrial dysfunction and glial activation
Mutation Domain Abnormal
Dendritic Arbours and Synaptic Maturity
Mitochondrial Dysfunction
Glial Activation
Total
R106W MBD X X X 3
K135E MBD XX 2
P152R MBD X 1
T158 M MBD XX XXX X 6
D151Y MBD X 1
Splice site Intronic X 1
R168X ID X X X 3
E235fs TRD-CTD X X 2
Q244X TRD X X 2
P251fs TRD X X X 3
R255X TRD-NLS X XX XX 5
G268 fs TRD-NLS X 1
R270X TRD-NLS XXX XXXXX XXX 11
R294X TRD XX XXXX XX 8
R306C TRD X XX 3
X487W CTD X X 2
No Mutation Detected XX XX XX 4
Total MBD 3 7 3 13
Total TDR 11 17 8 36
Total NLS 4 8 5 17
Total CTD 2 2 0 4
Total Other (ID, intronic) 1 1 2 4
Mechanism total 21 35 18
NFAT: Nuclear Factor Activated T-Cells.; NFATC3: Nuclear Factor of Activated T Cells 3.; NFκB: Nuclear Factor Kappa B Subunit 1.; NLS: Nuclear Localisation Signal.; NOTCH1: Notch Homolog 1 Translocation Associated.; NQO1: NADPH Quinone Oxidoreductase 1.; NR3C1: Nuclear Receptor subfamily 3 Group C member 1.; OCT4: Octamer binding Transcription Factor 4.; PBMC: Peripheral Blood Lymphomonocytes.; PKO: PeripheralMecp2Knockout.; PMB: Post-Mortem Brain.; ROS: Reactive Oxygen Species.; RTT: Rett Syndrome.; S100A13: S100 Calcium Binding Protein A13.; S100β: S100 Calcium Binding Protein B.; SFG: Superior Frontal Gyrus.; SNAP25: Synaptosome Associated Protein 25.; SOX2: Sex Determining Region Y.; TGFBR2: Transforming Growth Factor Beta Receptor 2.; TGFβ: Transfroming Growth Factor Beta 1.; TRD: Transcriptional Repressor Domain.; TYROBP: TRYO Protein Tyrosine Kinase Binding Protein.; UPS: Ubiquitin Proteasome System.;
UQCRC1: Cytochrome b-c 1 complex subunit 1.; Uqcrc1: Ubiquinol-cytochrome c reductase core protein 1.; XCI: X-Chromosome Inactivation.
Acknowledgements
We Thank Meath Foundation Ireland for support.
Funding
SS salary was partially supported by Meath Foundation research grant 2015 to L. Gallagher and D. Tropea.
Authors’contributions
Both authors contributed to the structure and content of the review. Both authors read and approved the final manuscript.
Ethics approval and consent to participate Not Applicable.
Consent for publication Not Applicable.
Competing interests
The authors declare that they have no competing interests.
Publisher’s Note
Springer Nature remains neutral with regard to jurisdictional claims in published maps and institutional affiliations.
Received: 1 February 2018 Accepted: 27 June 2018
References
1. Neul JL, Kaufmann WE, Glaze DG, Clarke AJ, Leonard H, Bailey MES, et al. Rett syndrome: revised diagnostic criteria and Nomenlcature. Ann Neurol. 2010;68:944–50.https://doi.org/10.1002/ana.22124.Rett.
2. Archer HL, Evans J, Edwards S, Colley J, Newbury-Ecob R, O’Callaghan F, et al. CDKL5 mutations cause infantile spasms, early onset seizures, and severe mental retardation in female patients. J Med Genet 2006;43:729–734. doi: jmg.2006.041467.
3. Renieri A, Mari F, Mencarelli MA, Scala E, Ariani F, Longo I, et al. Diagnostic criteria for the Zappella variant of Rett syndrome (the preserved speech variant). Brain and Development. 2009;31:208–16.https://doi.org/10.1016/j. braindev.2008.04.007.
4. Takagi M, Sasaki G, Mitsui T, Honda M, Tanaka Y, Hasegawa T. A 2.0Mb microdeletion in proximal chromosome 14q12, involving regulatory elements of FOXG1, with the coding region of FOXG1 being unaffected, results in severe developmental delay, microcephaly, and hypoplasia of the corpus callosum. Eur J Med Genet. 2013;56:526–8.https://doi.org/10.1016/j. ejmg.2013.05.012.
5. Hagberg B, Rasmussen P.“FORME FRUSTE”of RETT syndrome - a CASE report. Am J Med Genet. 1986;181:175–81.
6. Pini G, Bigoni S, Congiu L, Romanelli a M, Scusa MF, Di Marco P, et al. Rett syndrome: a wide clinical and autonomic picture. Orphanet J Rare Dis. 2016; 11:132.https://doi.org/10.1186/s13023-016-0499-7.
7. Jan MMS, Dooley JM, Gordon KE. Male Rett syndrome variant: application of diagnostic criteria. Pediatr Neurol. 1999;20:238–40.
8. Hagberg B. Clinical manifestations and stages of Rett syndrome. Ment Retard Dev Disabil Res Rev. 2002;8:61–5.
9. Krishnaraj R, Ho G, Christodoulou J. RettBASE: Rett syndrome database update. Hum Mutat. 2017; July 2016:1–10.https://doi.org/10.1002/humu.23263. 10. Percy AK, Lane JB, Childers J, Skinner S, Annese F, Barrish J, et al. Rett
syndrome: north American database. J Child Neurol. 2007;22:1338–41. https://doi.org/10.1177/0883073807308715.
11. Suter B, Treadwell-Deering D, Zoghbi HY, Glaze DG, Neul JL. Brief report: MECP2 mutations in people without rett syndrome. J Autism Dev Disord. 2014;44:703–11.
12. Fehr S, Wilson M, Downs J, Williams S, Murgia A, Sartori S, et al. The CDKL5 disorder is an independent clinical entity associated with early-onset encephalopathy. Eur J Hum Genet. 2013;21:266–73.https://doi. org/10.1038/ejhg.2012.156.
13. Mangatt M, Wong K, Anderson B, Epstein A, Hodgetts S, Leonard H, et al. Prevalence and onset of comorbidities in the CDKL5 disorder differ from Rett syndrome. Orphanet J Rare Dis. 2016;11:1–16.https://doi.org/10.1186/ s13023-016-0418-y.
14. Colak D, Al-Dhalaan H, Nester M, AlBakheet AB, Al-Younes B, Al-Hassnan Z, et al. Genomic and transcriptomic analyses distinguish classic Rett and Rett-like syndrome and reveals shared altered pathways. Genomics. 2011;97:19– 28.https://doi.org/10.1016/j.ygeno.2010.09.004.
15. Shahbazian MD, Antalffy B, Armstrong DL, Zoghbi HY. Insight into Rett syndrome: MeCP2 levels display tissue-and cell-specific differences and correlate with neuronal maturation. Hum Mol Genet. 2002;11:115–24. 16. Olson CO, Zachariah RM, Ezeonwuka CD, Liyanage VRB, Rastegar M. Brain
region-specific expression of MeCP2 isoforms correlates with DNA methylation within Mecp2 regulatory elements. PLoS One. 2014;9 17. Sugino K, Hempel CM, Okaty BW, Arnson HA, Kato S, Dani VS, et al.
Cell-type-specific repression by methyl-CpG-binding protein 2 is biased toward long genes. J Neurosci. 2014;34:12877–83.https://doi.org/10.1523/ JNEUROSCI.2674-14.2014.
18. Ross PD, Guy J, Selfridge J, Kamal B, Bahey N, Tanner E, et al. Exclusive expression of MeCP2 in the nervous system distinguishes between brain and peripheral Rett syndrome-like phenotypes. HMG Advance Access Hum Mol Genet. 2016;0:1–16.https://doi.org/10.1093/hmg/ddw269.
19. Zhao S, Fung-Leung WP, Bittner A, Ngo K, Liu X. Comparison of RNA-Seq and microarray in transcriptome profiling of activated T cells. PLoS One. 2014;9
20. Xu J, Fang H, Hong H, Shen J, Su Z. A comprehensive study design reveals treatment- and transcript abundance-deprendent concordance between RNA-seq and microarray data 2014;32:926–32.
21. Piper MDW, Daran-Lapujade P, Bro C, Regenberg B, Knudsen S, Nielsen J, et al. Reproducibility of oligonucleotide microarray transcriptome analyses. An interlaboratory comparison using chemostat cultures of Saccharomyces cerevisiae. J Biol Chem. 2002;277:37001–8.
22. Costa V, Aprile M, Esposito R, Ciccodicola A. RNA-Seq and human complex diseases: recent accomplishments and future perspectives. Eur J Hum Genet. 2012;21:134–42.https://doi.org/10.1038/ejhg.2012.129.
23. Colantuoni C, Jeon OH, Hyder K, Chenchik A, Khimani AH, Narayanan V, et al. Gene expression profiling in postmortem Rett Syndromerain: differential gene expression and patient classification. Neurobiol Dis. 2001;8:847–65. https://doi.org/10.1006/nbdi.2001.0428.
24. Deng V, Matagne V, Banine F, Frerking M, Ohliger P, Budden S, et al. FXYD1 is an MeCP2 target gene overexpressed in the brains of Rett syndrome patients and Mecp2-null mice. Hum Mol Genet. 2007;16:640–50. 25. Gibson JH, Slobedman B, K N H, Williamson SL, Minchenko D, El-Osta a, et
al. downstream targets of methyl CpG binding protein 2 and their abnormal expression in the frontal cortex of the human Rett syndrome brain. BMC Neurosci. 2010;11:53.
26. Lin P, Nicholls L, Assareh H, Fang Z, Amos TG, Edwards RJ, et al. Transcriptome analysis of human brain tissue identifies reduced expression of complement complex C1Q genes in Rett syndrome. BMC Genomics. 2016:1–11.https://doi.org/10.1186/s12864-016-2746-7.
27. Matagne V, Budden S, Ojeda SR, Raber J. Correcting deregulated Fxyd1 expression ameliorates a behavioral impairment in a mouse model of Rett syndrome. Brain Res. 2013;1496:104–14.https://doi.org/10.1016/j.brainres. 2012.12.009.
28. Carter JC, Lanham DC, Pham D, Bibat G, Naidu S, Kaufmann WE. Selective cerebral volume reduction in Rett syndrome: a multiple-approach MR imaging study. Am J Neuroradiol. 2008;29:436–41.
30. Nuutinen T, Suuronen T, Kyrylenko S, Huuskonen J, Salminen A. Induction of clusterin/apoJ expression by histone deacetylase inhibitors in neural cells. Neurochem Int. 2005;47:528–38.
31. Jones PL, Veenstra GJ, Wade PA, Vermaak D, Kass SU, Landsberger N, et al. Methylated DNA and MeCP2 recruit histone deacetylase to repress transcription. Nat Genet 1998;19 june:187–191. doi:https://doi.org/10.1038/561. 32. LeBlanc JJ, DeGregorio G, Centofante E, Vogel-Farley VK, Barnes K, Kaufmann
WE, et al. Visual evoked potentials detect cortical processing deficits in Rett syndrome. Ann Neurol. 2015;78:775–86.
33. Ben-Shachar S, Chahrour M, Thaller C, Shaw CA, Zoghbi HY. Mouse models of MeCP2 disorders share gene expression changes in the cerebellum and hypothalamus. Hum Mol Genet. 2009;18:2431–42.
34. Pecorelli A, Leoni G, Cervellati F, Canali R, Signorini C, Leoncini S, et al. Genes related to mitochondrial functions, protein degradation, and chromatin folding are differentially expressed in lymphomonocytes of rett syndrome patients. Mediat Inflamm. 2013;2013
35. De Felice C, Della Ragione F, Signorini C, Leoncini S, Pecorelli A, Ciccoli L, et al. Oxidative brain damage in Mecp2-mutant murine models of Rett syndrome. Neurobiol Dis. 2014;68:66–77.https://doi.org/10.1016/j.nbd.2014.04.006. 36. Pecorelli A, Ciccoli L, Signorini C, Leoncini S, Giardini A, D’Esposito M, et al.
Increased levels of 4HNE-protein plasma adducts in Rett syndrome. Clin Biochem. 2011;44:368–71.https://doi.org/10.1016/j.clinbiochem.2011.01.007. 37. Amm I, Sommer T, Wolf DH. Protein quality control and elimination of protein waste: the role of the ubiquitinproteasome system. Biochim Biophys Acta -Mol Cell Res. 2014;1843:182–96.https://doi.org/10.1016/j.bbamcr.2013.06.031. 38. Meffert MK, Chang JM, Wiltgen BJ, Fanselow MS, Baltimore D. NF-κB
functions in synaptic signaling and behavior. Nat Neurosci. 2003;6:1072–8. https://doi.org/10.1038/nn1110.
39. Park I-H, Lerou PH, Zhao R, Huo H, Daley GQ. Generation of human-induced pluripotent stem cells. Nat Protoc. 2008;3:1180–6.https://doi.org/10.1038/ nprot.2008.92.
40. Marchetto MCNM, Carromeu C, Acab A, Yu D, Yeo GW, Mu Y, et al. A model for neural development and treatment of Rett syndrome using human induced pluripotent stem cells. Cell. 2010;143:527–39.https://doi.org/10. 1016/j.cell.2010.10.016.A.
41. Kim K, Jaenisch R, Feinberg AP, Weissleder R, Kim J, Murakami P, et al. Epigenetic memory in induced pluripotent stem cells. Nature. 2010;467:285– 90.https://doi.org/10.1038/nature09342.
42. Cheung AYL, Horvath LM, Grafodatskaya D, Pasceri P, Weksberg R, Hotta A, et al. Isolation of MECP2-null Rett syndrome patient hiPS cells and isogenic controls through X-chromosome inactivation. Hum Mol Genet. 2011;20:2103–15. 43. Pomp O, Dreesen O, Leong DFM, Meller-Pomp O, Tan TT, Zhou F, et al.
Unexpected X chromosome skewing during culture and reprogramming of human somatic cells can be alleviated by exogenous telomerase. Cell Stem Cell. 2011;9:156–65.https://doi.org/10.1016/j.stem.2011.06.004.
44. Ananiev G, Williams EC, Li H, Chang Q. Isogenic pairs of wild type and mutant induced pluripotent stem cell (iPSC) lines from rett syndrome patients as in vitro disease model. PLoS One. 2011;6
45. Cheung AYL, Horvath LM, Carrel L, Ellis J. X-chromosome inactivation in Rett syndrome human induced pluripotent stem cells. Front Psychiatry 2012;3 MAR:1–16. 46. Polo JJM, Liu S, Figueroa MME, Kulalert W, Eminli S, Tan KY, et al. Cell type
of origin influences the molecular and functional properties of mouse induced pluripotent stem cells. Nat Biotechnol. 2010;28:848–55. 47. Tanaka Y, Kim KY, Zhong M, Pan X, Weissman SM, Park IH. Transcriptional
regulation in pluripotent stem cells by methyl CpG-binding protein 2 (MeCP2). Hum Mol Genet. 2014;23:1045–55.
48. Papadimitriou JM, Hockey A, Tan N, Masters CL. Rett Syndrome : Abnormal Membrane-Bound Lamellated Inclusions in Neurons and Oligodendroglia. 1988;368.
49. Jellinger K, Seitelberger F. Neuropathology of Rett syndrome. Am J Med Genet. 1986;24:259–88.
50. Kishi N, Macklis JD. MECP2 is progressively expressed in post-migratory neurons and is involved in neuronal maturation rather than cell fate decisions. Mol Cell Neurosci. 2004;27:306–21.
51. Belichenko PV, Wright EE, Belichenko NP, Masliah E, Li HH, Mobley WC, et al. Widespread changes in dendritic and axonal morphology in Mecp2-mutant mouse models of Rett syndrome: evidence for disruption of neuronal networks. J Comp Neurol. 2009;514:240–58.
52. Armstrong DD, Dunn K, Antalffy B. Decreased dendritic branching in frontal motor limbic cortex in Rett syndrome compared with trisomy 21. J Neuropathol Exp Neurol. 1998;57:1013–7.
53. Armstrong DD. Neuropathology of Rett syndrome. J Child Neurol. 2005;20: 747–53.https://doi.org/10.1177/08830738050200090901%0A.
54. Xu X, Miller EC, Pozzo-Miller L. Dendritic spine dysgenesis in Rett syndrome. Front Neuroanat 2014;8 September:97. doi:https://doi.org/10.3389/fnana. 2014.00097.
55. Kaufmann WE, Johnston MV, Blue ME. MeCP2 expression and function during brain development: implications for Rett syndrome’s pathogenesis and clinical evolution. Brain and Development. 2005;27(SUPPL. 1):77–87. 56. Kishi N, MacDonald JL, Ye J, Molyneaux BJ, Azim E, Macklis JD. Reduction of
aberrant NF-κB signalling ameliorates Rett syndrome phenotypes in Mecp2-null mice. Nat Commun. 2016;7:10520.https://doi.org/10.1038/ncomms10520. 57. Sarnat HB. Clinical neuropathology practice guide 5-2013: markers of
neuronal maturation. Clin Neuropathol. 2013;32:340–69.https://doi.org/10. 5414/NP300638.
58. He L, Liu N, Cheng T, Chen X, Li Y, Shu Y, et al. Conditional deletion of Mecp2 in parvalbumin-expressing GABAergic cells results in the absence of critical period plasticity. Nat Commun. 2014;5:5036.https://doi.org/10.1038/ ncomms6036.
59. Nguyen MVC, Du F, Felice CA, Shan X, Nigam A, Mandel G, et al. MeCP2 is critical for maintainng mature neuronal networks and global brain anatomy during late stages of postnatal brain development and in the mature adult brain. J Neurosci. 2013;32:10021–34.
60. Eeg-Olofsson O, Al-Zuhair AGH, Teebi AS, Al-Essa MMN, Opitz JM, Reynolds JF. Rett syndrome: genetic clues based on mitochondrial changes in muscle. Am J Med Genet. 1989;32:142–4.https://doi.org/10.1002/ajmg. 1320320131.
61. Cornford ME, Philippart M, Jacobs B, Scheibel AB, Vinters HV. Neuropathology of Rett syndrome: case report with neuronal and mitochondrial abnormalities in the brain. J Child Neurol. 1994;9:424–31. https://doi.org/10.1177/088307389400900419.
62. Coker SB, Melnyk AR. Rett syndorme and mitochondrial enzyme deficiencies. J Child Neurol. 1991;6:164–6.
63. E a S, Manfredi G. Neuronal degeneration and mitochondrial dysfunction. J Clin Invest. 2003;111:303–12.
64. L a E, Melov S, Panov a, Cottrell B a, Wallace DC. Mitochondrial disease in mouse results in increased oxidative stress. Proc Natl Acad Sci U S A. 1999; 96:4820–5.
65. Schulz JB, Lindenau J, Seyfried J, Dichgans J. Oxidative stress and neurodegeneration. Eur J Biochem. 2000;267:4904–11.
66. Kriaucionis S, Paterson A, Curtis J, Guy J, MacLeod N, Bird A. Gene expression analysis exposes mitochondrial abnormalities in a mouse model of Rett syndrome. Mol Cell Biol. 2006;26:5033–42.https://doi.org/10.1128/ MCB.01665-05.
67. Sticozzi C, Belmonte G, Pecorelli A, Cervellati F, Leoncini S, Signorini C, et al. Scavenger receptor B1 post-translational modifications in Rett syndrome. FEBS Lett. 2013;587:2199–204.https://doi.org/10.1016/j.febslet.2013.05.042. 68. De Felice C, Ciccoli L, Leoncini S, Signorini C, Rossi M, Vannuccini L, et al.
Systemic oxidative stress in classic Rett syndrome. Free Radic Biol Med. 2009;47:440–8.https://doi.org/10.1016/j.freeradbiomed.2009.05.016. 69. Li Y, Wang H, Muffat J, Cheng AW, Orlando DA, Lovén J, et al. Global
transcriptional and translational repression in human-embryonic- stem-cell-derived rett syndrome neurons. Cell Stem Cell. 2013;13:446–58.
70. Janc OA, Hüser MA, Dietrich K, Kempkes B, Menzfeld C, Hülsmann S, et al. Systemic radical scavenger treatment of a mouse model of Rett syndrome: merits and limitations of the vitamin E derivative Trolox. Front Cell Neurosci 2016;10 November:1–20. doi:https://doi.org/10.3389/fncel.2016.00266. 71. Andoh-Noda T, Akamatsu W, Miyake K, Matsumoto T, Yamaguchi R,
Sanosaka T, et al. Differentiation of multipotent neural stem cells derived from Rett syndrome patients is biased toward the astrocytic lineage. Mol Brain. 2015;8:31.https://doi.org/10.1186/s13041-015-0121-2.
72. Großer E, Hirt U, Janc OA, Menzfeld C, Fischer M, Kempkes B, et al. Oxidative burden and mitochondrial dysfunction in a mouse model of Rett syndrome. Neurobiol Dis. 2012;48:102–14.https://doi.org/10.1016/j.nbd.2012.06.007. 73. Derecki NC, Cronk JC, Lu Z, Xu E, Abbott SBG, Guyenet PG, et al. Wild type
microglia arrest pathology in a mouse model of Rett syndrome. Nature. 2012;484:105–9.
74. Lioy DT, Garg SK, Monaghan CE, Raber J, Foust KD, Kaspar BK, et al. A role for glia in the progression of Rett’s syndrome. Nature. 2011;475:497–500. https://doi.org/10.1038/nature10214.
76. Maezawa. Rett syndrome astrocytes are abnormal and spread MeCP2 deficiency through gap junctions. J Neurosci. 2009;29:5051–61.
77. Ballas N, Lioy DT, Grunseich C, Mandel G. Non–cell autonomous influence of MeCP2-deficient glia on neuronal dendritic morphology. Nat Neurosci. 2009; 12:311–7.https://doi.org/10.1038/nn.2275.
78. Maezawa I, Jin LW. Rett syndrome microglia damage dendrites and synapses by the elevated release of glutamate. J Neurosci. 2010;30:5346–56. https://doi.org/10.1523/JNEUROSCI.5966-09.2010.
79. Okabe Y, Takahashi T, Mitsumasu C, Ichiro KK, Tanaka E, Matsuishi T. Alterations of gene expression and glutamate clearance in astrocytes derived from an mecp2-null mouse model of rett syndrome. PLoS One. 2012;7
80. Maragakis NJ, Dietrich J, Wong V, Xue H, Mayer-Proschel M, Rao MS, et al. Glutamate transporter expression and function in human glial progenitors. Glia. 2004;45:133–43.
81. Das SK, Dash R, Dasgupta S, Barral PM, Hedvat M, Diaz P, et al. Role of excitatory amino acid transporter-2 (EAAT2) and Glutamate in
neurodegeneration: Opportunities for developing novel Theraputics. 2012; 226:2484–2493.
82. Xie Z, Harris-White ME, Wals PA, Frautschy SA, Finch CE, Morgan TE. Apolipoprotein J (clusterin) activates rodent microglia in vivo and in vitro. J Neurochem. 2005;93:1038–46.
83. Zhao X, Wang H, Sun G, Zhang J, Edwards NJ, Aronowski XJ. Neuronal Interleukin-4 as a Modulator of Microglial Pathways and Ischemic Brain Damage. J Neurosci. 2015;35:11281–91.
84. Pecorelli A, Cervellati F, Belmonte G, Montagner G, Waldon P, Hayek J, et al. Cytokines profile and peripheral blood mononuclear cells morphology in Rett and autistic patients. Cytokine. 2016;77:180–8.https://doi.org/10.1016/j. cyto.2015.10.002.
85. Leoncini S, De Felice C, Signorini C, Zollo G, Cortelazzo A, Durand T, et al. Cytokine Dysregulation in MECP2- and CDKL5-related Rett syndrome: relationships with aberrant redox homeostasis, inflammation, and ??-3 PUFAs. Oxidative Med Cell Longev. 2015;2015
86. Derecki NC, Cronk JC, Kipnis J. The role of microglia in brain maintenance: implications for Rett syndrome. Trends Immunol. 2013;34:144–50. 87. Colvin L, Leonard H, de Klerk N, Davis M, Weaving L, Williamson S, et al.
Refining the phenotype of common mutations in Rett syndrome. J Med Genet. 2004;41:25–30.
88. Neul JL, Fang P, Barrish J, Lane J, Caeg EB, Smith EO, et al. Specific mutations in methyl-CpG-binding protein 2 confer different severity in Rett syndrome. Neurology. 2008;70:1313–21.
89. Cuddapah VA, Pillai RB, Shekar KV, Lane JB, Kathleen J, Skinner SA, et al. Methyl-CpG-bnding protein 2 (MECP2) mutation type is associated with disease severity in Rett Syndrome. J Med Genet. 2014;51:152–8.https:// doi.org/10.1136/jmedgenet-2013-102113.Methyl-CpG-binding.
90. Trappe R, Laccone F, Cobilanschi J, Meins M, Huppke P, Hanefeld F, et al. MECP2 mutations in sporadic cases of Rett syndrome are almost exclusively of paternal origin. Am J Hum Genet. 2001;68:1093–101.
91. Gold WA, Krishnaraj R, Ellaway C, Christodoulou J. Rett syndrome: a genetic update and clinical review focusing on comorbidities. ACS Chem Neurosci 2017;:acschemneuro.7b00346. doi:https://doi.org/10.1021/acschemneuro. 7b00346.
92. Dragich J, Houwink-Manville I, Schanen C. Rett syndrome: a surprising result of mutation in MECP2. Hum Mol Genet Rev. 2000;9:2365–75.
93. Nan X, Meehan RR, Bird A. Dissection of the methyl-CpG binding domain from the chromosomal protein MeCP2. Nucleic Acids Res. 1993;21:4886–92.
94. Nan X, Campoy FJ, Bird A. MeCP2 is a transcriptional repressor with abundant binding sites in genomic chromatin. Cell. 1997;88:471–81. 95. Nan X, Tate P, Li E, Bird A. DNA methylation specifies chromosomal
localization of MeCP2. Mol Cell Biol. 1996;16:414–21.https://doi.org/10.1128/ MCB.16.1.414.
96. Kudo S. Methyl-CpG-binding protein MeCP2 represses Sp1-activated transcription of the human leukosialin gene when the promoter is methylated. Mol Cell Biol. 1998;18:5492–9.
97. Kifayathullah LA, Arunachalam JP, Bodda C, Agbemenyah HY, Laccone FA, Mannan AU. MeCP2 mutant protein is expressed in astrocytes as well as in neurons and localizes in the nucleus. Cytogenet Genome Res. 2010;129: 290–7.
98. Baker SA, Lombardi LM, Zoghbi HY. Karyopherinα3 and karyopherinα4 proteins mediate the nuclear import of methyl-CpG binding protein 2. J Biol Chem. 2015;290:22485–93.
99. Fabio RA, Colombo B, Russo S, Cogliati F, Masciadri M, Foglia S, et al. Recent insights into genotype-phenotype relationships in patients with Rett syndrome using a fine grain scale. Res Dev Disabil. 2014;35:2976–86.https:// doi.org/10.1016/j.ridd.2014.07.031.