www.impactjournals.com/oncotarget/ Oncotarget, Vol. 6, No. 15
Prognostic value of MET protein overexpression and gene
amplification in locoregionally advanced nasopharyngeal carcinoma
Yingqin Li1,*, Wenfei Li1,*, Qingmei He1, Yafei Xu1, Xianyue Ren1, Xinran Tang1, Xin Wen1, Xiaojing Yang1, Ying Sun1, Jing Zeng2, Jingping Yun2, Na Liu1, Jun Ma1 1 Sun Yat-sen University Cancer Center; State Key Laboratory of Oncology in South China, Collaborative Innovation Centerof Cancer Medicine, Guangzhou, China
2 Department of Pathology, State Key Laboratory of Oncology in South China, Sun Yat-sen University Cancer Center,
Guangzhou, China
*These authors contributed equally to this work
Correspondence to:
Na Liu, e-mail: liun1@sysucc.org.cn Jun Ma, e-mail: majun2@mail.sysu.edu.cn
Keywords: MET overexpression, MET amplification, prognosis, locoregionally advanced nasopharyngeal carcinoma Received: February 27, 2015 Accepted: April 08, 2015 Published: April 20, 2015
ABSTRACT
This study assessed the incidence and prognostic value of MET protein overexpression and gene amplification in locoregionally advanced nasopharyngeal carcinoma (NPC). Specimens from 376 consecutive patients with locoregionally advanced NPC were subjected to immunohistochemistry to analyze MET protein expression and fluorescence in situ hybridization to assess MET amplification status. In total, 139/376 (37.0%) patients had MET protein overexpression; of whom, 7/139 (5.0%) had MET amplification. MET overexpression was significantly associated with locoregional failure (P = 0.009), distant metastasis (P = 0.006) and death (P < 0.001); MET amplification was significantly associated with death (P = 0.021). A positive correlation was observed between MET copy number status and MET protein expression (r = 0.629, P < 0.001). Multivariate analysis demonstrated MET overexpression was an independent prognostic factor for overall survival (OS; HR, 1.99; 95% CI, 1.38–2.87; P < 0.001) and disease-free survival (DFS; HR, 1.85; 95% CI, 1.33–2.57; P < 0.001), and MET amplification was independently associated with poorer OS (HR, 4.24; 95% CI, 1.78-10.08;
P < 0.001) and DFS (HR, 5.44; 95% CI, 2.44-12.09; P < 0.001). In conclusion, MET protein overexpression and gene amplification are independent prognostic factors for OS and DFS in locoregionally advanced nasopharyngeal carcinoma, and may provide therapeutic biomarkers to identify patients in whom MET inhibitors may be beneficial.
INTRODUCTION
Nasopharyngeal carcinoma (NPC) is one of the most common head and neck malignancies in Southern China, where the rates vary from 30 to 80 cases per 100,000 [1, 2]. Unfortunately, about 80% of patients with NPC are
diagnosed with advanced disease at their first visit, due to the deep anatomical position and non-specific symptoms
of this tumor type [3]. Intensity-modulated radiotherapy combined with platinum-based chemoradiotherapy is the standard treatment for locoregionally advanced NPC [4, 5]. Although local and regional control rates
have improved, more than 30% of patients still develop recurrence and distant metastasis [6, 7]. These challenges urgently require the development of novel therapeutic strategies to improve the clinical outcome of patients with locoregionally advanced NPC. Recently, a new generation of molecular targeted drugs has been added to traditional chemotherapy and demonstrated therapeutic
efficacy [8, 9]. Therefore, identification of novel molecular aberrations in specific subgroups of patients
The MET proto-oncogene encodes the receptor tyrosine kinase MET, which is activated by its ligand, hepatocyte growth factor (HGF) [10, 11]. Binding of HGF to MET results in phosphorylation of the receptor tyrosine kinase domain, and in turn mediates downstream signaling via the PI3K/AKT, STAT3, RAS-RAC/RHO and MAPK pathways [12, 13]. Normal MET signaling is required for embryogenesis, cell growth, cell differentiation and angiogenesis [14, 15]. Constitutive activation of the MET pathway has been reported in various types of cancer, and promotes tumor cell proliferation, motility, invasion and metastasis [16, 17]. Aberrant MET activation can occur via
multiple mechanisms, including gene amplification and
mutation, dysregulation of microRNAs that target MET,
paracrine or autocrine activation via HGF, and protein
overexpression [18, 19]. Recent studies demonstrated
MET overexpression and MET amplification were
associated with poorer clinical outcomes in non-small cell lung cancer and gastric cancer [20–22]. On this basis, MET has emerged as a potential target for anticancer therapy.
Currently, a number of MET inhibitors have been developed and are in clinical trials at different phases [23–26]. The preliminary results of these trials have
demonstrated MET inhibitors have variable benefits in
unselected patient cohorts, which suggests the need for a selective biomarker to indicate subgroups of patients that
may potentially obtain more benefit from MET inhibitors.
Preclinical studies indicated MET amplification can be
used to identify subgroups of patients with gastric cancer who are sensitive to MET inhibitors [27]. However, the frequency and prognostic value of MET overexpression in NPC remains controversial due to the use of varied detection methods, cutoff criteria and populations in
different studies [28–30]. More importantly, the frequency of MET amplification in NPC has not yet been determined.
Therefore, in this study, we aimed to evaluate the frequency of MET protein overexpression in patients with locoregionally advanced NPC, and the incidence of MET
amplification in patients overexpressing MET. In addition,
we analyzed the association with clinicopathological features, as well as the prognostic value of MET overexpression and MET amplification to assess the value
of MET as a potential therapeutic target for personalized treatment of patients with NPC.
RESULTS
MET protein expression in NPC
MET protein expression was evaluated in 376 patients with locoregionally advanced nasopharyngeal carcinoma.
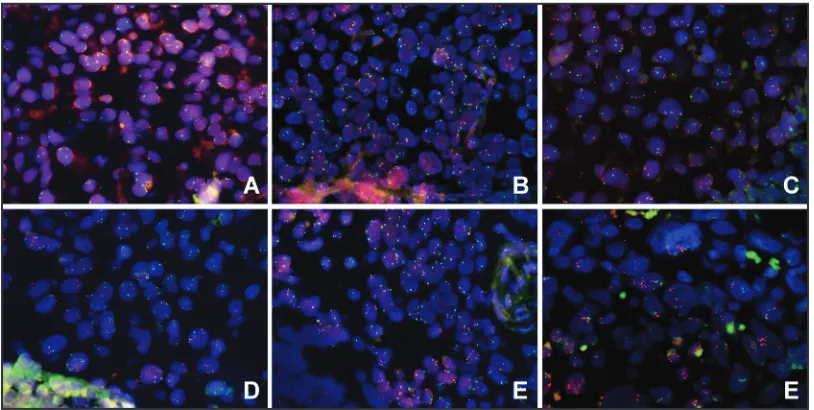
Overall, the tumors of 74 (19.7%), 163 (43.3%), 104 (27.7%) and 35 (9.3%) patients had a MET immunohistochemical
(IHC) staining score of 0, 1+, 2+ and 3+, respectively (Figure 1A–1D). Overexpression of MET was observed in 37.0%
(139/376) of the NPC tissues. The groups of patients with
high MET expression and low MET expression had similar distributions of host and tumor factors. In addition, there was
no significant difference with regards to the radiotherapy (RT)
technique or use of chemotherapy between groups. However, a lower frequency of WHO type IIb NPC was observed in patients with high MET expression compared to patients with
low MET expression (90.6% vs. 97.5%, P = 0.004; Table 1). Moreover, patients with high MET expression had a higher incidence of locoregional failure (25.2% vs. 14.3%,
[image:2.612.171.442.465.691.2]P = 0.009), distant metastasis (28.8% vs. 16.9%, P = 0.006) and death (41.7% vs. 23.6%, P < 0.001; Table 1).
Table 1: Association of MET protein expression and
MET
amplification status with the clinical
characteristics of patients with locoregionally advanced nasopharyngeal carcinoma
Characteristic METexpression (n = 376) MET amplification (n = 139) Low n (%),
(n = 237) High (n = 139)n (%), P Negative (n = 132)n (%), Positive (n = 7)n (%), P Age
≤ 45 years 120 (50.6) 67 (48.2) 0.694 64 (48.5) 3 (42.9) 1.000 > 45 years 117 (49.4) 72 (51.8) 68 (51.5) 4 (51.1)
Gender
Male 175 (73.8) 107 (77.0) 0.497 100 (75.8) 7(100.0) 0.352 Female 62 (26.2) 32 (23.0) 32 (24.2) 0 (0.0)
WHO Type
IIa 6 (2.5) 13 (9.4) 0.004 13 (9.8) 0 (0) 1.000
IIb 231 (97.5) 126 (90.6) 119 (90.2) 7 (100) VCA–IgA
< 1:80 33 (13.9) 19 (13.7) 0.945 18 (13.6) 1 (14.3) 0.107
≥ 1:80 204 (86.1) 120 (86.3) 114 (86.4) 6 (85.7) EA-IgA
< 1:10 50 (21.1) 26 (18.7) 0.577 26 (19.7) 0 (0) 0.348
≥ 1:10 187 (78.9) 113 (81.3) 106 (80.3) 7 (100) T Stage
T1–T2 40 (16.9) 19 (13.7) 0.409 19 (14.4) 0 (0) 0.593
T3–T4 197 (83.1) 120 (86.3) 113 (85.6) 7 (100) N Stage
N0–N1 125 (52.7) 84 (60.4) 0.147 80 (60.6) 4 (57.1) 1.000 N2–N3 112 (47.3) 55 (39.6) 52 (39.4) 3 (42.9)
TNM Stage
III 134 (56.5) 79 (56.8) 0.956 75 (56.8) 4 (57.1) 1.000
IV 103 (43.5) 60 (43.2) 57 (43.2) 3 (42.9)
Chemoradiotherapy
Yes 197 (83.1) 114 (82.0) 0.784 107 (81.1) 7 (100) 0.351 No 40 (16.9) 25 (18.0) 25 (18.9) 0 (0)
Radiotherapy
IMRT 29 (12.2) 10 (7.2) 0.122 10 (7.6) 0 (0) 1.000 2D–RT 208 (87.8) 129 (92.8) 122 (92.4) 7 (100)
Locoregional failure
Yes 34 (14.3) 35 (25.2) 0.009 33 (25.0) 2 (28.6) 1.000 No 203 (83.1) 104 (74.8) 99 (75.0) 5 (71.4)
MET copy number status in patients with high
MET expression
The MET copy number status of the patients with high MET expression (n = 139) was analyzed using fluorescent in situ hybridization (FISH). In total, 7/139
(5.0%) patients demonstrated MET amplification; 24 (17.3%), 29 (20.9%), 31 (22.3%), 29 (20.9%) and 19
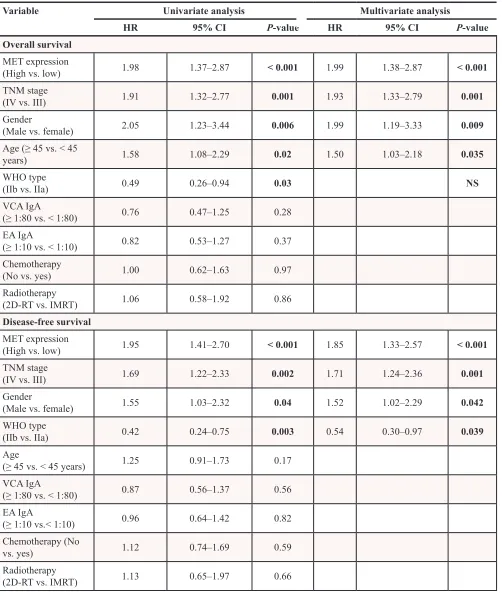
(13.7%) patients displayed high polysomy, low polysomy, high trisomy, low trisomy and disomy, respectively (Figure 2A–2F). The average MET copy number per tumor
cell ranged from 1.6 to 9.67 (mean, 3.23). The MET/CEP7
ratio ranged from 0.9 to 4.1 (mean, 1.22).
The correlation between the MET amplification
status and the clinicopathological characteristics of the patients with high MET expression are shown in Table 1.
MET amplification was significantly associated with death (85.7% vs. 39.4%, P = 0.021). However, there was
no significant association between the MET copy number status and any other clinicopathological factor.
Correlation between MET copy number status and MET protein expression
In the 139 patients with high MET expression, the
MET copy number status correlated significantly with MET
protein expression (r = 0.629, P < 0.001, Spearman’s rank; Table 2). The cases with a MET IHC score of 3+ had a markedly higher MET copy number compared to the cases with a MET IHC score of 2+. All seven tumors with MET
amplification demonstrated a MET IHC score of 3+, while
no MET amplification was detected in the 2+ tumors.
Prognostic value of MET protein overexpression and MET amplification
Univariate analysis indicated that MET protein expression, TNM stage, gender and WHO type had a
significant impact on 5-year overall survival (OS) and
disease-free survival (DFS; both P < 0.05; Table 3). The
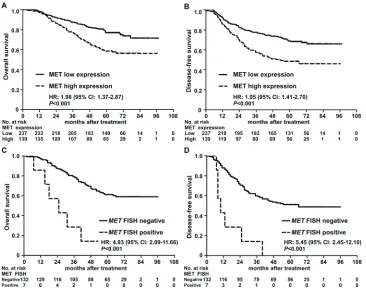
5-year OS (58.6% vs. 76.9%, P < 0.001; Figure 3A) and DFS (48.5% vs. 68.8%, P < 0.001; Figure 3B) rates for
patients with high MET expression were significantly
lower than the corresponding rates for patients with low MET expression. In the group of patients with high MET expression, MET gene amplification was associated with
poorer OS and DFS (P < 0.05) in univariate analysis, and patients with MET amplification had significantly poorer
5-year OS (48.5% vs. 68.8%, P < 0.001; Figure 3C) and DFS (0.0% vs. 51.1%, P < 0.001; Figure 3D).
Multivariate analysis revealed MET protein overexpression was an independent prognostic factor for
OS (HR, 1.99; 95% CI, 1.38-2.87; P < 0.001) and DFS (HR,
1.85; 95% CI, 1.33-2.57; P < 0.001). TNM stage and gender were also found to be independent prognostic factors for OS and DFS (Table 3). Moreover, in the group of patients with high MET expression, MET amplification was also an independent prognostic factor for OS (HR, 4.24; 95% CI,
1.78-10.08; P < 0.001) and DFS (HR, 5.44; 95% CI, 2.44-12.09; P < 0.001). Taken together, these results indicate that MET protein overexpression is associated with unfavorable OS and DFS, and that MET amplification can be used to
identify a subgroup of patients with high MET expression at risk of poor survival outcomes.
DISCUSSION
In the present study, we report that MET protein was overexpressed in the tumors of 37.0% of the patients with locoregionally advanced NPC, with MET gene
amplification observed in 5.0% of the patients with
high MET expression. MET overexpression and MET
amplification were both associated with a significantly poorer prognosis and were identified as independent
prognostic factors for overall survival (OS) and disease-free survival (DFS). These results suggest that MET Characteristic METexpression (n = 376) MET amplification (n = 139)
Low n (%),
(n = 237) High (n = 139)n (%), P Negative (n = 132)n (%), Positive (n = 7)n (%), P Distant metastasis
Yes 40 (16.9) 40 (28.8) 0.006 37 (28.0) 3 (42.9) 0.410 No 197 (85.6) 99 (71.2) 95 (72.0) 4 (57.1)
Death
Yes 56 (23.6) 58 (41.7) < 0.001 52 (39.4) 6 (85.7) 0.021
No 181 (76.4) 81 (58.3) 80 (60.6) 1 (14.3)
[image:4.612.57.555.52.200.2]overexpression and MET amplification are potential biomarkers that could enable identification of a subgroup
of patients with NPC who may be sensitive to MET-targeted therapy.
MET is aberrantly activated in a wide range of tumors, including lung cancer, gastric cancer, glioblastoma
and renal-cell carcinoma [19, 22, 31, 32]. Aberrant MET
signaling contributes to the initiation and progression of cancer [11, 12, 14, 16]. Accumulating evidence indicates that protein overexpression is one of the major mechanisms underlying the aberrant activation of MET, and overexpression of MET is associated with poor patient survival in a variety of types of cancer [25, 33–35]. Although several studies have evaluated the frequency and prognostic value of MET overexpression in NPC, the results of these studies are highly variable, with MET
overexpression rates ranging from 51.5% to 91.1%, and some studies even reporting that MET had no significant
prognostic value [28–30]. These controversial results may stem from the analysis of relatively small cohorts,
as well as the use of different primary and secondary antibodies, staining protocols and scoring criteria. With the progression of MET inhibitors into clinical trials, an IHC assay was developed to evaluate MET protein expression using a rabbit monoclonal antibody SP44 [36]. During Phase II studies in gastric cancer (rilotumumab) and non-small cell lung cancer (onartuzumab), an IHC scoring algorithm based on the proportion of positive tumor cells and the staining intensity was established
[36–39]. Using these IHC methods, antibody and scoring
system, patients whose tumors overexpressed MET were
demonstrated to benefit from MET-targeted therapies [36–39]. Using the same protocol, we identified that 37.0%
of patients with locally advanced NPC overexpressed
MET protein. Additionally, significant associations were
observed between MET overexpression and locoregional failure, distant metastasis and death in patients with locoregionally advanced NPC, consistent with previous observations in gastric and lung cancer [25, 33–35]. Furthermore, overexpression of MET was associated
Table 2: Correlation between
MET
copy number status and MET protein expression in the
139 patients with high MET expression
MET copy number status IHC Score Disomy
n (%) Low Trisomy n (%) Trisomy High
n (%)
Low Polysomy
n (%)
High Polysomy
n (%)
Amplification
n (%) Total
2+ 19 (100) 28 (96.6) 30 (96.8) 20 (69.0) 7 (29.2) 0 (0) 104 3+ 0 (0) 1 (3.4) 1 (3.2) 9 (31.0) 17 (70.8) 7 (100) 35
Total 19 29 31 29 24 7 139
Abbreviation: IHC, immunohistochemistry score.
Figure 2: Evaluation of MET gene copy number status in patients with high MET expression in locoregionally advanced nasopharyngeal carcinoma using FISH. A–F. Representative images of tumors with MET disomy A. low trisomy
[image:5.612.104.511.49.254.2] [image:5.612.61.556.350.458.2]Table 3: Univariate and multivariable Cox regression analysis of prognostic factors in 376 patients
with locoregionally advanced NPC
Variable Univariate analysis Multivariate analysis
HR 95% CI P-value HR 95% CI P-value
Overall survival MET expression
(High vs. low) 1.98 1.37–2.87 < 0.001 1.99 1.38–2.87 < 0.001 TNM stage
(IV vs. III) 1.91 1.32–2.77 0.001 1.93 1.33–2.79 0.001 Gender
(Male vs. female) 2.05 1.23–3.44 0.006 1.99 1.19–3.33 0.009
Age (≥ 45 vs. < 45
years) 1.58 1.08–2.29 0.02 1.50 1.03–2.18 0.035
WHO type
(IIb vs. IIa) 0.49 0.26–0.94 0.03 NS
VCA IgA
(≥ 1:80 vs. < 1:80) 0.76 0.47–1.25 0.28
EA IgA
(≥ 1:10 vs. < 1:10) 0.82 0.53–1.27 0.37
Chemotherapy
(No vs. yes) 1.00 0.62–1.63 0.97 Radiotherapy
(2D-RT vs. IMRT) 1.06 0.58–1.92 0.86 Disease-free survival
MET expression
(High vs. low) 1.95 1.41–2.70 < 0.001 1.85 1.33–2.57 < 0.001 TNM stage
(IV vs. III) 1.69 1.22–2.33 0.002 1.71 1.24–2.36 0.001 Gender
(Male vs. female) 1.55 1.03–2.32 0.04 1.52 1.02–2.29 0.042 WHO type
(IIb vs. IIa) 0.42 0.24–0.75 0.003 0.54 0.30–0.97 0.039 Age
(≥ 45 vs. < 45 years) 1.25 0.91–1.73 0.17
VCA IgA
(≥ 1:80 vs. < 1:80) 0.87 0.56–1.37 0.56
EA IgA
(≥ 1:10 vs.< 1:10) 0.96 0.64–1.42 0.82
Chemotherapy (No
vs. yes) 1.12 0.74–1.69 0.59
Radiotherapy
(2D-RT vs. IMRT) 1.13 0.65–1.97 0.66
Abbreviations: WHO type IIa, differentiated non-keratinizing nasopharyngeal carcinoma; WHO type IIb, undifferentiated non-keratinizing nasopharyngeal carcinoma; VCA–IgA, viral capsid antigen immunoglobulin A; EA–IgA, early antigen immunoglobulin A; IMRT: intensity-modulated radiotherapy; 2D–RT: two-dimensional radiotherapy; HR, hazard ratio; NS,
with significantly poorer survival outcomes, suggesting that identification of MET overexpression using IHC may
provide a potential biomarker to enable the individualized treatment of patients with NPC.
Gene amplification is another well-recognized
mechanism that can lead to constitutive activation of
MET [19, 40]. Based on the gold standard method of
FISH, several studies have reported that MET is amplified
in ~5% patients with non-small cell lung cancer and
gastric cancer [19, 22, 34, 35, 41]. Additionally, patients
[image:7.612.125.491.48.336.2]with MET amplification have a poorer clinical prognosis
[22, 42, 43]. Interestingly, MET protein overexpression
correlated significantly with MET amplification, and
MET amplification was rare in patients with low MET
expression, ranging from 0% (0/283) to 0.6% (1/163) [34, 35]. Preliminary data from other studies have suggested that MET amplification can identify subgroups of patients with lung or gastric cancer who may benefit
from MET inhibitors, suggesting that MET amplification
as a may represent a putative biomarker [20, 27, 44, 45]. However, until now, the prevalence of MET amplification
was unknown in NPC. This study demonstrated that 5.0% of patients with high MET expression had MET
amplification. A significantly positive correlation was
observed between MET amplification and MET protein
overexpression, in agreement with previous data in
gastric and lung cancer [35, 42]. All patients with MET
amplification had a MET IHC score of 3+, and the
majority of the remaining patients with a MET IHC score of 3+ had polysomy. Moreover, MET amplification was
an independent prognostic factor for OS and DFS, further indicating that MET amplification may identify a subgroup
of patients with high MET expression at risk of poorer
survival who may benefit from MET inhibitor therapy.
In conclusion, this study evaluated the frequency of MET overexpression and MET amplification in
locoregionally advanced NPC, and demonstrated that both MET overexpression and MET amplification were
associated with poorer OS and DFS. These results enhance our knowledge of the mechanisms underlying aberrant activation of the MET pathway in NPC, and may help to establish MET as a novel prognostic biomarker and therapeutic target for the treatment of subgroups of patients with locoregionally advanced NPC.
MATERIALS AND METHODS
Clinical specimens
Paraffin-embedded biopsy specimens from 376 consecutive patients with histologically-confirmed,
non-distant metastatic NPC treated at Sun Yat-sen University
Figure 3: Kaplan-Meier overall survival and disease-free survival curves for patients with nasopharyngeal carcinoma stratified by MET protein expression and MET amplification status. A–B. Overall survival and disease-free survival curves
for patients stratified by MET protein expression. C–D. Overall survival and disease-free survival curves for patients with high MET
expression stratified by MET amplification status. Hazard ratios (HRs) were calculated using the unadjusted Cox proportional hazards
Cancer Center between January 2006 and December 2009 were evaluated; all samples were pathologically confirmed
by two pathologists. No patients received radiotherapy or chemotherapy before biopsy. All MRI/CT materials and clinical records were reviewed and patients were restaged according to the 7th edition of the AJCC Cancer Staging Manual. The clinical characteristics of the patients are summarized in Table 1. Written informed consent was obtained from all patients. This study was approved by the Institutional Ethical Review Board of Sun Yat-sen University Cancer Center.
Patient treatment and follow-up
All patients received radiotherapy, as previously
described [6]; 337 patients (89.6%) were treated with
conventional two-dimensional radiotherapy (2D-RT)
and 39 (10.4%) with intensity-modulated radiotherapy
(IMRT). All patients had stage III (56.6%) or IV (43.4%) NPC. A total of 311 patients (82.7%) received concurrent platinum-based chemotherapy with or without neoadjuvant/adjuvant chemotherapy, as previously described [4, 5]. Concurrent chemotherapy consisted of cisplatin administered on weeks 1, 4 and 7 of radiotherapy, or weekly. Neoadjuvant and adjuvant chemotherapy
consisted of cisplatin with 5-flurouracil or taxanes every
three weeks for three cycles.
Follow-up
All patients were followed-up at least every
3 months during the first 2 years and then every 6 months
thereafter until death. Median follow-up was 62.4 months
(range, 2.6–97.3 months). The following end points were
assessed: overall survival (OS) and disease-free survival
(DFS). OS was calculated from the first day of treatment to death; DFS, from the first day of treatment to disease
progression or death from any cause.
Immunohistochemistry
Immunohistochemistry (IHC) for MET was performed using an automatic staining system (Bench Mark ULTRA; Ventana Medical Systems, Tucson, AZ, USA), according to the manufacturer’s instructions with CONFIRM anti-total MET antibody (SP44; rabbit monoclonal primary antibody; Ventana Medical Systems). Immunostaining was evaluated on the basis of the staining intensity (negative, weak, moderate, strong) and the percentage of cells stained, according to the MET IHC scoring criteria for non-small cell lung cancer [36, 37]. The MET IHC scores ranged from 0 to 3+ as follows: 0 (no staining or < 50% of tumor cells with any intensity); 1+
(≥ 50% of tumor cells with weak or higher staining intensity and < 50% with moderate or higher intensity); 2+ (≥ 50%
of tumor cells with moderate or higher staining intensity
and < 50% strong intensity); 3+ (≥ 50% of tumor cells with
strong staining intensity). Scores of 2+ and 3+ were defined as high MET expression, scores of 1+ and 0 were defined as
low MET expression. The IHC scores were independently evaluated by two pathologists who were blinded to the clinical and molecular characteristics of the patients.
Fluorescence in situ hybridization
MET copy number was evaluated using fluorescence
in situ hybridization (FISH), as previously described [46].
Briefly, 4 μm tissue sections were hybridized overnight
with the Vysis MET Spectrum Red FISH Probe (Abbott Molecular, Chicago, IL, USA) and control Vysis CEP7 centromere Spectrum Green Probe (Abbott Molecular). The entire area of each section was scanned using a 100× objective (Olympus, Tokyo, Japan) and appropriate
filter sets (Vysis; Abbott Molecular). The MET (red) and
CEP7 (green) signals were evaluated for at least 100 non-overlapping nuclei in each slide.
Patients were classified into six groups based on
the MET copy number status, according to the University of Colorado Cancer Center criteria [46]: 1, disomy
(< 90% of tumor cells containing ≤ 2 MET signals); 2, low trisomy (≥ 40% of tumor cells containing ≤ 2
MET signals, 10-40% of tumor cells containing three
MET signals, and < 10% of tumor cells containing ≥ 4 MET signals); 3, high trisomy (≥ 40% of tumor cells containing ≤ 2 MET signals, and ≥ 40% of tumor cells
containing three MET signals, and < 10% of tumor
cells containing ≥ 4 MET signals); 4, low polysomy (10–40% of tumor cells containing ≥ 4 MET signals); 5, high polysomy (≥ 40% of tumor cells containing ≥
4 MET signals) and 6, MET amplification (MET/CEP7 ratio ≥ 2.0 or ≥ 10% of tumor cells containing ≥ 15 MET
signals). MET amplification was defined as MET
FISH-positive; the remaining cases were classified as MET
FISH-negative. MET copy number status was determined by two investigators while blinded to the clinical and molecular characteristics of the patients and IHC data.
Statistical analysis
All statistical analysis was performed using SPSS 16.0 software (IBM, Armonk, NY, USA). Categorical
variables were compared using the χ2 and Fisher’s exact
tests. The association between MET FISH status and MET protein expression was evaluated using the Spearman’s rank method. Actuarial rates were calculated using the Kaplan-Meier method; differences were compared using the log-rank test. Multivariate analysis using a Cox proportional hazards model was performed to calculate hazard ratios
(HRs) and 95% confidence intervals (CIs), and assess independent significance by backward elimination of insignificant explanatory variables. Covariates including
host factors (i.e., age and gender), tumor factors (i.e., WHO
type, clinical stage, T and N classification), radiotherapy
(i.e., RT alone or chemo-RT) were included in all tests. All tests were two-tailed; P-values < 0.05 were considered
statistically significant.
CONFLICTS OF INTEREST
The authors declare no conflict of interest.
GRANT SUPPORT
This work was supported by grants from the National Natural Science Foundation of China (81402516), the Pearl River Science and Technology New Star of Guangzhou, China (2015), the Health & Medical Collaborative Innovation Project of Guangzhou City, China (201400000001), the National Science & Technology Pillar Program during the Twelfth Five-year Plan Period
(2014BAI09B10), the Science and Technology Project of
Guangzhou City, China (No.14570006), the Planned Science and Technology Project of Guangdong Province (No. 2013B020400004), and the Key Laboratory Construction Project of Guangzhou City, China (No.121800085).
REFERENCES
1. Jemal A, Bray F, Center MM, Ferlay J, Ward E, Forman D.
Global cancer statistics. CA Cancer J Clin. 2011; 61:69–90.
2. McDermott AL, Dutt SN, Watkinson JC. The aetiology of nasopharyngeal carcinoma. Clin Otolaryngol Allied Sci.
2001; 26:82–92.
3. Wei WI, Sham JS. Nasopharyngeal carcinoma. Lancet 2005; 365:2041–2054.
4. Lee AW, Lin JC, Ng WT. Current management of naso-pharyngeal cancer. Semin Radiat Oncol. 2012; 22:233–244. 5. Baujat B, Audry H, Bourhis J, Chan AT, Onat H, Chua DT,
Kwong DL, Al-Sarraf M, Chi KH, Hareyama M, Leung SF, Thephamongkhol K, Pignon JP, et al. Chemotherapy in locally advanced nasopharyngeal carcinoma: an individual patient data meta-analysis of eight randomized trials and 1753 patients. Int J Radiat Oncol Biol Phys. 2006; 64:47–56. 6. Lai SZ, Li WF, Chen L, Luo W, Chen YY, Liu LZ, Sun Y,
Lin AH, Liu MZ, Ma J. How does intensity-modulated radiotherapy versus conventional two-dimensional
radio-therapy influence the treatment results in nasopharyngeal
carcinoma patients? Int J Radiat Oncol Biol Phys. 2011; 80:661–668.
7. Chen YP, Wang ZX, Chen L, Liu X, Tang LL, Mao YP, Li WF, Lin AH, Sun Y, Ma J. A Bayesian network meta-analysis comparing concurrent chemoradiotherapy followed by adjuvant chemotherapy, concurrent chemoradiotherapy alone and radiotherapy alone in patients with locoregion-ally advanced nasopharyngeal carcinoma. Ann Oncol. 2014; 26:205–211.
8. Mok TS, Wu YL, Thongprasert S, Yang CH, ChuDT, Saijo N, Sunpaweravong P, Han B, Margono B,
Ichinose Y, Nishiwaki Y, Ohe Y, Yang JJ, et al. Gefitinib
or carboplatin-paclitaxel in pulmonary adenocarcinoma.
N Engl J Med. 2009; 361:947–957.
9. Sequist LV, Martins RG, Spigel D, Grunberg SM, Spira A, Janne PA, Joshi VA, McCollum D, Evans TL, Muzikansky A, Kuhlmann GL, Han M, Goldberg JS, et
al. First-line gefitinib in patients with advanced
non-small-cell lung cancer harboring somatic EGFR mutations. J Clin
Oncol. 2008; 26:2442–2449.
10. Wang X, DeFrances MC, Dai Y, Pediaditakis P, Johnson C, Bell A, Michalopoulos GK, Zarnegar R. A mechanism of cell survival: sequestration of Fas by the HGF receptor Met.
Mol Cell. 2002; 9:411–421.
11. Giordano S, Ponzetto C, Di Renzo MF, Cooper CS, Comoglio PM. Tyrosine kinase receptor indistinguishable
from the c-met protein. Nature. 1989; 339:155–156.
12. Trusolino L, Bertotti A, Comoglio PM. MET signalling: principles and functions in development, organ regenera-tion and cancer. Nat Rev Mol Cell Biol. 2010; 11:834–848. 13. Liu P, Cheng H, Santiago S, Raeder M, Zhang F, Isabella A,
Yang J, Semaan DJ, Chen C, Fox EA, Gray NS, Monahan J, Schlegel R, et al. Oncogenic PIK3CA-driven mammary tumors frequently recur via PI3K pathway-dependent and PI3K pathway-independent mechanisms. Nat Med. 2011; 17:1116–1120.
14. Joffre C, Barrow R, Menard L, Calleja V, Hart IR, Kermorgant S. A direct role for Met endocytosis in tumori-genesis. Nat Cell Biol. 2011; 13:827–837.
15. Maina F, Pante G, Helmbacher F, Andres R, Porthin A,
Davies AM, Ponzetto C, Klein R. Coupling Met to specific
pathways results in distinct developmental outcomes. Mol
Cell. 2001; 7:1293–1306.
16. Birchmeier C, Birchmeier W, Gherardi E, Vande WG. Met, metastasis, motility and more. Nat Rev Mol Cell Biol. 2003;
4:915–925.
17. Gherardi E, Birchmeier W, Birchmeier C, Vande WG. Targeting MET in cancer: rationale and progress. Nat Rev
Cancer. 2012; 12:89–103.
18. Kentsis A, Reed C, Rice KL, Sanda T, Rodig SJ, Tholouli E, Christie A, Valk PJ, Delwel R, Ngo V, Kutok JL, Dahlberg SE, Moreau LA, et al. Autocrine acti-vation of the MET receptor tyrosine kinase in acute myeloid leukemia. Nat Med. 2012; 18:1118–1122.
19. Graziano F, Galluccio N, Lorenzini P, Ruzzo A, Canestrari E, D’Emidio S, Catalano V, Sisti V, Ligorio C, Andreoni F, Rulli E, Di Oto E, Fiorentini G, et al. Genetic activation of the MET pathway and prognosis of patients with high-risk, radically resected gastric cancer. J Clin
Oncol. 2011; 29:4789–4795.
et al. MET amplification identifies a small and aggres -sive subgroup of esophagogastric adenocarcinoma with evidence of responsiveness to crizotinib. J Clin Oncol.
2011; 29:4803–4810.
21. Saada E, Peoc’H M, Decouvelaere AV, Collard O, Peyron AC, Pedeutour F. CCND1 and MET genomic
amplification during malignant transformation of a giant cell tumor of bone. J Clin Oncol. 2011; 29:e86–e89.
22. Cappuzzo F, Marchetti A, Skokan M, Rossi E, Gajapathy S, Felicioni L, Del GM, Sciarrotta MG, Buttitta F, Incarbone M, Toschi L, Finocchiaro G, Destro A, et al. Increased MET gene copy number negatively affects sur-vival of surgically resected non-small-cell lung cancer
patients. J Clin Oncol. 2009; 27:1667–1674.
23. Peters S, Adjei AA. MET: a promising anticancer
therapeu-tic target. Nat Rev Clin Oncol. 2012; 9:314–326.
24. Comoglio PM, Giordano S, Trusolino L. Drug development of MET inhibitors: targeting oncogene addiction and expe-dience. Nat Rev Drug Discov. 2008; 7:504–516.
25. Blumenschein GJ, Mills GB, Gonzalez-Angulo AM. Targeting the hepatocyte growth factor-cMET axis in
can-cer therapy. J Clin Oncol. 2012; 30:3287–3296.
26. Appleman LJ. MET signaling pathway: a rational target for
cancer therapy. J Clin Oncol. 2011; 29:4837–4838.
27. Smolen GA, Sordella R, Muir B, Mohapatra G, Barmettler A, Archibald H, Kim WJ, Okimoto RA, Bell DW, Sgroi DC, Christensen JG, Settleman J,
Haber DA. Amplification of MET may identify a subset
of cancers with extreme sensitivity to the selective tyrosine kinase inhibitor PHA-665752. Proc Natl Acad Sci USA. 2006; 103:2316–2321.
28. Li Z, Lin SX, Liang HZ, He JH. Expression of hepatocyte growth factor/c-Met system in nasopharyngeal carcinoma
and its biological significance. Zhonghua Bing Li Xue Za Zhi. 2005; 34:75–79.
29. Qian CN, Guo X, Cao B, Kort EJ, Lee CC, Chen J, Wang LM, Mai WY, Min HQ, Hong MH, Vande WG, Resau JH, Teh BT. Met protein expression level correlates with survival in patients with late-stage nasopharyngeal
car-cinoma. Cancer Res. 2002; 62:589–596.
30. Xie LQ, Bian LJ, Li Z, Li Y, Li ZX, Li B. Altered expres-sion of E-cadherin by hepatocyte growth factor and effect on the prognosis of nasopharyngeal carcinoma. Ann Surg
Oncol. 2010; 17:1927–1936.
31. Sadiq AA, Salgia R. MET as a possible target for
non-small-cell lung cancer. J Clin Oncol. 2013; 31:1089–1096.
32. Snuderl M, Fazlollahi L, Le LP, Nitta M, Zhelyazkova BH, Davidson CJ, Akhavanfard S, Cahill DP, Aldape KD,
Betensky RA, Louis DN, Iafrate AJ. Mosaic amplification
of multiple receptor tyrosine kinase genes in glioblastoma. Cancer Cell. 2011; 20:810–817.
33. Yu S, Yu Y, Zhao N, Cui J, Li W, Liu T. C-Met as a prog-nostic marker in gastric cancer: a systematic review and
meta-analysis. PLoS One. 2013; 8:e79137.
34. Lee HE, Kim MA, Lee HS, Jung EJ, Yang HK, Lee BL, Bang YJ, Kim WH. MET in gastric carcinomas: com-parison between protein expression and gene copy num-ber and impact on clinical outcome. Br J Cancer. 2012; 107:325–333.
35. An X, Wang F, Shao Q, Wang F, Wang Z, Chen C, Li C,
Luo H, Zhang D, Xu R, Li Y. MET Amplification Is Not
Rare and Predicts Unfavorable Clinical Outcomes in Patients With Recurrent = Metastatic Gastric Cancer After Chemotherapy. Cancer. 2014; 120:675–682.
36. Koeppen H, Rost S, Yauch RL. Developing biomarkers
to predict benefit from HGF/MET pathway inhibitors. J
Pathol. 2014; 232:210–218.
37. Spigel DR, Ervin TJ, Ramlau RA, Daniel DB, Goldschmidt JJ, Blumenschein GJ, Krzakowski MJ, Robinet G, Godbert B, Barlesi F, Govindan R, Patel T, Orlov SV, et al. Randomized phase II trial of Onartuzumab in combination with erlotinib in patients with advanced non-small-cell lung cancer. J Clin Oncol. 2013; 31:4105–4114. 38. Iveson T, Donehower RC, Davidenko I, Tjulandin S,
Deptala A, Harrison M, Nirni S, Lakshmaiah K, Thomas A, Jiang Y, Zhu M, Tang R, Anderson A, et al. Rilotumumab in combination with epirubicin, cisplatin, and capecitabine
as first-line treatment for gastric or oesophagogastric junc -tion adenocarcinoma: an open-label, dose de-escala-tion phase 1b study and a double-blind, randomised phase 2 study. Lancet Oncol. 2014; 15:1007–1018.
39. Spigel DR, Edelman MJ, Mok T, O’Byrne K, Paz-Ares L, Yu W, Rittweger K, Thurm H. Treatment Rationale Study Design for the Met Lung Trial: A Randomized, Double-Blind Phase III Study of Onartuzumab (MetMAb) in Combination With Erlotinib Versus Erlotinib Alone in Patients Who Have Received Standard Chemotherapy for Stage IIIB or IV Met-Positive Non-Small-Cell Lung Cancer. Clin Lung Cancer. 2012; 13:500–504.
40. Hellman A, Zlotorynski E, Scherer SW, Cheung J, Vincent JB, Smith DI, Trakhtenbrot L, Kerem B. A role for
common fragile site induction in amplification of human oncogenes. Cancer Cell. 2002; 1:89–97.
41. Jardim DLF, Tang C, Gagliato DDM, Falchook GS, Hess K, Janku F, Fu S, Wheler JJ, Zinner RG, Naing A, Tsimberidou AM, Holla V, Li MM, et al. Analysis of
1,115 Patients Tested for MET Amplification and Therapy
Response in the MD Anderson Phase I Clinic. Clin Cancer Res. 2014; 20:6336–6345.
42. Schildhaus HU, Schultheis AM, Ruschoff J, Binot E, Merkelbach-Bruse S, Fassunke J, Schulte W, Ko YD, Schlesinger A, Bos M, Gardizi M, Engel-Riedel W,
Brockmann M, et al. MET Amplification Status in
Therapy-Naive Adeno- and Squamous Cell Carcinomas of the Lung. Clin Cancer Res. 2014; . DOI: 10.1158/1078-0432. 43. Jin Y, Sun P, Kim H, Seo AN, Jheon S, Lee C, Chung J.
44. Koeppen H, Yu W, Zha J, Pandita A, Penuel E, Rangell L, Raja R, Mohan S, Patel R, Desai R, Fu L, Do A, Parab V, et al. Biomarker Analyses from a Placebo-Controlled Phase II Study Evaluating Erlotinib ± Onartuzumab in Advanced Non-Small Cell Lung Cancer: MET Expression Levels
Are Predictive of Patient Benefit. Clin Cancer Res. 2014; 20:4488–4498.
45. Choueiri TK, Vaishampayan U, Rosenberg JE, Logan TF, Harzstark AL, Bukowski RM, Rini BI, Srinivas S, Stein MN, Adams LM, Ottesen LH, Laubscher KH,
Sherman L, et al. Phase II and biomarker study of the dual MET/VEGFR2 inhibitor foretinib in patients with papillary renal cell carcinoma. J Clin Oncol. 2013; 31:181–186.
46. Cappuzzo F, Hirsch FR, Rossi E, Bartolini S, Ceresoli GL, Bemis L, Haney J, Witta S, Danenberg K, Domenichini I, Ludovini V, Magrini E, Gregorc V, et al. Epidermal growth
factor receptor gene and protein and gefitinib sensitivity
in non-small-cell lung cancer. J Natl Cancer Inst. 2005;