http://www.scirp.org/journal/psych ISSN Online: 2152-7199 ISSN Print: 2152-7180
Work Personality (Wave), Intelligence and the
Dark Side at Work
Kat Palaiou
1, Jackie Sykes
2, Chris Welford
2, Adrian Furnham
1,31Research Department of Clinical, Educational and Health Psychology, University College London, London, UK 2Sixth Sense Consulting, London, UK
3Norwegian Business School (BI), Nydalveien, Olso, Norway
Abstract
This study examined the relationship between the “bright” and “dark” side of work personality, as well as their relationship to cognitive ability. In all 374 working adults completed three tests at work: Hogan Development Survey (HDS) (Hogan & Hogan, 2009); Saville Consulting Wave Professional Styles (Saville Consulting, 2005); Ra-ven’s Progressive Matrices (Raven, Raven, & Court, 1998). The four behavioural clusters (Thought, Influence, Adaptability, Delivery) of the “bright side” test were independent of one another. Three of the four correlations between intelligence and personality were significant. Regressions showed that gender, intelligence, and the “dark side” factors measured at facet and higher order levels accounted for between 7% and 37% of the variance. The thought cluster was best predicted by intelligence and high scores on Leisurely, Bold and Imaginative. The influence cluster was best predicted by intelligence (negatively), skeptical, reserved (negative) and colourful. The adaptability cluster was most related to diligence (negatively). Finally, delivery was predicted by intelligence (negatively), excitability (negatively), skeptical and diligence. Limitations and implications are considered.
Keywords
Dark and Bright Side Personality, Intelligence, Work Personality, Gender
1. Introduction
Organisational scientists have spent the last 20 years, trying to identify which are the ingredients that make a senior manager successful. Research has shown that intelli-gence and personality traits play a vital role on predicting major life outcomes, such work performance (Barrick & Mount, 1991;Judge, Higgins, Thoresen, & Barrick, 1999).
How to cite this paper: Palaiou, K., Sykes, J., Welford, C., & Furnham, A. (2016). Work Personality (Wave), Intelligence and the Dark Side at Work. Psychology, 7, 1531-1544. http://dx.doi.org/10.4236/psych.2016.713149
Received: August 25, 2016 Accepted: November 7, 2016 Published: November 10, 2016
Copyright © 2016 by authors and Scientific Research Publishing Inc. This work is licensed under the Creative Commons Attribution International License (CC BY 4.0).
http://creativecommons.org/licenses/by/4.0/
Further, organisational researchers have started to investigate the dark side of personal-ity and work achievement/promotion/experience (Furnham, Crump, & Ritchie, 2013; Spain, Harms, & Lebreton, 2013).
The aim of this study is to investigate behaviours related to workplace, like capability, with the dark side of personality while controlling for intelligence and gender. There have been a number of studies looking at the relation between the “bright” and the “dark” side personality and its connection with work success (Furnham, Hyde, & Trickey, 2012a) as well as the relationship between personality and intelligence (Chamorro- Premuzic & Furnham, 2005a). This study looks at the relation of intelligence and “dark” side personality to workplace personality as assessed by a relatively new, but validated test.
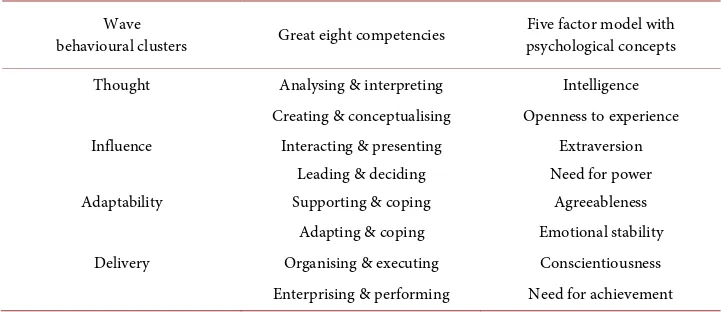
The Wave Professional Styles (Wave) have its foundation on a hierarchical model of occupational personality that is based on the Five Factor Model (FFM) (Costa Jr. & McCrae, 1990) and Great Eight (Bartram, 2005). The wave has four behavioural clus-ters: thought, influence, adapting and delivery (Table 1). It measures a broad spectrum of work behaviours from personality to motives, talents, preferred culture and compe-tency potential (McDowall & Kurz, 2007). These are conceived of as independent be-havioural clusters, which reflect particular work-related competencies.
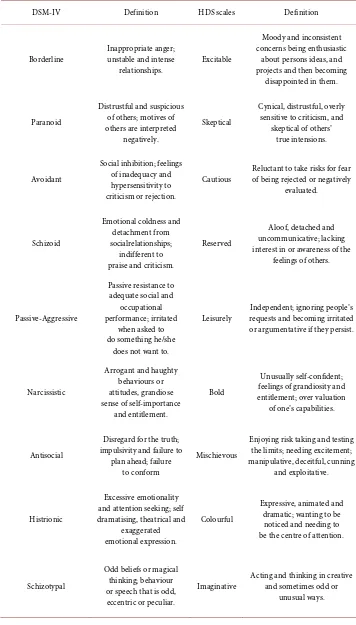
The Hogan Development Survey (HDS) (Hogan & Hogan, 2001) was used to meas-ure “dark side” traits. The HDS obtains 11 subclinical traits and uses positive softened naming instead of the more negative termed in DSM-IV (see Table 2) (Spain et al., 2013). Factorial analysis has shown that these 11 subscales are separated in three clus-ters known as moving against (bold, mischievious, colourful, imaginative), moving to-wards (diligent and dutiful) and moving away from others (excitable, cautious, skepti-cal, reserved, leisurely) (Furnham & Trickey, 2011;Khoo & Burch, 2008).
Intelligence is measured by using Raven’s Progressive Matrices (Raven, 1990/2000)
[image:2.595.192.553.537.693.2]which is one of the most established, validated and celebrated measures of cognitive ability. Since the end of World War I, the measure of general mental ability (GMA) or
Table 1. The correspondence of the four wave behavioural clusters with the great eight and a combination of five factor model with psychological concepts.
Wave
behavioural clusters Great eight competencies Five factor model with psychological concepts
Thought Analysing & interpreting Intelligence Creating & conceptualising Openness to experience Influence Interacting & presenting Extraversion
Leading & deciding Need for power Adaptability Supporting & coping Agreeableness
Adapting & coping Emotional stability Delivery Organising & executing Conscientiousness Enterprising & performing Need for achievement
Table 2. Overlapping themes from HDS and DMS-IV Axis II.
DSM-IV Definition HDS scales Definition
Borderline Inappropriate anger; unstable and intense
relationships. Excitable
Moody and inconsistent concerns being enthusiastic
about persons ideas, and projects and then becoming
disappointed in them.
Paranoid
Distrustful and suspicious of others; motives of others are interpreted
negatively.
Skeptical
Cynical, distrustful, overly sensitive to criticism, and
skeptical of others’ true intensions.
Avoidant
Social inhibition; feelings of inadequacy and hypersensitivity to criticism or rejection.
Cautious Reluctant to take risks for fear of being rejected or negatively evaluated.
Schizoid
Emotional coldness and detachment from socialrelationships;
indifferent to praise and criticism.
Reserved
Aloof, detached and uncommunicative; lacking interest in or awareness of the
feelings of others.
Passive-Aggressive
Passive resistance to adequate social and
occupational performance; irritated
when asked to do something he/she
does not want to.
Leisurely requests and becoming irritated Independent; ignoring people’s or argumentative if they persist.
Narcissistic
Arrogant and haughty behaviours or attitudes, grandiose sense of self-importance
and entitlement.
Bold
Unusually self-confident; feelings of grandiosity and entitlement; over valuation
of one’s capabilities.
Antisocial
Disregard for the truth; impulsivity and failure to
plan ahead; failure to conform
Mischievous
Enjoying risk taking and testing the limits; needing excitement; manipulative, deceitful, cunning
and exploitative.
Histrionic
Excessive emotionality and attention seeking; self dramatising, theatrical and
exaggerated emotional expression.
Colourful
Expressive, animated and dramatic; wanting to be
noticed and needing to be the centre of attention.
Schizotypal
Odd beliefs or magical thinking; behaviour or speech that is odd, eccentric or peculiar.
Continued
Obsessive- Compulsive
Preoccupations with orderliness; rules, perfectionism and control; over Conscientiousness and
inflexible.
Diligent
Meticulous, precise and perfectionistic, inflexible about rules and procedures; critical of others.
Dependent
Difficulty making everyday decisions without excessive advice and reassurance;
difficulty expressing disagreement out of fear of loss of support
or approval.
Dutiful
Eager to please and reliant on others for support and guidance; reluctant to take independent action or to go
against popular opinion.
Note: Description was taken from HDS manual (Hogan & Hogan, 2009) and Spain et al. (2013: p. 4).
intelligence has an important role, in the workplace, especially for hiring employees
(Yerkes, 1921). Schmidt & Hunter (2004) found that the correlation range of GMA and job success/performance is from .31 to .73.
Many studies have examined personality correlates of work success (Furnham, 2008; Hurtz & Donovan, 2000). Judge et al. (1999) found in relation to occupational level and income that conscientiousness has a positive relation .51 and .53, openness to experi-ence .26 and .32 and neuroticism −.26 and −.34 respectively. Studies suggest that con-scientiousness is usually the most powerful predictor of all work outcome measures and that together the Big Five factors together may account for between 10% and 30% of the variance. For instance, Furnham et al. (2013) recently demonstrated that conscien-tiousness, more than any trait or intelligence was the strongest predictor of speed of promotion.
Various studies have examined the relationship between well-known and established personality measures and “dark” side factors (Furnham et al., 2013;Furnham & Crump, 2005). Furnham and Crump (2005) found that neuroticism is predicted by high scores in excitable, skeptical, cautious, leisurely, imaginative, diligent and dutiful and by low scores in reserved, mischievous and colourful. Extraversion is predicted by high scores in bold, mischievous, colourful and imaginative and by low scores in cautious, reserved and diligent. Openness to experience is predicted by high scores in bold, mischievous, colourful and imaginative and by low scores in leisurely. Agreeableness is predicted by high scores in cautious and dutiful and by low scores in excitable, skeptical, reserved, bold, mischievous, colourful and imaginative. Finally, conscientiousness is predicted by high scores in skeptical, bold, colourful and diligent and by low scores in mischievous and imaginative.
(Furnham et al., 2012a) as well speed of promotion (Furnham et al., 2013) Mischievous is positively linked with stress tolerance and sales potential (Furnham, Hyde, & Trickey, 2012b) and promotion is positively related with diligent and dutiful (Race, Hyde, & Furnham, 2012).
This study will explore the extent to which the four behavioural clusters of wave are predicted by the dark side of personality while controlling for intelligence and gender. According to the Wave model, thought is associated with openness; influence with extraversion and agreeableness, adaptability with neuroticism and delivery with con-scientiousness. Based on previous studies in this area, but using different measure-ments, it is predicted that imaginative is most associated with thought, colourful with influence, excitable with adaptability and diligence with delivery. It is also predicted that intelligence is positively correlated with thought but negatively correlated with de-livery (Furnham et al., 2013).
2. Method
2.1. Participants
In all 374 employees of a UK company took part in this study. Due to missing data on HDS, Ravens and Wave, only 181 were considered where 33 (18.2%) were females. The age of the participants was not collected.
2.2. Materials
Hogan Development Survey (HDS) (Hogan & Hogan, 2009). HDS is a self-adminis-
tered personality questionnaire that focuses on personality disorders occupying the psychological space halfway between psychopathology and normal personality, which means that it allows for a dimensional approach to the research. It includes 154 items that are dichotomous (true-false). The coefficient alphas were ranging from .5 to .7 with the average alpha coefficient being .64. In the test-retest reliabilities for sample of 60 participants over a three-month interval the range were between .5 and .8, having an average of .68.
The Raven’s Progressive Matrices (Ravens). Ravens assesses problem-solving and
reasoning ability (Raven, Raven, & Court, 1998) and has been used to more than 45 countries on samples totalling over 240,000 participants (Brouwers, Van de Vigver, & Van Hemert, 2009). The test has 48 items. Each item of this test is consisted by a pat-tern of diagrammatic puzzles with one piece missing. Ravens helps identify an individ-ual’s potential for success in positions like executive, director, general manager or simi-lar professional positions in an organization. The internal validity is .85 in U.S stan-dardisation sample (N = 929) (Raven, 1990/2000).
Wave Professional Styles. Saville Consulting Wave Professional Styles is an online,
self-report measure that was based on the personality model of the Five Factor Model
hierarchical factor/cluster contains three sections and each section is consisting by three dimensions. In total there are 12 sections (see Appendix) (Rojon & McDowall, 2010). In the current study, we will use the four clusters. Wave is used for workplace purposes like recruitment, talent management, and different kinds of development such as team, organisational, personal and coaching. Jayne, Small and Oxley (2006) found internal consistency reliabilities with a mean of .78 and an average corrected validity of .32. Wave has been translated to more than 15 languages and undergone cross- cultural validation to ensure the underlying constructs have remained robust (Saville Consulting, 2005).
2.3. Procedure
Participants were tested by Sixth Sense Consultancy. The participants were given per-sonal feedback on their scores. There anonymised scores were used in this analysis with their consent. They were nearly all employed as middle to senior managers in British company. They took this test as part of an assessment exercise. Inevitably, this could have affected their results because of issues such as impression management and gen-eral dissimulation.
3. Results
Data Analysis
First we explored the reliability of the WAVE measure and inter-correlations between the scales. Then we looked at the correlations between the four WAVE scales and the Dark Side traits at both facet and domain level as well as intelligence. Finally we com-puted a number of regressions to exam the incremental validity of dark side personality over gender and intelligence.
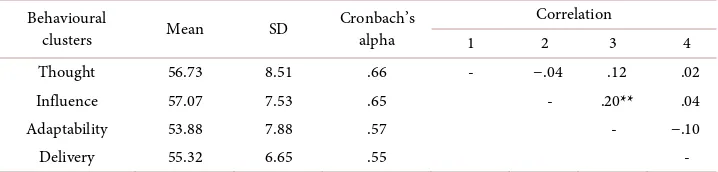
[image:6.595.194.553.597.683.2]Descriptive statistics of the Wave, Cronbach’s Alpha and the inter-correlations of the four clusters are presented in Table 3. When dealing with psychological constructs values below .7 can be realistically expected due to the diversity of the constructs being measure (Kline, 1999). As shown in Table 3, the highest Cronbach’s Alpha is .66 and the lowest is .55, which means that the 66% - 55% is considered as true variance. All the four values at Cronbach’s Alpha are considered relatively low but expected (Kline, 1999).
Table 3. Descriptive statistics, cronbach’s alpha and correlation of the four wave behavioural clusters.
Behavioural
clusters Mean SD Cronbach’s alpha
Correlation
1 2 3 4
Thought 56.73 8.51 .66 - −.04 .12 .02 Influence 57.07 7.53 .65 - .20** .04
Adaptability 53.88 7.88 .57 - −.10
Delivery 55.32 6.65 .55 -
With regards to the inter-correlations, there is only one significant small positive correlation between Influence and Adaptability, showing the four factors are, as hy-pothesised, independent of one another.
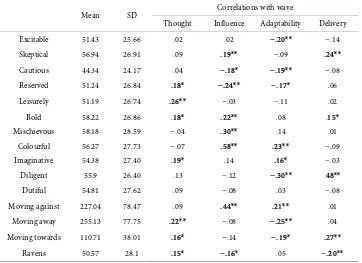
Descriptive statistics of the HDS, the three clusters of HDS and Ravens as well as and their correlation with the four behavioural clusters of Wave are presented in Table 4. Thought has seven small positively significant values ranging from .15 to .26. Influence has three small and two moderate positive correlations ranging from .19 to .58. Fur-thermore, Influence has also three negative small correlations ranging from −.16 to −.24. Adaptability has six small to moderate negative correlations ranging from −.19 to −.30 and three small positive correlations ranging from .16 to .23. Finally, on Delivery there is a small negative correlation of −.20 and four positive correlations ranging from .15 to .48. All hypotheses were confirmed.
A series of hierarchical regressions were performed using the four clusters of Wave as dependent variables and HDS, gender and intelligence (Ravens) as independent variables. The results are presented in Table 5.
[image:7.595.194.556.431.694.2]In step 1 of the hierarchical regression, we controlled for gender and intelligence that accounted for 1.2% of the variance of predicting work behaviours (i.e. motives, talents, preferred culture and competency potential) for Thought, 1.8% for Influence, .9% for Adaptability and 2.8% for Delivery. Ravens was significant in all clusters but Adaptabil-ity. Ravens has a negative relation with Delivery and Influence but a positive relation with Thought.
Table 4. Descriptive statistics of HDS, Three clusters of HDS, Ravens and their correlation with the four Wave behavioural clusters.
Mean SD Correlations with wave
Thought Influence Adaptability Delivery Excitable 51.43 25.66 .02 .02 −.20** −.14 Skeptical 56.94 26.91 .09 .19** −.09 .24** Cautious 44.34 24.17 .04 −.18* −.19** −.08 Reserved 51.24 26.84 .18* −.24** −.17* .06 Leisurely 51.19 26.74 .26** −.03 −.11 .02 Bold 58.22 26.86 .18* .22** .08 .15* Mischievous 58.18 28.59 −.04 .30** .14 .01
Colourful 56.27 27.73 −.07 .58** .23** −.09 Imaginative 54.38 27.40 .19* .14 .16* −.03 Diligent 55.9 26.40 .13 −.12 −.30** .48** Dutiful 54.81 27.62 .09 −.08 .03 −.08 Moving against 227.04 78.47 .09 .44** .21** .01
Moving away 255.13 77.75 .22** −.08 −.25** .04 Moving towards 110.71 38.01 .16* −.14 −.19* .27**
Ravens 50.57 28.1 .15* −.16* .05 −.20**
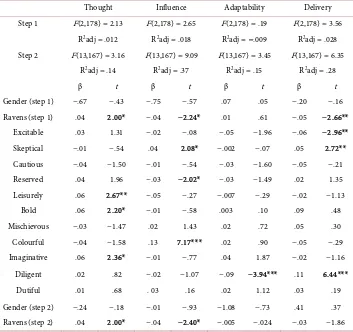
Table 5. Hierarchical regressions with Gender and Ravens entered at step 1 and HDS at step 2 of the four Wave Behavioural clusters.
Thought Influence Adaptability Delivery Step 1 F(2,178) = 2.13 F(2,178) = 2.65 F(2,178) = .19 F(2,178) = 3.56
R2adj = .012 R2adj = .018 R2adj = −.009 R2adj = .028 Step 2 F(13,167) = 3.16 F(13,167) = 9.09 F(13,167) = 3.45 F(13,167) = 6.35
R2adj = .14 R2adj = .37 R2adj = .15 R2adj = .28
β t β t β t β t
Gender (step 1) −.67 −.43 −.75 −.57 .07 .05 −.20 −.16 Ravens (step 1) .04 2.00* −.04 −2.24* .01 .61 −.05 −2.66**
Excitable .03 1.31 −.02 −.08 −.05 −1.96 −.06 −2.96** Skeptical −.01 −.54 .04 2.08* −.002 −.07 .05 2.72** Cautious −.04 −1.50 −.01 −.54 −.03 −1.60 −.05 −.21 Reserved .04 1.96 −.03 −2.02* −.03 −1.49 .02 1.35 Leisurely .06 2.67** −.05 −.27 −.007 −.29 −.02 −1.13
Bold .06 2.20* −.01 −.58 .003 .10 .09 .48 Mischievous −.03 −1.47 .02 1.43 .02 .72 .05 .30 Colourful −.04 −1.58 .13 7.17*** .02 .90 −.05 −.29 Imaginative .06 2.36* −.01 −.77 .04 1.87 −.02 −1.16 Diligent .02 .82 −.02 −1.07 −.09 −3.94*** .11 6.44***
Dutiful .01 .68 . 03 .16 .02 1.12 .03 .19 Gender (step 2) −.24 −.18 −.01 −.93 −1.08 −.73 .41 .37 Ravens (step 2) .04 2.00* −.04 −2.40* −.005 −.024 −.03 −1.86
Note: N = 181, *p < .05, **p < .01, ***p < .001.
In step 2, the HDS explained an additional 12.8% of the variance, with higher values on Leisurely, Bold and Imaginative significantly predicting work behaviours for Thought. Ravens was still a significant predictor suggesting that the high intelligence has a positive relation with Thought. With regards to Influence, an additional 35.2% of variance was explained with both higher values on Skeptical and Colourful but lower values on Reserved significantly predicting work behaviours. Ravens is still a significant predictor suggesting that the high intelligence has a negative relation with Influence. An additional 14.1% of variance was explained with lower values on Diligent signifi-cantly predicting work behaviours for Adaptability. Finally, an additional 25.2% of variance was explained when HDS was added with both higher values on Skeptical and Diligent but lower values on Excitable significantly predicting work behaviours for De-livery. Ravens is no longer a significant predictor suggesting that high intelligence is not as important as the dark side of personality for this cluster.
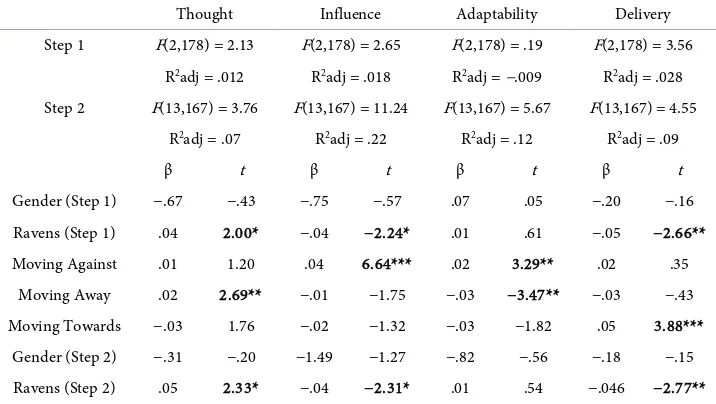
Table 6. Hierarchical regressions with Gender and Ravens entered at step 1 and the three clusters of HDS of the four Wave behavioural clusters.
Thought Influence Adaptability Delivery Step 1 F(2,178) = 2.13 F(2,178) = 2.65 F(2,178) = .19 F(2,178) = 3.56
R2adj = .012 R2adj = .018 R2adj = −.009 R2adj = .028 Step 2 F(13,167) = 3.76 F(13,167) = 11.24 F(13,167) = 5.67 F(13,167) = 4.55
R2adj = .07 R2adj = .22 R2adj = .12 R2adj = .09
β t β t β t β t
Gender (Step 1) −.67 −.43 −.75 −.57 .07 .05 −.20 −.16 Ravens (Step 1) .04 2.00* −.04 −2.24* .01 .61 −.05 −2.66** Moving Against .01 1.20 .04 6.64*** .02 3.29** .02 .35
Moving Away .02 2.69** −.01 −1.75 −.03 −3.47** −.03 −.43 Moving Towards −.03 1.76 −.02 −1.32 −.03 −1.82 .05 3.88***
Gender (Step 2) −.31 −.20 −1.49 −1.27 −.82 −.56 −.18 −.15 Ravens (Step 2) .05 2.33* −.04 −2.31* .01 .54 −.046 −2.77**
Note: N = 181, *p < .05, **p < .01, ***p < .001.
In step 1 of the hierarchical regression, we controlled for gender and intelligence (Ravens) that accounted for 1.2% of variance for work behaviours for Thought, 1.8% for Influence, .9% for Adaptability and 2.8% for Delivery. As above, Ravens was sig-nificant with all clusters but Adaptability, showing a positive relation with Thought but a negative relation with Influence and Delivery.
In step 2, the three clusters of HDS were added and an additional 5.8% of variance was explained with higher order values on moving away from others significantly work behaviours for Thought. Furthermore, Ravens was still a significant predictor suggest-ing that the high intelligence has a positive relation with Thought. An additional 20.2% of variance was explained with higher values on moving against others significantly predicting work behaviours for Influence. Noteworthy is that Ravens is still a signifi-cant predictor suggesting that the high intelligence has a negative relation with Influ-ence. With regards to Adaptability an extra 11.1% of variance was explained with higher values on moving against others but lower values on moving away from others significantly predicting work behaviours. Finally, an additional 6.2% of variance was explained with higher values on moving towards others significantly predicting work behaviours for Delivery. Ravens was still a significant predictor suggesting that the high intelligence has a negative relation with Delivery.
4. Discussion
In-fluence in both analyses. A possible explanation may lie in the relation of intelligence and FFM. More specifically, Thought is based on intelligence and Openness to Experi-ence. Openness to Experience is the most consistent replicated finding that shows by far the strongest link with intelligence (DeYoung, 2011). The meta-analysis of Acker-man and Heggestad (1997) revealed a moderate correlation of .33. Consequently, it is reasonable that intelligence remained significant predictor at Step 2 in both analyses. Influence is based on Extraversion and need for power. According to DeYoung (2011), studies published since 2000 present a weak negative correlation between Extraversion and intelligence (r = −.04), which might explain our finding.
With regards to Delivery, intelligence was a significant predictor in Step 2 only when the three clusters of HDS were entered. A possible explanation might be that since mov-ing towards others contains Diligent, Ravens was influenced by it. Diligent was the most significant scale predicting Delivery. Furthermore, Delivery contains Conscientiousness and need for achievement. Conscientiousness is the best predictor for academic achievement and has a small negative relation with intelligence around −.12 (Moutafi, Furnham, & Crump, 2003;Furnham & Chamorro-Premuzic, 2005). Chamorro-Premuzic and Furnham (2005a) proposed that the high scores in conscientiousness in indivi- duals with lower intelligence is a compensatory mechanism; that is more intelligent people need to be less organised and hard-working because they are more efficient. It is possible that the combination of Conscientiousness and Diligent lead Ravens to be a significant predictor on Delivery.
With regards to the dark side of personality, our findings revealed that high scores on Leisurely, Bold and Imaginative predicted Thought. High scores in Openness to Ex-perience predicted Bold and Imaginative however both Furnham and Crump (2005)
and Furnham et al. (2013) found low scores of Openness to Experience predict Lei-surely where in the current study we found the opposite. A possible explanation might be that Thought is also a combination of three primary sectors and nine dimensions and not such a “clean” measure of Openness.
Influence was predicted by low scores in Reserved and high scores in Skeptical and Colourful. As shown in Table 1, Influence is based on Extraversion and the need for power. Furnham and Crump (2005) and Furnham et al. (2013) found that high scores in Extraversion predicted Colourful and low scores predicted Reserved but they did not find anything for Skeptical. Spain et al. (2013) implied that in HDS, Machiavellianism corresponds to Skeptical. A Machiavellian personality has a need for power; he/she ma-nipulates, lies to and exploits others, in order to satisfy his/her own agenda (Spain et al., 2013;Wu & LeBreton, 2011). Therefore, it is not surprising that high scores in Skeptical predicted Influence.
Crump (2005),and Furnham et al. (2013) found that high scores in Conscientiousness predict Diligent and Skeptical. Furthermore, they found a significant negative correla-tion of Excitable with Conscientiousness. The negative correlacorrela-tion combined with the fact that Delivery has three sections and nine dimensions might justify our finding.
Despite numerous technical and in-house reports as well as the widespread use of the Wave instrument for selection and coaching in the United Kingdom, few studies have looked at its psychometric properties and correlates. This study showed that, on the ba-sis of its theoretical construction it was possible to test and confirm various hypotheses as to the relationship between the four clusters and intelligence and “dark” side traits.
5. Conclusion
The current study, as many others, has some limitations. The most important limita-tion is that the Cronbach’s alpha of the Wave is very low and that the results should be interpreted very carefully. Another limitation is that the age of the participants is un-known which we could not control. Furthermore, the method invariance is problematic with most of the occupational studies (Furnham et al., 2012a). All the measurements were self-reports that lead to two main problems; first there is a tendency of an increase of the reported size of the relations (correlations) and social desirability. Ideally we would have had some objective work performance measure as a criterion.
References
Ackerman, P. L., & Heggestad, E. D. (1997). Intelligence, Personality, and Interests: Evidence for Overlapping Traits. Psychological Bulletin, 121, 219-245.
http://dx.doi.org/10.1037/0033-2909.121.2.219
Barrick, M. R., & Mount, M. K. (1991). The Big Five Personality Dimensions and Job Perform-ance: A Meta-Analysis. Personnel Psychology, 44, 1-26.
http://dx.doi.org/10.1111/j.1744-6570.1991.tb00688.x
Bartram, D. (2005). The Great Eight Competencies: A Criterion-Centric Approach to Validation.
Journal of Applied Psychology, 90, 1185-1203. http://dx.doi.org/10.1037/0021-9010.90.6.1185
Brouwers, S. A., Van de Vijver, F. J. R., & Van Hemert, D. A. (2009). Variation in Raven’s Pro-gressive Matrices Scores across Time and Place. Learning and Individual Differences, 19, 330- 338. http://dx.doi.org/10.1016/j.lindif.2008.10.006
Chamorro-Premuzic, T., & Furnham, A. (2005a). Personality and Intellectual Competence. Mahwah, NJ: Lawrence Erlbaum Associates.
Chatterjee, A., & Hambrick, D. (2007). It’s All about Me: Narcissistic Chief Executive Officers and Their Effects on Company Strategy and Performance. Administrative Science Quarterly, 52, 351-386.
Costa Jr., P. T., & McCrae, R. R. (1990). The NEO Personality Inventory Manual. Odessa, FL: Psychological Assessment Resources.
DeYoung, C. G. (2011). Intelligence and Personality. In R. J. Sternberg, & S. B. Kaufman (Eds.),
The Cambridge Handbook of Intelligence (pp. 711-737). New York: Cambridge University Press. http://dx.doi.org/10.1017/CBO9780511977244.036
Furnham, A. (2008). Personality and Intelligence at Work. London: Routledge.
Furnham, A., & Chamorro-Premuzic, T. (2005). Personality, Intelligence, and Art. Personality and Individual Differences, 36, 705-715. http://dx.doi.org/10.1016/S0191-8869(03)00128-4
Furnham, A., & Crump, J. (2005). Personality Traits, Types and Disorders: An Examination of the Relationship between Three Self-Report Measures. European Journal of Personality, 19,
167-184. http://dx.doi.org/10.1002/per.543
Furnham, A., & Trickey, G. (2011). Sex Differences in the Dark Side Traits. Personality and Indi-vidual Differences, 50, 517-522. http://dx.doi.org/10.1016/j.paid.2010.11.021
Furnham, A., Crump, J., & Ritchie, W. (2013). What It Takes: Ability, Demographic, Bright and Dark Side Trait Correlates of Years to Promotion. Personality and Individual Differences, 55,
952-956. http://dx.doi.org/10.1016/j.paid.2013.07.469
Furnham, A., Hyde, G., & Trickey, G. (2012a). Bright Aspects to Dark Side Traits: Dark Side Traits Associated with Work Success. Personality and Individual Differences, 52, 908-913.
http://dx.doi.org/10.1016/j.paid.2012.01.025
Furnham, A., Hyde, G., & Trickey, G. (2012b). Do Your Dark Side Traits Fit? Dysfunctional Per-sonalities in Different Work Sectors. Applied Psychology,63, 589-606.
http://dx.doi.org/10.1111/apps.12002
Furnham, A., Hyde, G., & Trickey, G. (2014). The Dark Side of Career Preference: Dark Side Traits, Motives and Values. Journal of Applied Social Psychology, 44, 106-114.
http://dx.doi.org/10.1111/jasp.12205
Hogan, R., & Hogan, J. (2001). Assessing Leadership: A View from the Dark Side. International Journal of Selection and Assessment, 9, 40-51. http://dx.doi.org/10.1111/1468-2389.00162
Hogan, R., & Hogan, J. (2009). Hogan Development Survey Manual (3rd ed.). Tulsa, OK: Hogan Assessment Systems.
Hurtz, G. M., & Donovan, J. J. (2000). Personality and Job Performance: The Big Five Revisited.
Journal of Applied Psychology, 85, 869-879. http://dx.doi.org/10.1037/0021-9010.85.6.869
Jayne, S., Small, C., & Oxley, H. (2006). Wave Focus Organisational Feedback Report. Total Standardisation Pilot Group. Jersey (UK): Saville Consulting Group.
Judge, T. A., Higgins, C. A., Thoresen, C. J., & Barrick, M. R. (1999). The Big Five Personality Traits, General Mental Ability, and Career Success across the Life Span. Personnel Psychology, 52, 621-652. http://dx.doi.org/10.1111/j.1744-6570.1999.tb00174.x
Khoo, H., & Burch, G. (2008). The “Dark Side” of leadership Personality and Transformational Leadership. Personality and Individual Differences, 44, 86-97.
http://dx.doi.org/10.1016/j.paid.2007.07.018
Kline, P. (1999). The Handbook of Psychological Testing (2nd ed.). London: Routledge. McDowall, A., & Kurz, R. (2007). Making the Most of Psychometric Profiles—Effective
Integra-tion into the Coaching Process. International Coaching Psychology Review, 2, 299-309. Moutafi, J., Furnham, A., & Crump, J. (2003). Demographic and Personality Predictors of
Intel-ligence: A Study Using the NEO-Personality Inventory and the Myers-Briggs Type Indicator.
European Journal of Personality, 17, 79-94. http://dx.doi.org/10.1002/per.471
Race, M.-C., Hyde, G., & Furnham, A. (2012). Dark Side Traits and Promotion at Work: What Gets You up the Greasy Pole? Manuscript under review.
Raven, J., Raven, J. C., & Court, J. H. (1998). Raven Manual: Section 4, Advanced Progressive Matrices, 1998 Edition. Oxford, UK: Oxford Psychologists Press Ltd.
Rojon, C., & McDowall, A. (2010). Cultural Orientation Framework (COF) Assessment Ques-tionnaire in Cross-Cultural Coaching: A Cross-Validation with Wave Focus Style. Interna-tional Journal of Evidence Based Coaching and Mentoring, 8, 1-26.
Saville Consulting (2005). Saville Consulting Wave. Technical Document. Jersey, UK: Saville Consulting Group.
Schmidt, F. L., & Hunter, J. E. (2004). General Mental Ability in the World of Work: Occupa-tional Attainment and Job Performance. Journal of Personality and Social Psychology, 86, 162- 173. http://dx.doi.org/10.1037/0022-3514.86.1.162
Spain, S. M., Harms, P., & Lebreton, J. M. (2013). The Dark Side of Personality at Work. Journal of Organizational Behaviour, 35, S41-S60. http://dx.doi.org/10.1002/job.1894
Wu, J., & LeBreton, J. M. (2011). Reconsidering the Dispositional Basis of Counterproductive Work Behavior: The Role of Aberrant Personality Traits. Personnel Psychology, 64, 593-626.
http://dx.doi.org/10.1111/j.1744-6570.2011.01220.x
Appendix
The four clusters of Wave containing the 12 sections and the 36 dimensions.
Cluster Section Dimension
Thought Evaluative Analytical Factual Rational
Investigative Practically minded Learning oriented Insightful
Imaginative Inventive Abstract Strategic
Influence Sociable Interactive Engaging Self-promoting
Impactful Convincing Articulate Challenging
Assertive Purposeful Directing Empowering
Adaptability Resilient Self-assured Composed Resolving
Flexible Change oriented Positive Receptive
Supportive Involving Attentive Accepting
Delivery Conscientious Meticulous Reliable Conforming
Structured Principled Organised Activity oriented
Submit or recommend next manuscript to SCIRP and we will provide best service for you:
Accepting pre-submission inquiries through Email, Facebook, LinkedIn, Twitter, etc. A wide selection of journals (inclusive of 9 subjects, more than 200 journals)
Providing 24-hour high-quality service User-friendly online submission system Fair and swift peer-review system
Efficient typesetting and proofreading procedure
Display of the result of downloads and visits, as well as the number of cited articles Maximum dissemination of your research work
Submit your manuscript at: http://papersubmission.scirp.org/