Munich Personal RePEc Archive
Local taxes in Buenos Aires City: A
CGE approach
Chisari, Omar Osvaldo and Mastronardi, Leonardo Javier
and Romero, Carlos Adrián
Instituto de Economía UADE
30 April 2012
Online at
https://mpra.ub.uni-muenchen.de/40029/
L
OCAL TAXES IN
B
UENOS
A
IRES
C
ITY
:
A COMPUTABLE
GENERAL EQUILIBRIUM APPROACH
Mastr onar di, Leonar do J. Instituto de Economía UADE and CONICET
Romer o, Car los A. Instituto de Economía UADE
Chisar i, Omar O.
Instituto de Economía UADE and CONICET
Abstr act:
The aim of this paper is to analyze the spillover effects of national and local tax policies using a static bi-r egional gener al equilibr ium model for the Buenos Air es City (BAC) and the r est of Ar gentina. The BAC r epr esents 7% of the population of the countr y, but 29% of its GDP.
We analyze the r ecipr ocal impact of fiscal policies on w elfar e of pr ivate agents and the spillover effects on the per for mance of the public sector of both r egions. As expected, the model show s that national fiscal policies do have r elevant effects on the activity level of the city and on the w elfar e of its inhabitants. How ever , mor e unexpectedly, it also show s that fiscal decisions at the level of the city have a significant impact on the r est of the countr y.
The r esults show that: (i) an incr ease in BAC local taxes pr oduce a decline in the w elfar e of households and in the activity levels, in both r egions; (ii) an incr ease in national value added tax decr eases the r egional GDP in both r egions, but in differ ent pr opor tions, and incr eases the r egional unemployment r ate. The r esults differ depending on the type of tax (sales or pr oper ty). Pr oduction elasticities and the r ule of indexation of w ages ar e key factor s that affect the quantitative and qualitative r esults.
JEL: C68, D58, H77
1.
I
NTRODUCTI ONIn r ecent year s, the computable gener al equilibr ium (her eafter CGE) models for
differ ent r egions have become an impor tant ar ea of r esear ch in economics. Ther e ar e
sever al examples of applied CGE models in the liter atur e. To analyze fiscal feder alism
impacts in Andalusia (Spain), Car denete (2009) built a bi-r egional static CGE model for
that r egion; also Car denete and Sancho, developed static r egional CGE model to study a
fiscal r efor m of an income tax (2001) and the impact of national tax changes (2002).
Hor r idge (1999) uses a dynamic multi-r egional gener al equilibr ium model to explor e the
effects of an incr ease in population and the r ise in tr anspor t costs in ur ban ar eas of
Austr alia. Nakayama and Kaneko (2003) constr ucted a dynamic CGE to explain mar ket
tr ading of goods, ser vices, capital and labor in ur ban and r ur al ar eas in Shanghai and
Beijing (China).
This paper pr esents the r esults of a static bi-r egional gener al equilibr ium model for
Ar gentina, pr epar ed to simulate r egional fiscal policies. We separ ate Ar gentina in tw o
r egions, Buenos Air es City (her eafter BAC) and the r est of the countr y (her eafter ROC).
This is the fir st r egional CGE model for the countr y that takes into account the city of
Buenos Air es. We analyze the r ecipr ocal impact of fiscal policies on w elfar e of pr ivate
agents and the spillover effects on the per for mance of the public sector of both r egions. As
expected, the model show s that national fiscal policies do have r elevant effects on the
activity level of the city and on the w elfar e of its inhabitants. How ever , mor e unexpectedly,
it also show s that fiscal decisions at the level of the city have a significant impact on the
r est of the countr y. This is the fir st r egional CGE model for Buenos Air es City.
Since an Input-Output Tables for Buenos Air es City w as not available, substantial
w or k w as necessar y to separ ate the national accounts into tw o specific r egional account
systems. That w as a necessar y stage, w hich w as follow ed by the constr uction of the model
itself (see also Mastr onar di, Romer o and Chisar i, 2012).
The r egional r epr esentation must take into account not only the location of
pr oduction activities, but also that of the households w ho ar e entitled to r eceive the
r emuner ation of factor s of pr oduction as w ell as w her e they make their expenses. This is
r elevant to deter mine the gener al equilibr ium effects of tax policies since the place w her e
income is gener ated can be differ ent fr om the place w her e consumption is r ealized.
Mor eover , additional effor t w as necessar y to estimate the distr ibution of ow ner ship of
The model has ten sector s of activity and tw o types of household (r ich and poor ) in
each r egion. Mor eover , it includes an exter nal sector (that tr ades separ ately w ith each
r egion), a local gover nment for BAC that makes decisions of local fiscal policy in BAC
r egion and a national gover nment that deter mines the national fiscal policy and local fiscal
policy in the r est of the countr y.
We intend to study r egional differ ences in ter ms of w elfar e and pr ofit mar gin in
changes on fiscal policy. The idea is to measur e the w inner s and loser s w hen the centr al
gover nment changes its policies (mainly taxes for Buenos Air es and the r est of the
countr y), or w hen local gover nment changes their tax policies. Ther efor e, w e use the
r egional CGE model to evaluate the impacts looking for potential spillover s gener ated in
the other r egion. We analyze specially the effects of changes in impor tant taxes of the
countr y like r egional tur nover tax (called “Ingr esos Br utos”) or other r egional taxes
(decided by local gover nments) and national value added tax, national impor t tar iffs or
national factor s taxes (decided by national gover nment).
The model is constr ucted on a MPSGE platfor m and it is based on a pr evious w or k of
the author s (e.g. Chisar i et . al. (2010)).
The paper is or ganized as follow s. Fir st, in section 2, the paper show s calibr ation
methods to compute the RSAM. Secondly, in section 3, w e pr esent the multir egional
computable gener al equilibr ium model and thir dly, fiscal policy scenar ios ar e pr esented in
section 4. Finally, in the section 5 w e pr esent conclusions based on the r esults of the
pr eliminar y model.
Socio-Economic char acter istics of Buenos Air es
In 1994, BAC became me an autonomous city of Ar gentina, changing its institutional
status. It has an appr oximated ar ea of 202 squar e kilometer s and thr ee million inhabitants
that r epr esents the 7.2% of the Ar gentina population. It is the thir tieth ur ban ar ea w ith
r espect to the mar ket size and the best city of Latin Amer ica in ter ms of life quality1. The
r egional Gr oss Domestic Pr oduct (her eafter GDP) of BAC is about 60 billions of dollar s and
it r epr esented about 29% of Ar gentina’s GDP at mar ket pr ices of 2006, the 39% of
Ar gentina’s consumption and only 1% of Ar gentinean expor ts2. Mor eover , Buenos Air es is
the r ichest r egion of the countr y w ith a GDP per capita of U$20,000, w hen the aver age of
Ar gentina is about U$6,500.
1 See Minister io de Desar r ollo Económico (2009).
Table 1 – BAC and ROC r elative shar es in ter ms of Ar gentinean indicator (In millions of Ar gentinean Pesos)
I ndicator BAC ROC Ar gentina
Population 0.07 0.93 40,117,096
GDP * 0.29 0.71 654,439
Consumption 0.39 0.61 465,429
Investment 0.20 0.80 152,838
Expor ts** 0.01 0.99 162,035
Sour ce: Instituto Nacional de Estadísticas y Censos and Dir ección Gener al de Estadística y Censos (Minister io de Hacienda GCBA). *At mar ket pr ices of 2006. ** Only expor ts of goods have been computed for BAC.
As r egar ds gover nments, Table 2 examines the sour ce of r evenues of BAC
gover nment using local taxes and the sour ce of r evenues of national gover nment, w hich
collect national taxes in ever y r egion and local taxes in the ROC. The taxes on sales ar e the
89% of BAC gover nment r evenues (tur nover local taxes –Ingr esos Br utos- ar e the 72% of
total). Value added tax (VAT) has an impor tant shar e in BAC (45%) w hen w e see the final
consumption (objective of the tax). When w e examine the other taxes on sales, ROC pays
75% of it. This happened because of expor ts pr oper ties, because ROC expor ts the 99% of
total expor ts. If w e compar e the taxes collected in households, w e obser ve that the 7.2% of
the population pay the 43% of national taxes on households.
Table 2 – Sour ces of r evenues for both gover nments. In shar es of total and in millions of Ar gentinean pesos.
Region share Str uctur e I ndicator
BAC ROC BAC ROC
Revenues of National Taxes ( Millions AR$) 53,271 104,404 1.00 1.00
VAT 0.452 0.548 0.33 0.20
Other Sales taxes 0.254 0.746 0.42 0.63
Households 0.434 0.566 0.26 0.17
Revenues of Local Taxes ( Millions AR$) 6,169 19,759 1.00 1.00 Tur nover taxes (Ingr esos Br utos) 0.238 0.762 0.72 0.71 Other Sales taxes 0.241 0.759 0.17 0.16 Taxes on Households 0.243 0.757 0.11 0.13
Sour ce: INDEC and Minister io de Hacienda (GCBA).
In r elation to the job mar ket, BAC has many commut er s fr om Gr eat Buenos Air es (her eafter GBA). GBA is the name to call the subur bs of BAC (See Figur e 1). It has
appr oximately ten (10) million inhabitants (25% of Ar gentina’s population) and is par t of
[image:5.612.126.486.450.542.2]Figur e 1. BAC and GBA
BAC GBA
Argentina
Metropolitan Area
BAC GBA BAC
GBA BAC
GBA
Argentina
Metropolitan Area
The migr ation flow betw een BAC and the r est of the r egion is an impor tant pr oblem
for the economic modeling due to the fact that w her e the people w or k, w her e the people
live and in w hich pr opor tion that people consume and invest in each r egion must be
separ ated. At this point, Table 3 pr esents statistics of occupied people in the metr opolitan
[image:6.612.165.465.79.284.2]ar ea (BAC and GBA). It differ entiates w her e people w or k and w her e people live.
Table 3 – The occupied people in BAC and GBA
People working at
BAC GBA Both
BAC 1,210,089 178,787 65,023 People living at
GBA 908,808 2,939,740 177,411
Sour ce: Encuesta Per manente de Hogar es (INDEC)
Table 3 has show n that commut er s r epr esent a r elevant per centage (24.2%) of people. Additionally, about 4.5 million people w or k in the r est of the countr y (excluding
GBA).
2.
D
ATABASE AND CALI BRATI ON:
T
HE REGI ONAL SOCI AL ACCOUNTI NGM ATRI X
( RSAM)
FORBAC
The basic data for the model ar e obtained fr om a r egional social accounting matr ix
(RSAM) that in this case also isolates sector s differ entiating the ar ea of doing business.
Her e w e summar ize the most cr itical aspects of data collection and tr eatment. The
Ar gentinean initial matr ix of national inter mediate pur chases is based on the 1997 data
[image:6.612.165.447.406.469.2]Regional input-output tables can be separ ated in intr ar egional flow s and
inter r egional ones. The key of the estimation is the infor mation availability. Unfor tunately,
ther e is not a census or other r egional stats (sur vey methods) that can be used to compar e
w ith national data. Then w e used tw o methodological complement ar y pr ocedur es to
obtain the inter mediate pur chases at r egional level. Accor dingly, hybr id and non-sur vey
methods w er e used to build these tables. An estimation of inter r egional and intr ar egional
flow s for ten pr incipal sector s is used in each r egion follow ing the available r esults on
Mastr onar di and Romer o (2012) and Mastr onar di, Romer o and Chisar i (2012).
Ther efor e to measur e an intr ar r egional coefficients for each r egion w e based our
estimations on non-sur vey techniques such as Location Quotients (especially the
Augmented Flegg’s Location Quotient –AFLQ-) follow ing Jensen et al. (1978) and Flegg and
Webber (1996a, 1996b, 1997 and 2000). Tw o common alter native w ays to balance
r egional input-output tables, the RAS and the Cr oss Entr opy Method, have been adapted to
estimate inter r egional coefficients.
The distr ibution of the factor income acr oss income gr oups is based on the
distr ibution obser ved in Ar gentina in 2006 accor ding to household income sur veys3.
Households offer their endow ments to the r egions in the factor mar ket, i.e. BAC household
offer labor and capital to BAC sector s and ROC sector s.
The distr ibution of the consumption basket per type of goods and ser vices is based
on aggr egates fr om a new household consumption sur vey for 2005. To model the r egional
impor ts/ expor ts of consumption, a r epr esentative tour ism bundle w as constr ucted on the
basis of available data of National Secr etar y of Tour ism and local data of Buenos Air es City
Gover nment. This bundle includes consumption of commer ce, tour ism, tr anspor tation and
other pr ivate ser vices.
In both cases, the factor income distr ibution and the household consumption (acr oss
the sector s), consistent data on consumption and factor ial incomes w er e obtained thr ough
cr oss-entr opy method (Robinson, Cattaneo y El-Said, 2001). As for the gover nment
expenses distr ibution betw een goods and ser vices, data ar e available for 2006 for the
national and pr ovincial gover nments. Aggr egate demand and supply in the SAM ar e
consistent w ith national and r egional accounts.
Infor mation on the gover nment accounts w as obtained fr om the Ministr y of the
Economy (Oficina Nacional de Pr esupuesto). Income and expenditur es of the public sector
3 To be mor e pr ecisely w e use the household sur vey (EPH pr ovided by INDEC) to separ ate r egional incomes
ar e consolidated r esults for the feder al administr ation, the pr ovinces and the
municipalities for the r est of countr y (ROC). For BAC w e calculate the gover nment size in
the public consolidated r esults based on the BAC gover nment expenditur es. Consider ing
expenditur es, gover nment consumption r epr esents ar ound 14% of GDP follow ed by
household tr ansfer s (10% of GDP). The “Administr ación Feder al de Ingr esos Públicos”,
“Dir ección Gener al de Estadística y Censos” (BAC gover nment) and Pr ovincial ministr ies,
r espectively pr ovided the infor mation on national and local taxes.
The model includes 10 pr oduction sector s, one for agr icultur e and pr imar y
activities, one for goods and eight for ser vices.
Tw o factor s of pr oductions ar e accounted for labor and physical capital. Both factor s
ar e divided in r egional ter ms (BAC labor , BAC capital, ROC labor and ROC capital). In this
paper , the labor is mobile acr oss r egional sector s w hile physical capital is r egional sector
specific.
Table 4 pr esents par ticipation of each sector in ter ms of value added, expenses in
[image:8.612.118.497.379.552.2]inputs and gr oss output. These sector s ar e disaggr egated in our complete RSAM.
Table 4: Value added in Ar gentina (2006). Distr ibution and str uctur e among r egions.
Region distr ibution Region str uctur e Sector s
BAC ROC BAC ROC
Pr imar y sector 0.06 0.94 0.03 0.19
Manufactur es 0.24 0.76 0.17 0.21
Electr icity, water and gas 0.22 0.78 0.01 0.02
Constr uction 0.24 0.76 0.05 0.06
Commer ce 0.24 0.76 0.10 0.13
Restaurants and Hotels 0.47 0.53 0.05 0.02
Tr anspor t and communication 0.39 0.61 0.12 0.07 Financial inter mediation 0.56 0.44 0.10 0.03
Real estate and business 0.51 0.49 0.21 0.08
Public sector and other private ser vices 0.25 0.75 0.17 0.19
Total 0.28 0.72 1.00 1.00
Sour ce: Instituto Nacional de Estadísticas y Censos and Dir ección Gener al de Estadística y Censos (Minister io de Hacienda GCBA).
Table 4 has show n that BAC is mor e specialized on ser vices sector s, especially in
“Financial inter mediation and Real estate and business”. Other impor tant sector s in their
str uctur e ar e “Tr anspor t and communication”, and “Public sector and other pr ivate
ser vices”. On the other hand, ROC is mor e specialized on “Pr imar y sector ”, “Manufactur es”
The RSAM also accounts for the positive r esult of the tr ade balance and the cur r ent
account obser ved in 2006. The infor mation on the balance of payments w as obtained fr om
the “Banco Centr al de la República Ar gentina”.
A summar y of the RSAM of the Ar gentine r egional economy of 2006 is show n in
Table 5. This simplified RSAM has activity sector s of each r egion, tw o factor s, national
taxes, local taxes, public and pr ivate investment and the r est of the w or ld (ROW). Columns
show the decomposi tion of sales of the budget of ever y agent, w hile r ow s r epr esent
mar kets.
The r egional input-output matr ix is the sub-matr ix of the RSAM that r epr esents
tr ansactions betw een activity sector s (activities, activities). Below this, the matr ix of factor
demands is pr esented (factor s, activities), follow ed by the matr ix of taxes (national and
local ones) paid by activity (taxes, activities). The RSAM separ ates taxes paid by expor ts,
inter mediate uses, final consumption and investments. Finally, the vector of impor ted
pur chases is included (ROW, activities)4. Totals of r ow s and columns of each sector ar e the
[image:9.612.99.536.373.567.2]r espective gr oss output value.
Table 5: Aggr egated RSAM for Ar gentina (2006)
BAC sector s
ROC
Sector s Factor s Taxes BAC HH ROC HH BAC
Gov ROC Gov Pr ivate Investment
Public
Investment ROW Total
BAC Sector s 63,572 45,061 161,702 2,844 3,309 19,248 2,787 964 299,487 ROC Sector s 39,104 383,427 4,114 185,095 77,938 82,226 11,904 161,072 944,881 Factor s 140,341 354,100 494,441
Local taxes 5,491 17,263 677 2,496 25,928
National
Taxes 39,267 84,228 9,540 10,892 143,927
Customs
taxes 357 2,352 2,944 3,330 4,765 13,748
BAC HH 99,084 703 99,787 ROC HH 387,367 61,271 448,638 BAC Gov. 6,169 803 6,971 ROC Gov. 177,434 177,434 Investment 27,927 108,892 2,787 11,904 1,328 152,838 ROW-BAC 11,354 2,583 11,332 7,786 33,055 ROW-ROC 58,450 5,407 12,820 24,121 100,798 Sur plus 0 0 0 0 118,448 -122,268 -173 -25,518 0 0 29,511 0 Total 299,487 944,881 494,441 183,603 218,235 326,370 6,799 151,916 138,147 14,691 163,363
Note: BAC: Buenos Air es City; ROC: Rest of the Countr y; HH: Household; Gov: Gover nment; ROW: Rest of the Wor ld
Sour ce: Our estimations based on INDEC, BCRA, AFIP, BAC gover nment data and other s.
The factor s account show s the income distr ibution matr ix (households, factor s), that
distr ibutes the r emuner ation of factor s to households. Par t of the capital is ow ned by the
r est of the w or ld (ROW, factor s).
4 An impor tant issue is that impor ts ar e consider ed in our model as a composite good. It implies that the
For the demand side, w e summar ize the matr ix of r egional household expenditur es
(activities, households), r egional gover nment consumption (activities, gover nment),
pr ivate and public r egional investments (activities, investments) and the vector of expor ts
(activities, ROW). The matr ices (households, households) and (households, gover nment)
cor r espond to tr ansfer s betw een agents.
Pr ivate savings, public savings and for eign savings ar e added up to finance
investments. The r ow sur plus closes the model and it r epr esents the super avit/ deficit of
ever y agents; it cor r esponds to financial tr ansactions as of 2006. For households this
sur plus is a “bond” that closes the income constr aint. For the final model, w e w ill model
better the tr ansfer s because the amount of super avit/ deficit of households is ver y big.
ROC gover nment (national and pr ovinces excluding BAC) has a super avit of 25.518
millions of Ar gentinean pesos and BAC gover nment has a deficit (after copar ticipation
bond of 803 millions of Ar gentinean pesos) of 173 millions of Ar gentinean pesos. The
ROW has a deficit of 29.511 millions of Ar gentinean pesos w hich indicates the super avit of
Ar gentinean tr ade balance in 2006.
3.
C
HARACTERI STI CS OFC
OM PUTABLEG
ENERALE
QUI LI BRI UMM
ODELThe agents of the model ar e tw o r epr esentative households (r ich and poor ) and ten
pr oduction sector s in each r egion, tw o consolidated public sect or s (BAC gover nment and
ROC gover nment –national and the r est of pr ovinces-) and the r est of the w or ld. Each
pr oduction sector pr oduces one good, using inter mediate inputs (of the r egion or
impor ted fr om the other r egion or fr om abr oad) and factor s of pr oduction of the r egion
(assumed not mobile for this ver sion). Goods (both for final and inter mediate use) ar e
differ entiated by r egion (though w e consider differ ent degr ees of substitutability using
nested utility and pr oduction functions). The model is flexible to addr ess differ ent
elasticities and par ameter s, as w ell as differ ent degr ees of factor mobility. In addition,
differ ent mobility of factor s can be taken into account in the model; this is r elevant for
capital w hich is taken as fix among the sector s5. A descr iption of the model is pr esented in
Appendix A.
Ther e is a detailed decomposition of fiscal sour ces of r evenue, since they ar e key for
the subject of the paper . Ther efor e, ther e is a thor ough r epr esentation of the cr edit and
debits compensations in the VAT.
5 This is the consequence of pr eliminar y r esults. Futur e r esear ch lines w ill include a fraction of mobile capital
Our CGE model has all basic pr oper ties of the Walr asian per spective, and it is
numer ically solved using GAMS/ MPSGE6. It allow s simulating the economy-w ide impacts
of fiscal feder alism in both r egions.
It is possible to estimate r egional differ ences in ter ms of w elfar e and levels of
activity in changes on fiscal policy. The idea is identify w inner s and loser s of tax r efor ms
and spillover betw een r egions. Subsequent modifications in r elative pr ices and the
r esponse of activity levels due to elasticities of substitution and mobility of r esour ces can
explain w hy cer tain industr ies and technologies expand or contr act
Except for w ages (since ther e is a disequilibr ium in the labor mar ket for the
benchmar k year 2006), pr ices ar e computed to simultaneously clear all mar kets. The
model used is a static ver sion of the Computable Gener al Equilibr ium for Ar gentina
pr esented in Chisar i et al. (2010).
On the supply side, the pr oduction function in each sector is a Leontief function
betw een value added and inter mediate inputs. The inter mediate inputs function is also a
Leontief function of all goods, w hich ar e str ict complements in pr oduction. Instead, value
added is a Cobb-Douglas function of factor s of pr oduction (labor and capital specific of the
r egion).
Thus, the output x fr om a r egion i is pr oduced w ith inter mediate consumption added value. Inter mediate consumption is r epr esented as a nested Leontief pr oduction function.
The goods and ser vices ar e complementar y and the elasticity of substitution betw een
them is zer o. Value added is r epr esented as a Cobb-Douglas function. The coefficients
associated for each factor ar e their shar e of par ticipation in the output. Figur e 2 show s the
str uctur e of pr oduction.
6 The solution of the model is obtained using the r epr esentation of Gener al Equilibr ium and using the Mixed
Figur e 2: Str uctur e of pr oduction
Output
Added Value Inputs
Labor Capital National Inputs For eign Inputs
Inputs fr om regioni Inputs fr om regionj Level 1 Level 2 Level 3 Leontief Leontief Leontief Cobb-Douglas Output
Added Value Inputs
Labor Capital National Inputs For eign Inputs
Inputs fr om regioni Inputs fr om regionj Level 1 Level 2 Level 3 Output
Added Value Inputs
Labor Capital National Inputs For eign Inputs
Inputs fr om regioni Inputs fr om regionj Level 1 Level 2 Level 3 Leontief Leontief Leontief Cobb-Douglas
The demand side is modelled w ith four r epr esentative households (tw o in each
r egion divided by income), a national consolidated gover nment, a local gover nment of BAC
and an exter nal sector . Households have Cobb-Douglas utility functions and they buy or
sell goods and investment goods. The choice of the optimal pr opor tion of the consumption
good is obtained fr om a nested pr oduction function into the utility function, thr ough a
pr ocess of cost minimization.
Figur e 3: Str uctur e of final consumption
Final consumption
For eign goods Cobb
-Douglas
Intr ar egional goods Inter egional goods
Final consumption
For eign goods Cobb
-Douglas
Intr ar egional goods Inter egional goods
Each gover nment is r epr esented as an agent that par ticipates in mar kets for
investments, consumes and makes tr ansfer s to households and has a Cobb-Douglas utility
function; its main sour ce of income is tax collection (though it also makes financial
tr ansactions thr ough the bonds account).
The exter nal sector buys domestic expor ts and sells impor ts in each r egion, and
collects dividends fr om investments, and also makes tr ansactions of bonds. This implies
that as of the closur e r ule, ther e is not tr ade balance and ther e ar e financial compensator y
movements of capitals. Though it could be inter esting to analyze the r esults under tr ade
balance, the National Accounts of Ar gentina show ed that the countr y w as still r epaying
debt at the benchmar k year ; so the model w as calibr ated to that case (i.e. for the
simulations, the gover nment cannot issue new debt and the tr ade balance must be positive
[image:12.612.113.496.82.256.2] [image:12.612.193.439.409.486.2]Households decision on the composition of their basket of goods is r epr esented
similar ly to output str uctur e (see Figur e 3). We adopted a nested utility function w ith an
elasticity of substitution equal to 1 (Cobb-Douglas function) betw een goods though the
r egions and impor ted goods.
Regar ding factor endow ments, capital is fully employed, w hile ther e exist eight labor
endow ments (endow ment of labor for r egion I of household H). That is, at the benchmar k
it w as obser ved that households of BAC and ROC w er e supplying labor in the other r egion,
so an endow ment of labor used in BAC w as attr ibuted to ROC households and r ecipr ocally.
Fir ms of BAC r egion use labor of BAC, w hich is supplied both by households of BAC
and fr om ROC. For this ver sion, it w as assumed that households cannot tr ansfor m the
endow ment of labor specific of a r egion into labor used in the other (though this can be
accommodated via the constr uction of an aggr egate of labor w ith differ ent elasticities of
tr ansfor mation).
The modeling of unemployment is quite impor tant for the case of Ar gentina. The
assumption of full-employment could modify the evaluati on of benefits of tr ade
liber alization (see Diao et al. 2005) for in full-employment models, incr eased demand for labor (fr om incr eased activity and expor ts) leads to higher r eal w ages, such that the or igin
of compar ative advantage is pr ogr essively er oded; but in models w ith unemployment, r eal
w ages ar e constant and expor ts incr ease is higher . An impor tant issue of the model is that
includes differ ent unemployment r ates among the r egions.
4.
R
ESULTS OF SI M ULATI ONSIn this section, main r esults fr om four tax policy simulations ar e pr esented in ter ms
of impacts on r eal GDP, r eal investment, r eal pr ivate and public consumption (at r egional
and national level) and impacts on employment, activity level, w elfar e of the gover nment
and of differ ent household categor ies at r egional level. The r esults of simulations ar e
measur ed as deviations fr om the base calibr ation data7.
The tax policy simulations ar e the follow ing:
1. Incr ease in BAC local sales taxes (10%).
2. Incr ease all taxes (national and local ones) in both r egions (10%).
3. Incr ease local taxes on Households of BAC (10%).
7 The unemployment rate for BAC calibr ation w as 9.10% and for ROC calibr ation w as 11.40%. Data w as
4. Incr ease of national VAT (both r egions) (10%).
As w e mentioned befor e, w e w ant to analyze the spillover effects of national and
local tax policies. Since the r esult can be sensitive to the r ule of indexation of w ages under
unemployment, in the subsection 4.1 w e w ill focus on the case of nominal w ages (her after
scenar io i.) and explor e w hat happens w hen w ages follow some r ule of indexation in the
subsection 4.2.
4.1. Spillover effects under nominal wages.
Table 6 show s the r esults of the simulation for the case of minimum nominal w ages.
We obser ve that w hen BAC changes her tax policy it has a negative effect on the r est of
Ar gentina (see r esults fr om simulation 1). In addition, w hen the national gover nment
changes the taxes str uctur e (as w e see on simulations 2 and 4), BAC r egion suffer s
negative spillover s and it is mor e affected than ROC r egion.
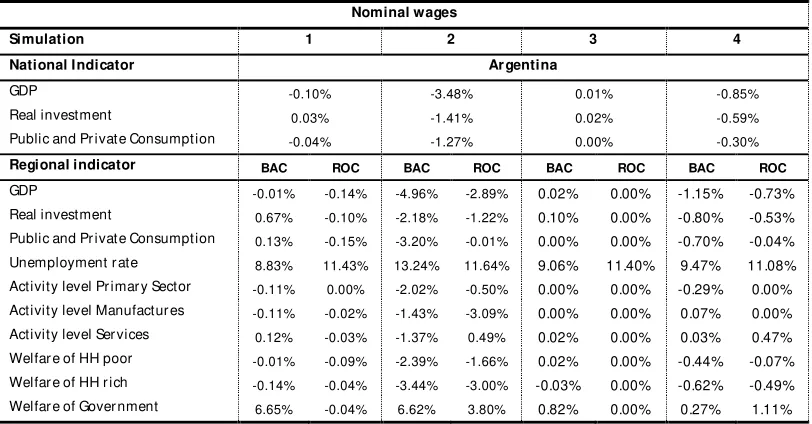
When w e focus in the r esults fr om the fir st simulation, w e can see that the BAC’s
GDP r ises less than ROC’s GDP so it can be said that this policy of BAC taxes is detr imental
in ROC r egion. The tax incr ease augments investments, local employment and gover nment
w elfar e in the r egion but it decr eases the activity level of pr imar y sector and manufactur es
and the households w elfar e in the r egion and w or sens all the indicator s of ROC. At
national level, w e obser ve that the policy decr eases r eal GDP, investment and
[image:14.612.104.510.470.682.2]consumption.
Table 6: Results fr om tax policy simulations using nominal w ages indexation.
Nominal wages
Simulation 1 2 3 4
National Indicator Ar gentina
GDP -0.10% -3.48% 0.01% -0.85%
Real investment 0.03% -1.41% 0.02% -0.59%
Public and Pr ivate Consumption -0.04% -1.27% 0.00% -0.30% Regional indicator BAC ROC BAC ROC BAC ROC BAC ROC
An incr ease of taxes on sales in BAC r egion gener ates a r ise in r elative ter ms of the
activity level of the constr uction sector (pr incipal component of investment) and public
ser vice and other ser vices.
This explains the positive effect on the r eal investment in BAC, this helps also to
decr ease the r ate of unemployment in BAC.
In addition, the incr ease in the BAC taxes (and the impossibility of substitutability on
the inputs) incr eases input pr oducer pr ices in both r egions. Hence, for the Ar gentinean
economy ther e is an incr ease of expor t costs and consequently ther e is a deter ior ation of
tr ade sur plus (also explained by the r eduction of the r elative cost of impor ts).
This explains the negative spillover effect on the GDP, investment and consumption
in ROC.
On the fiscal side, the BAC gover nment is better because of the additional r evenue
that compensates scale effects. ROC gover nment instead is w or se because its r evenue falls
due to the decr ease on the activity level of the sector s and pr inci pally on the expor ts.
Fr om the second simulation, w e conclude that an incr ease in all taxes in the
economy pr oduces negative spillover s for BAC r egion. This is because BAC agents pay
higher costs in the for m of additional taxes that ar e collected by ROC national gover nment.
Consistently, the decline of w elfar e of ROC household is less than BAC household. It
is a consequence of the gr eater incr ease (4%) on the BAC‘s unemployment r ate that hur ts
the w elfar e of the BAC’s household. Both gover nments ar e better because the incr ease on
the r evenue allow s an incr ease on the public consumption and investment.
When w e analyze the thir d simulation, gener al equilibr ium effects ar e not significant
because an incr ease on BAC’s household taxes only gener ates ver y low income effects and
small or negligible cr ow ding out effects on the r eal investment. The BAC gover nment
impr oves it w elfar e and the activity level of ser vices is incr eased by public sector and
other ser vices. Rich households of BAC see their w elfar e r educed because they pay
pr incipally the taxes on r eal estate pr oper ty and car s. On the contr ar y, poor households
ar e better because they r eceive additional tr ansfer s fr om BAC gover nment (this is a r esult
of the assumption that the gover nments have a Cobb-Douglas utility function).
Finally, w hen w e examine the incr ease on VAT taxes fr om ROC gover nment, the
4.2. Sensibility of the spillover effects: a compar ison among scenarios
Under unemployment, the inclusion in the model of a r ule of indexation is necessar y
for the w alr asian mechanism in the labor mar ket is suspended, and ther efor e the model
has to be completed w ith the addition of an equation to deter mine w ages. We have
obser ved that the r esults of the model ar e sensitive to the r ule of indexation of w ages,
especially r egar ding the r ate of unemployment and the w elfar e of households. The
sensitiveness is less significant for the activity levels and for the fiscal spillover effects,
w hich ar e quite r obust.
We consider tw o benchmar k cases of indexation: fixed nominal w ages and fixed r eal
w ages. The fir st case is simpler to r epr esent, and entails only the specification of a
minimum nominal w age level8. The second one r equir es a mor e thor ough examination
because it is necessar y to specify the index of pr ices (local or national) that is going to be
used.
And that is not neutr al for the r esults since the industr ial str uctur e of a r egion can be
differ ent fr om the r elative composition of the basket of goods consider ed in the index of
pr ices; for example, a r egion could be specialized in ser vices w hile w ages could be indexed
to a basket w ith a high pr opor tion of agr icultur al goods, and depending on the change in
taxes the r eaction of r elative pr ices of those gr oups of goods could be differ ent. In tur n,
those str uctur al differ ences w ill explain then the r elative differ ences in r ates of
unemployment and in w elfar e of households belonging in the r egions. For our w or k, w e
take the assumption that r eal w ages w ill be fixed using the index of pr ices fr om the bundle
of consumption fr om poor BAC household.
In addition, the impossibility of substitution betw een BAC goods and ROC goods at
output level maybe str engthen the spillover effects. To analyze this case w e evaluate a
“long r un” scenar io w hich allow s substitution of inputs betw een r egions for five sector s of
pr oduction (Pr imar y sector , Manufactur es, Tr anspor t, Real estate and Financial
inter mediation) at the inter mediate consumption level9. The substitution is r epr esented
w ith an elasticity of substitution 1 betw een r egional inputs (Cobb-Douglas pr oduction
function).
To compar e w ith the basic case pr esented in the pr evious section, w e consider ed
tw o scenar ios:
8 The r esult s of this benchmar k w er e in the pr evious subsection.
a. Scenar io i: fixed r eal w age. Shor t-r un effects: Leontief elasticity at the thir d level
of output (see Figur e 2)
b. Scenar io ii: fixed r eal w age. Long-r un effects: Cobb-Douglas elasticity at the thir d
level of output (see Figur e 2).
The r esults fr om scenar io i. ar e show n in Table 7. If w e compar e the r esults fr om the
fir st simulation, w e see that activity levels and GDP in both r egions ar e low er than the
[image:17.612.106.512.214.428.2]benchmar k case.
Table 7: Scenar io i. r esults fr om tax policy simulations.
Scenar io i.: real wages short r un
Simulation 1 2 3 4
National I ndicator Argentina
GDP -0.18% -3.94% 0.00% -1.33%
Real investment -0.02% -1.68% 0.02% -0.87%
Public and Pr ivate Consumption -0.13% -1.82% -0.01% -0.87% Regional indicator BAC ROC BAC ROC BAC ROC BAC ROC GDP -0.15% -0.20% -5.78% -3.21% 0.01% 0.00% -2.01% -1.06% Real investment 0.57% -0.17% -2.80% -1.40% 0.09% 0.09% -1.44% -0.72% Public and Pr ivate Consumption 0.01% -0.23% -3.88% -0.48% -0.01% -0.01% -1.41% -0.51% Unemployment r ate 9.00% 11.52% 14.20% 12.19% 9.07% 11.41% 10.51% 11.65% Activity level Pr imar y Sector -0.19% -0.02% -2.45% -0.67% 0.00% 0.00% -0.74% -0.17% Activity level Manufactur es -0.18% -0.12% -1.84% -3.69% 0.00% -0.01% -0.36% -0.62% Activity level Ser vices 0.01% -0.14% -2.05% -0.20% 0.01% -0.01% -0.60% -0.22% Welfar e of HH poor -0.14% -0.28% -3.16% -2.84% 0.01% -0.01% -1.24% -1.29% Welfar e of HH r ich -0.23% -0.07% -3.97% -3.21% -0.04% 0.00% -1.18% -0.72% Welfar e of Gover nment 6.52% -0.12% 5.80% 3.26% 0.81% -0.01% -0.51% 0.58%
Sour ce: Our estimations.
This pulls up the r ate of unemployment r ate in both r egions, deter ior ates the ter ms
of tr ade in Ar gentina and consequently households lose w elfar e mor e than in the nominal
w ages case. The tax policy has a low er effectiveness than nominal scenar io because the
incr ease in the BAC gover nment w elfar e is low er .
If w e look now to the second and the four th simulations, w e see that the effects of a
tax incr ease ar e str onger : the activity levels ar e low er and households lose mor e w elfar e
than in the nominal w ages case. Ther e is also a r eduction in the gains of the gover nments
because r eal w ages incr ease their payr oll costs.
Ther e ar e no significant implications for the thir d simulation w hen w ages ar e
adjusted in r eal ter ms.
In gener al, w e obser ve that spillover s effects (for ROC on fir st simulation and for
BAC on thir d and four th simulation) ar e mor e intensive and they have the same qualitative
The r esults fr om scenar io ii. ar e show n on Table 8. The effects on the activity levels
have smoothed w ith the possibility of substitution on the r egional output. This implies
that the spillover effects (for ROC in the fir st simulation and for BAC in the second and
four th simulation) ar e low er than scenar io i. but they ar e gr eater than nominal w ages case
because it is impor tant the effect of indexation of w ages. Mor eover , the effectiveness of the
tax policy is low er because the demand of goods on the r egion w hich has change the policy
[image:18.612.106.513.215.430.2]ar e low er in r elative ter ms as a consequence of input substitution.
Table 8: Scenar io ii. r esults fr om tax policy simulations.
Scenar io ii. : real wages long r un
Simulation 1 2 3 4
National I ndicator Argentina
GDP -0.18% -4.11% 0.00% -1.39%
Real investment -0.01% -1.86% 0.02% -0.93%
Public and Pr ivate Consumption -0.13% -2.02% -0.01% -0.93% Regional indicator BAC ROC BAC ROC BAC ROC BAC ROC GDP -0.17% -0.18% -5.54% -3.55% 0.01% 0.00% -1.91% -1.19% Real investment 0.56% -0.16% -2.75% -1.63% 0.09% 0.09% -1.41% -0.80% Public and Pr ivate Consumption 0.00% -0.22% -3.88% -0.80% -0.01% -0.01% -1.40% -0.62% Unemployment r ate 9.04% 11.52% 13.85% 12.40% 9.07% 11.41% 10.37% 11.73% Activity level Pr imar y Sector -0.17% -0.02% -2.13% -0.69% 0.00% 0.00% -0.64% -0.18% Activity level Manufactur es -0.17% -0.11% -2.01% -3.81% 0.00% -0.01% -0.42% -0.67% Activity level Ser vices 0.00% -0.14% -2.00% -0.48% 0.01% -0.01% -0.58% -0.33% Welfar e of HH poor -0.15% -0.28% -3.34% -3.32% 0.01% -0.02% -1.29% -1.46% Welfar e of HH r ich -0.23% -0.07% -4.01% -3.36% -0.04% 0.00% -1.19% -0.77% Welfar e of Gover nment 6.49% -0.12% 5.84% 3.14% 0.81% -0.01% -0.50% 0.55%
Sour ce: Our estimations.
5.
C
ONCLUSI ONSThis paper pr esents a computational evaluation of the impact of national and
r egional tax policy for tw o r egions in Ar gentina (BAC and ROC).
The main findings of the paper ar e:
As expected, incr eases in national taxes (as VAT) or local taxes in ROC pr oduce a
negative spillover effect on the w elfar es of households and local public sector of
BAC.
Mor e sur pr isingly, incr eases of local taxes in Buenos Air es (e.g. the tur nover tax) r educe w elfar e of households and public sector of the r est of the countr y in a
A gener alized incr ease in taxes in both r egions also causes a negative spill over
effect on BAC.
Ther e ar e no r elevant gener al equilibr ium effects w hen local taxes on households
pr oper ty of r eal estate and car s ar e incr eased.
Those r esults w er e obtained assuming that nominal w ages ar e constant (since ther e
is unemployment it is necessar y to specify an non-mar ket r ule for the deter mination of
w ages) and that the elasticity of substitution is zer o betw een inter mediate inputs fr om
differ ent r egions.
When w e r elaxed those assumptions w e found that:
If w ages ar e constant in r eal ter ms the spillover effects (for ROC on fir st simulation
and for BAC on thir d and four th simulation) w ill be mor e intensive though they
w ill have the same qualitative impact than in the case of minimum nominal w ages.
Positive elasticities of substitution betw een the same kind of input pr oduced in
BAC and in ROC compensate the negative effects of r egional tax hikes, and r educe
the magnitude of the spillover effects.
Ther e ar e still many cases to explor e, and sever al sensitivities to be studied in our
futur e w or k. One of the main scenar ios to study is the inclusion of mobility of factor s
betw een both r egions. That is ver y r elevant to under stand the long r un effect for
compar ative fiscal policies and tax competition betw een the r egions. How ever , this paper
is a fir st step since up to now ther e w as not a RSAM available for BAC, a consistent
separ ation of BAC of the ROC in the National Accounts of Ar gentina, and consequently it
6.
R
EFERENCESBöhr inger C. and T. Ruther for d, 2008. “Combining bottom-up and top-dow n”, Ener gy Economics,
574-596.
Br ooke, A., D. Kendr ick and A. Meer aus, 1992. GAMS: A User ´s Guide, Release 2.25, Scientific Pr ess.
Car denete Flor es, M., 2009. “Feder alismo fiscal a par tir de un modelo de equilibr io gener al aplicado:
Andalucía vs. España”. Revist a de Est udios Regionales. Vol ext. VII, pp. 359-366.
Car denete Flor es, M. and F. Sancho, 2001. “Modelos de equilibr io gener al aplicado par a las
economias r egionales”. IV Encuentr o de Economía Aplicada. Reus, junio 2001.
Car denete Flor es, M. and F. Sancho, 2002. "An Applied Gener al Equilibr ium Model to Assess the
Impact of National Tax Changes on a Regional Economy," Economic Wor king Paper s at
Centr o de Estudios Andaluces E2002/ 13, Centr o de Estudios Andaluces.
Chisar i, O. et al., 2010. “Un modelo de equilibr io gener al computable par a la Ar gentina 2006”. Ser ie
de textos de discusión N° 63.. Instituto de Economía. FACE. UADE. Available on:
http:/ / w w w .uade.edu.ar / DocsDow nload/ Publicaciones/ 4_226_1722_STD063_2010.pdf
Diao X., E. Diaz-Bonilla, S. Robinson, and D. Or den, 2005. “Tell Me Wher e It Hur ts, An’ I’ll Tell You
Who To Call: Industr ialized Countr ies’ Agr icultur al Policies And Developing Countr ies”. IFPRI
Discussion Paper 84. Washington, D.C.: Inter national Food Policy Resear ch Institute.
Fer r is M. and J. Pang (1997). “Engineer ing and Economic Applications of Complementar ity
Pr oblems”, SIAMReview, Vol.39, No.4, December , 669-713.
Flegg, A. and C. Webber , 1996a. “Using location quotients to estimate r egional input-output
coefficients and multiplier s”, Local Economic Quat er ly. 4, 58-86
Flegg, A. and C. Webber , 1996b. “The FLQ for mula for gener ating r egional input-output tables: an
application and r efor mation”, Wor king Paper s in Economics No. 17, Univer sity of the West of
England, Br istol.
Flegg, A. and C. Webber , 1997. “On the appr opiate use of location quotients in gener ating r egional
Input-Output tables: Reply”, Univer sity of the West of England, Br istol.
Flegg A. and C. Webber , 2000. “Regional size, r egional specialization and the FLQ for mula”,
Univer sity of the West of England, Br istol.
Hor r idge, J.M., 1999. “A gener al equilibr ium model of Austr alia’s pr emier city”. Cent r e of Policy
st udies, Monash Univer sit y. Wor kingPaper No. IP-74, October .
Mastr onar di, L. and C. Romer o, 2012. “Estimación de matr ices insumo pr oducto r egionales
mediante métodos indir ectos. Una aplicación par a la ciudad de Buenos Air es”. Documento de
tr abajo. MPRA paper 37006, Univer sity Libr ar y of Munich, Ger many. Available on: http:/ / mpr a.ub.uni-muenchen.de/ 37006/ 1/ MPRA_paper _37006.pdf
Mastr onar di, L., C. Romer o and O. Chisar i, 2012. “Building an input output model for Buenos Air es
City”. Paper pr esented in the XX Input Output Confer ence of the Inter national Input Output
Association in Br atislava (26-29 June).
Minister io de Desar r ollo Económico, 2009. “La economía por teña”. Minister io de Desar r ollo Económico, Gobier no de la Ciudad de Buenos Air es. Agosto 2009.
Nakayama,H., and S. Kaneko, 2003. “Developing a Computable Gener al Equilibr ium Model: Case
Studies on Beijing and Shanghai”. Institute for Global Envir onmental Str ategies. In:
“Pr oceedings of inter national w or kshop on policy integr ation tow ar ds sustainable ur ban
ener gy use for cities in Asia”, Febr uar y. Haw aii.
Robinson, S., A. Cattaneo and M.El-Said, 2001. “Updating and Estimating a Social Accounting Matr ix Using Cr oss Entr opy Methods”, Economic Syst ems Resear ch 13:1, pp. 47-64.
Ruther for d, T., 1999. “Applied Gener al Equilibr ium Modeling w ith MPSGE as a GAMS Subsystem: An
Over view of the Modeling Fr amew or k and Syntax”, Comput at ional Economics, Vol.14, Nos.
Appendix A: Model Str ucture
This section pr esents a simplified ver sion of the model. Let us consider an economy w ith H domestic agents (in our case tw o for each r egion divided by income gr oups). His utility function depends on consumption of domestic goods and ser vices of the j r egions (cj)10, impor ted goods (m), bonds held by households (b), and labor supply
(Ljs).
Each household maximizes her utility function [uH (c1, c2, m, b, Lj s)] subject to the
budget constr aint. Assuming optimal conditions, the agents equalize the mar ginal r ate of substitution to r elative pr ices. The budget constr aint of the domestic agent can be w r itten as:
[1]
2 2 2 2
s
0
1 1 1 1
(1
n j)
jc
jp m
m bw L
j j j j j j j bj j j j
t
t
p
p b
r K
p b
While wj r epr esents w ages in the jthr egion, Ljs is the supply of labor in the jthr egion,
and πj stands for pr ofits in the industr ies pr oducing goods and ser vices in r egion j,
r espectively. ηjand θj r epr esent shar es of domestic agents in pr ofits and in capital in each
one of them (0 < η , φ < 1). Equation [2] assumes that the consumer s only pay national and local taxes in the pur chase of domestic tr adable goods. This is a simplification given that the model includes sever al other taxes obser ved in the economy. The last ter m r eflects the initial bonds held by the household. The gener al model includes also investment decisions of households.
P
RODUCERSThe equilibr ium condition for the mar ket of good j is given by:
[2]
2
, 1
c
F
,
j j i j j
i
x
L K
,w her e F is the pr oduction function of domestic goods pr oduced in the jth r egion cj and
expor ts to the r est of the w or ld xj, in ter ms of capital and employment demanded
Pr ofits of the industr y ar e:
[3]
2
, 1
p
- w
d- r
dj j j j i j j j j
i
x
c
L
K
w her e rj indicates capital r emuner ation in the jth r egion and wj r epr esents w ages in
the jthr egion. The maximization conditions of benefits ar e:11
[4]
p F
Kr
0
j
j
j
,[5]
F
Lw = 0
j
j j
p
,
w hen the levels of capital use and labor ar e deter mined optimally. In equilibr ium the demand of factor s ar e equal to the supply of them, i.e the demand of labor in the jth r egion must be equal to the supply of labor fr om I r egions.
[6] 2 1
=
d s j i iL
L
, [7] 2 1=
d s j i iK
K
Under unemployment , equation [6] is r eplaced w ith a r ule of w age deter mination, e.g. w ≥ 1, w hen nominal w ages have a minimum level.
BAC
PUBLI C SECTORThe Public Sector of BAC has a budget constr aint given by:
[8]
c
0Gjw L
G j Gj1
j j j b j j b
t p
p b
T
p b
for j
.The left side r epr esents local tax r evenue in BAC, as w ell as bonds sales and tr ansfer s r eceived fr om the national gover nment. The r ight side r epr esents the pur chases of labor and bonds (so that ther e is a net position in bonds given by bG – bG0). Notice that
her e w e assume that the gover nment is not par ticipating actively in the mar kets for goods or ser vices, although that does not occur in the gener al model. In this simplified case, the gover nment collects taxes and uses the pr oceedings to hir e w or ker s and r epay debt (the gener al model includes investments and gover nment consumption).
N
ATI ONAL PUBLI C SECTORThe Public Sector in the r est of countr y includes pr ovinces and national public sector . It has a budget constr aint given by:
[9]
2 2 2 2
G
x 0
1 1 1 1
c
c
t
Gw L
G1, 2
j j j n j j j b j j b
j j j j
t p
t p
x
p b
T
p b
for j
.The left side r epr esents local (ROC) and national tax r evenue, including expor t taxes, as w ell as bonds sales minus the tr ansfer s paid to BAC gover nment. The r ight side r epr esents the pur chases of bonds (so that ther e is a net position in bonds) and labor w hich ar e demanded in the tw o r egions at differ ent pr ices. Notice that her e w e assume that the gover nment is not par ticipating actively in the mar kets for goods or ser vices, although that does not occur in the gener al model. In this simplified case, the gover nment collects taxes and uses the pr oceedings to hir e w or ker s and r epay debt (the gener al model includes investments and gover nment consumption).
E
XTERNAL BALANCENote that in this ver sion, the exter nal sector does not buy domestic bonds, w hich is also a str ong assumption that w e leave aside in the gener al model. Given these assumptions, w e can obtain an equilibr ium in the follow ing cur r ent account as:
[12]
2 2
1 1
(1
)
(1
)
x
m j j j j j
j j
p x
p m
r K