Mina Elmarkhi
*, Sanae Sadek, Khadija Elkharrim, Fatima Benelharkati,
Fatiha El Khayyat, Driss Belghyti
Environment and Renewable Energy Laboratory, Faculty of Sciences, Ibn Tofaїl University, Kenitra, Morocco
Abstract
The consumption of non-potable water is the main cause of mortality and morbidity in the world [1]. 88% of diarrhea cases worldwide are attributed to unsafe drinking water; inadequate sanitation or inadequate is responsible for 1.5 million of deaths every year, mostly in children [1] [2]. Household waste. Leachate can be considered among the potential sectors that can contribute to the degradation of water quality and soil. To this end, we selected physico- chemical inorganic elements like indicator of pollution in the neighboring groundwater discharge of the water table in the region of Ouled Berjal to as- sess the quality of the region’s water wells in M’nasra. The wells in full dis- charge have a very high pollution levels and water collected from wells located right near the discharge of Ouled Berjal shows lower levels of contamination. So the well water away from the landfill is quite low compared to the other groups.
Keywords
Pollution, Physico-Chimique, La Décharge D’Ouled Berjal, Kenitra, Maroc
1. Introduction
This product of the dissolution of organic matter and trace elements (heavy metals, organic pollutants and chemicals, radionuclides...) is a source of pollu-tion of soil and water, including groundwater. Among the inorganic compounds found in raw leachate are the heavy metals that attract attention because of their potential toxicity. Although these substances are generally present at low con-centrations in the leachate (with the exception of iron and manganese), some can be dangerous if they infiltrate at a source of drinking water. The microbio-logical contamination, parasitomicrobio-logical, biomicrobio-logical and physicochemical water from groundwater poses real public health problem [3] [4] [5].
How to cite this paper: Elmarkhi, M., Sadek, S., Elkharrim, K., Benelharkati, F., El Khayyat, F. and Belghyti, D. (2017) Assess- ment of Groundwater Water Quality in M’nasra (Morocco). Journal of Water Re-source and Protection, 9, 111-120. https://doi.org/10.4236/jwarp.2017.92009
Received: December 5, 2016 Accepted: February 1, 2017 Published: February 4, 2017
Copyright © 2017 by authors and Scientific Research Publishing Inc. This work is licensed under the Creative Commons Attribution International License (CC BY 4.0).
http://creativecommons.org/licenses/by/4.0/
2. Milieu Materials and Methods Study
2.1. Study Milieu
The samples were taken 23 wells, three wells (P21, P22, P23) are located inside the discharge, three other are adjacent to the discharge (P15, P16 and P17) and the remainder wells (P1, P2, ..., P20) distributed in the study area of M’nasra re-gion. These samples are filled into plastic bottles and then sent to the laboratory ORMVAG, Kenitra. To better exploit the data collected, we have divided them into three groups according wells the distance that separates them from the source:
Group 1 where the wells are within the discharge is composed of the wells 21; 22 and 23.
Group 2 consists of moderately distant from the discharge shaft (15; 16 et 17). Group 3 includes the remaining wells often further.
2.2. Materials and Methods Study
Parameters Unit Equipment used
Turbidity NTU Turbidity
Potential hydrogen - PH-meter model HANNA instruments.
Electrical conductivity us/cm Multi-parameter analyzer CONSORT-C535
Salinity mg/l Multi-parameter analyzer CONSORT-C535 Calcium, magnesium,
chlorine, bicarbonate mg/l Titration solution Nitrate, ammonium mg/l Distillation apparatus (BUSHI)
Potassium and Sodium mg/l Flame photometer
3. Results and Discussion
3.1. Potential Hydrogen
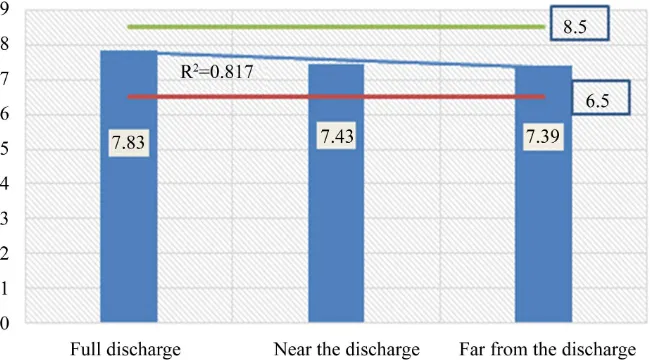
The distribution of the potentials of hydrogen according to the distances which separates the relief wells also shows a highly significant difference (Fisher = 7.41; p < 0.001). The mean of the classification by the Tukey test, these three groups shows that the wells in the discharge have a slightly basic pH (pH = 7.83), fol-lowed by the other wells which are either at an average distance or far from the source with a pH of 7.43 and 7 respectively, 39. In addition, the three groups were very uniform in having a very low coefficient of variation ranging from 0.33% to 0.74% (Figure 1).
For the irrigation water, usually the recommended pH is between 6.5 and 8.5
Figure 1. Evolution of hydrogen water potential wells as a function of distance.
3.2. Electrical Conductivity (EC)
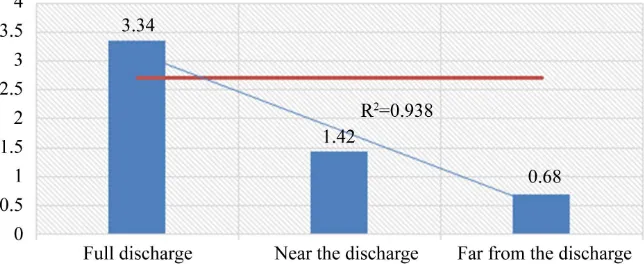
To locate the status of wells in the three groups, we proposed to establish a va-riance analysis to a single dimension effect “distance”. The results of this analysis show a highly significant difference (p < 0.000) between the mean of the conduc-tivity of the groups studied. The comparison of averages Tukey identified three non-overlapping groups. Group 1 comprise the wells in full discharge with a conductivity of up to 3.34 ms/cm, group 2 close to the landfill with an average conductivity of 1.42 ± 0.073 and end wells located at a significant distance from the source and which are characterized by low conductivity values (0.68 ± 0.021). The evolution of the average conductivity in wells of group 1 were very homogeneous (CV = 0.00%) opposite wells of the groups 2 and 3 show, respec-tively, significant variation coefficient of 35% and 43% (Figure 2).
Figure 2. Evolution of the electrical conductivity of the water of wells as a function of distance.
3.3. Salinity
The results in showed that the distance between the wells in the discharge is a classification criterion, the difference is therefore very highly significant (Fisher = 781.52, p < 0.000). Three categories were deduced by the Tukey test. Indeed, a first category represented by the distant wells of the discharge (mean = 0.436 g/l), followed by Group 2 (mean = 0.907 g/l) and finally the category of wells in the landfill (wells 21, 22 and 23) with a concentration of 2.13 g/l. high dispersion was pronounced in groups 2 and 3 respectively, with coefficients of variation of 39.12% and 51.57% (Figure 3).
3.4. Hardness: Calcium (Ca
2+) + (Mg
2+) (Mineral Matter)
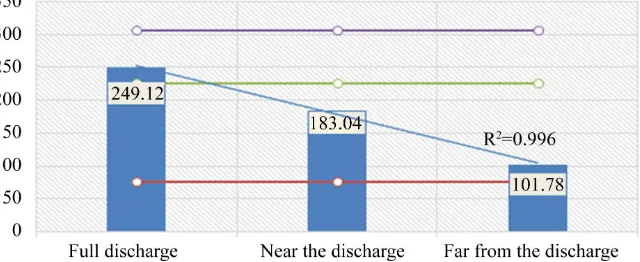
The results of the analysis of variance shows that the factor “distance” in a very highly significant (Fisher = 247.720; p < 0.000). Therefore, the comparison of average class sinks into three distinct categories. The first category consists of the further well (group 3) and having registered moderately lower concentra-tions. The second category includes the well in the group 2 (sufficient distance greater than that of group 1) with an average of 183.04 ± 8.92 mg/l and a group variation of 33.75%. However, the group of wells located in the heart of the land-fill is isolated from the other groups, while mean values with significant Ca2+ +
Mg2+ (mean = 249.12 ± 8.2 mg/ml).
Furthermore, the recorded concentrations well above those set as appropriate limits, by the Moroccan authorities. These values indicate that the waters espe-cially the first two groups are assumed to be very hard (Figure 4). The total hardness of water is produced by calcium and magnesium salts contained there-in. This parameter has a large variation which is linked to the lithology of the aquifer and in particular to the composition of magnesium and calcium. Rock formations containing divalent metals (Mg2+, Ca2+, ...) are responsible for the
hardness.
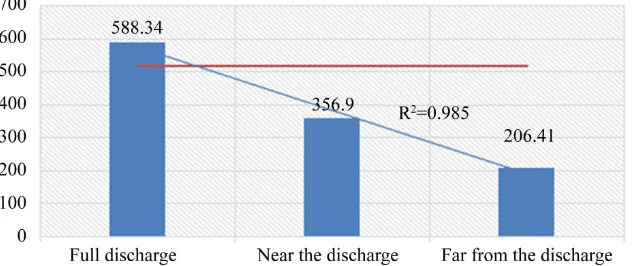
3.5. Calcium (Ca
2+) (Mineral Matter)
The graphical representation of the Ca2+ content per well revealed a large
Figure 3. Evolution of the salinity of wells as a function of distance.
Figure 4. Evolution of the hardness of the water wells depending on the distance.
analysis of variance one-dimensional “effect well” who was very highly signifi-cant (Fisher = 71.53; p < 0.000). The lowest content (38.40 mg/l) is recorded in the well 19 and a maximum concentration of 237.60 mg/l is displayed in the 15 wells.
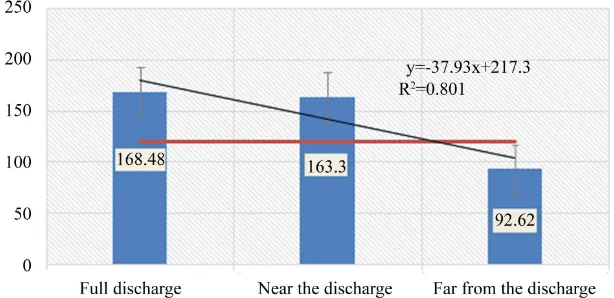
A highly significant difference was marked between the averages of the three groups, and their classification did retain two non-overlapping categories. The first category consists only of group 3 whose average grade is low (Mean = 92.62 mg/l), the second category includes the Group 1 and 2 which display relatively high concentrations (168.48 and 163.30). The group variation exceeds 28%, this explains many nonseasonal stability Ca2+.
Possible negative correlation was marked between the distance between the well source and also of the Ca2+ content. From Figure 5, these values often
ex-ceed accepted standards for water consumption for group 1 and group 2. This shows a pollution of groundwater by calcium probably from the discharge through the leachate.
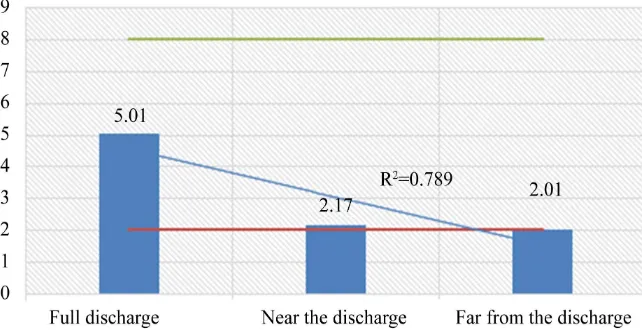
3.6. Magnesium (Mg
2+) (Mineral)
[image:5.595.216.536.258.389.2]Figure 5. Evolution of the calcium water wells depending on the distance.
The first category is composed of the said further shaft and which are characte-rized by a concentration of 9.14 ± 4.79. The second category includes the well in the group 2 and which are characterized by an average concentration of 19.74 mg/l. The last category includes the well having a relatively high average 80.4 ± 4.22 mg/l, 95% of the observations are grouped around this average value (CV = 5.23%) (Figure 6).
Figure 6 the higher magnesium concentration is observed in the discharge with an average of 80.64 mg/L which exceeds the standard Moroccan what set at 50 mg/l (Ministry of Environment, 2002), this implies a change in the minerali-zation of the waste. The analysis showed an average concentration of well water is of the order of 11. 26 mg/l with a minimum of 1. 91 mg/l and a maximum of 26.4 mg/l.
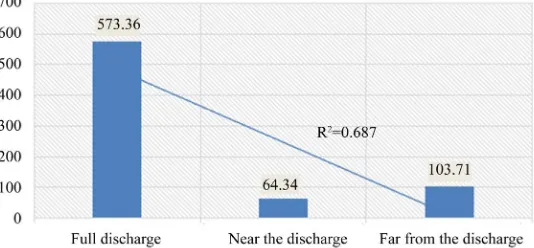
3.7. Sodium (Na
+) (Mineral Matter)
Analysis of variance single factor “distance effect” gives a fairly high value of Fisher (F = 3215.85). The effect therefore of the distance between the borings is very highly significant (p < 0.000). The comparison of averages has classified these groups into three distinct categories. The first category is characterized by very low average concentrations (=58.83 ± 2.49 mg/l) and the third category for the further shaft is marked this time by very high levels (=949.67 ± 19.72 mg/l). Wells groups 2 and 3 have identified a wide variation intra category respectively resulted in coefficients of variation of 74.52% and 60.85% (Figure 7).
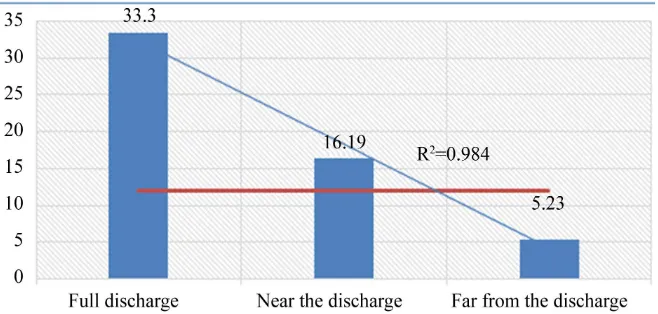
3.8. Potassium (K
+) (Mineral Matter)
Analysis of variance shows that the distance between them to have a major effect on the potassium content. The comparison of means by the Tukey resortir test has three non-overlapping categories. The first category includes wells that are far from the discharge (mean = 5.23 mg/l) and the third category contains wells that displayed contents K+ very high (mean = 33.30) (Figure 8).
3.9. Ammonium (
NH4+)
Figure 6. Evolution of Magnesium water wells depending on the distance.
Figure 7. Evolution of Sodium Water wells depending on the distance.
Figure 8. Evolution of Potassium water wells depending on the distance.
[image:7.595.210.539.464.621.2]Figure 9. Evolution Ammonium water wells depending on the distance.
3.10. Chloride (Cl
−)
The results of the analysis of variance show that the distance separating the dis-charge shaft has a major effect on the distribution of the chlorine content (Fisher = 4321.74; p 0.000). This dispersion was possible to classify the wells into three groups. Indeed, the well of the first group showed concentrations ranging 609 mg/l and 820 mg/l and those in the third group; they fluctuate between 35.5 mg/l and 161.4 mg/l (Figure 10).
3.11. Nitrate (
NO3−)
ANOVA confirmed the highly significant effect of the position of the wells on the distribution of concentrations. The average comparison revealed 14 distinct groups; the latter group is made up of wells that displayed high levels of NO3
−
(Figure 11).
Analysis of variance “distance effect” shows a highly significant difference. Perfect discrimination was reported, resulting in three non-overlapping groups, maximum values were recorded in group 1, group 2 and then followed a third group where wells are not too loaded ion NO3
−.
3.12. Bicarbonate (
HCO3−
)
Analysis of variance for a single classification factor shows that the position of the well has a highly significant effect on the distribution of concentrations of bicarbonate (Fisher = 1539.37; p < 0.000), and the distance between these wells to landfill (Fisher = 394.26; p < 0.000) (Figure 12). However, the comparison of means was possible to classify the wells in order of increasing bicarbonate con-centration, so the closest are most likely to be contaminated with bicarbonates.
3.13. Sulphate (
2 4SO −
)
Figure 10. Evolution of chloride water wells depending on the distance.
Figure 11. Evolution of nitrate water wells depending on the distance.
Figure 12. Evolution of the bicarbonate water wells depending on the distance.
comparison of means gave three non-overlapping categories, further were less sensitive to concentrations of ( 2
4 SO −). The distribution contents ( 2
4
[image:9.595.217.533.475.608.2]Figure 13. Evolution of Sulfate water wells depending on the distance.
4. Conclusion
The study of parameters indicative of contamination from leachate generated by the discharge of Ouled Berjal allowed us to identify a mineral water contamina-tion of the water table. Indeed, it is the water collected from wells 21, 22 and 23, located right in the landfill and in the flow direction of the web which are the most vulnerable to contamination mineral, organic, and inorganic things.
References
[1] OECD (2003) Biotechnology for Water Use and Conservation. The Mexico '96
Workshop.
[2] Pruss-Üstün, A., Bos, R., Gore, F. and Bartram, J. (2008) Safer Water, Better Health: Costs, Benefits and Sustainability of Interventions to Protect and Promote Health. World Health Organization, Geneva, 60.
[3] Scanlon, B.R., Reedy, R.C., Stonestrom, D., Prudic, D.D.D.E. and Dennehy, K.F. (2005) Impact of Land Use and Land Cover Change on Groundwater Recharge and Quality in the Southwestern US. Global Change Biology, 11, 1577-1593.
https://doi.org/10.1111/j.1365-2486.2005.01026.x
[4] El-Naqa, A., Al-Momani, M., Kilani, S. and Hamouri, N. (2007) Groundwater Dete-rioration of Shallow Groundwater Aquifers Due to Overexploitation in Northeast Jordan. CLEAN—Soil, Air, Water, 35, 156-166.
https://doi.org/10.1002/clen.200700012
[5] Eblin, S.G., Sombo, A.P., Soro, G., Aka, N., Kambiré, O. and Soro, N. (2014) Hydro- chemistry of Surface Water in the Region Adiake. Journal of Applied Biosciences, 75, 6259-6271. https://doi.org/10.4314/jab.v75i1.10
[6] Eddy, M. (1991) Wastewater Engineering: Treatment, Disposal, and Reuse. 3rd Edi-tion, McGraw-Hill, New York.
[7] Arcand, Y., Paris, J., Rouleau, D. and Mayer, R. (1989) Effect of Operation Parame-ters on the Settling of Organic Sludge from a Treatment Unit of Refinery Waste Water. Journal of Water Science, 2, 43-69.
[8] El-Kharmouz (2011) Studying the Impact of Leachate from the Old Landfill of the City of Oujda (Eastern Morocco) on the Physicochemical Quality of Groundwater and Surface Water. Larhyss Journal, No. 16, 105-119.
Maximum dissemination of your research work